
The market's been playing with fire for weeks. It finally got burned. The S&P 500 tumbled 3.3% last week, marking the worst weeks for stocks since October. And yet, even with the setback the rally's not broken. Dented and bent? Yes, but not broken. The sellers didn't drive the indices all the way under the very first of their technical support lines, so there's still plenty of opportunity for the market to rebound.
Will that happen? It's too soon to say. But, we're seeing some red flags we've not seen wave in a long time.
We'll look at those warnings in some detail below. First, let's recap last week's big economic announcements and preview what's coming this week.
Economic Data Analysis
Not only was it a busy week, it was a good one… at least in terms of economic reports.
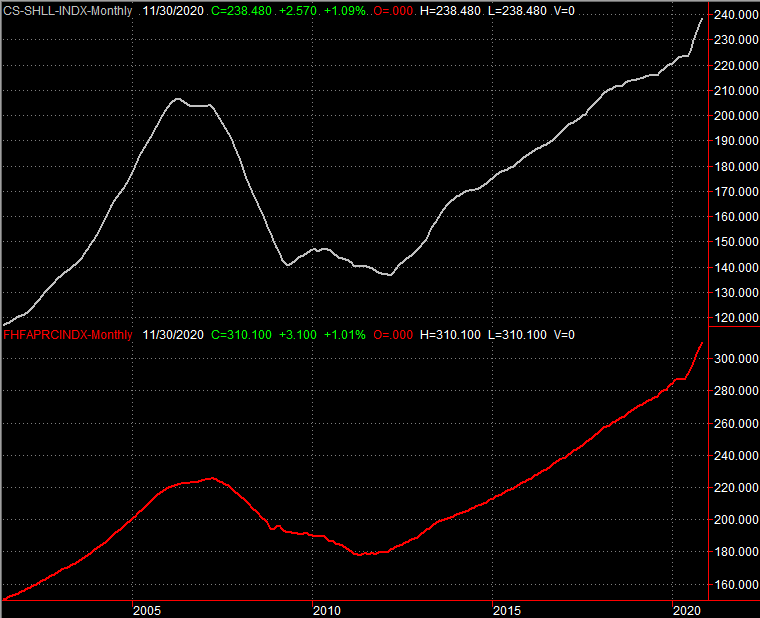
Take home prices for instance. Although both data sets are for the month of November, the Case-Shiller Home Price Index was up 9.1% year over year, while the FHFA Housing Price Index improved 1.0% between October and November (which is actually an annualized pace in excess of 9.0%).
Home Price Index Charts
 [1]
[1]
Source: Standard & Poor's, FHFA, TradeStation
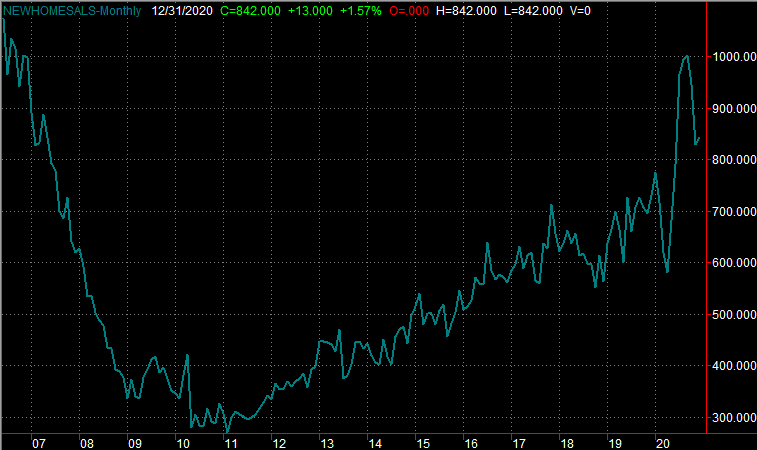
While it's possible this growth has slowed since the point in time being examined by those organizations, the housing market is still quite strong. How do we know? New home sales, for one. While the yearly pace of 842,000 didn't quite live up to the expected 860,000 for December, that's still up from November's clip of 829,000, and the second-best reading in years. Also bear in mind that sales of existing homes hit a multi-year high pace of 6.76 million last month (not shown below), showing steady forward progress from May's multi-year low.
New Home Sales Charts
 [2]
[2]
Source: Census Bureau, TradeStation
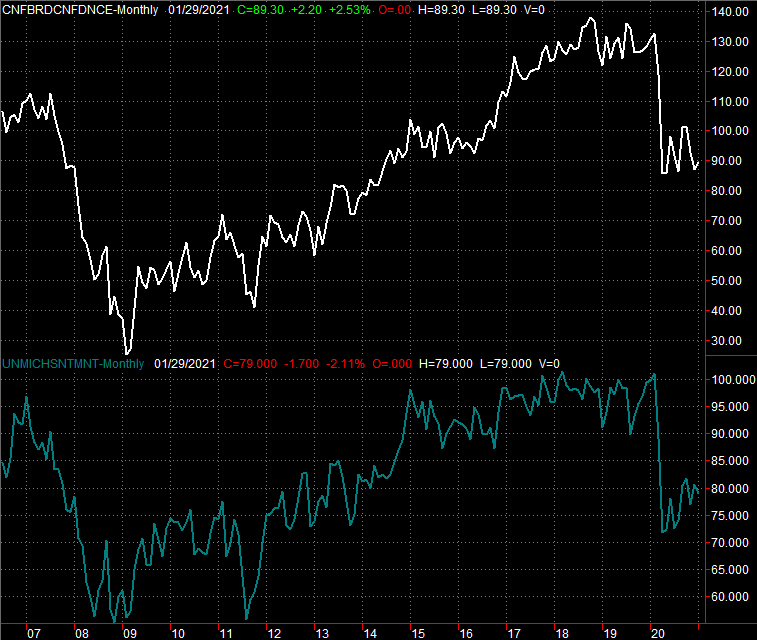
Given these trends, it's not surprising that sentiment continued to improve last month… or at least not stumble much. The Conference Board's consumer confidence figure rose from 87.1 to 89.3 in January, and while the Michigan Sentiment Index fell from 79.2 to 79.0. Neither is anywhere near their pre-COVID levels, but neither is still falling either. We're seeing subtle (even if inconsistent) progress on these fronts.
Consumer Sentiment Charts
 [3]
[3]
Source: Conference Board, University of Michigan, TradeStation
Other noteworthy news from last week: It came as no surprise, but the Federal Reserve didn't change interest rates last week when it had a scheduled opportunity to do so. The Fed Funds Rate still stands at a targeted range between 0.0% and 0.25%, but holds steadily at the midpoint of 0.13%. The FOMC also remains pretty dovish. Also, the first (of three) estimates of Q4's GDP growth was posted last week. Analysts were calling for 4.4% growth, but we only saw 4.0%. Keep it in perspective. We're in a fast-moving and difficult-to-assess environment. Still, it was a shortcoming that rattled stocks.
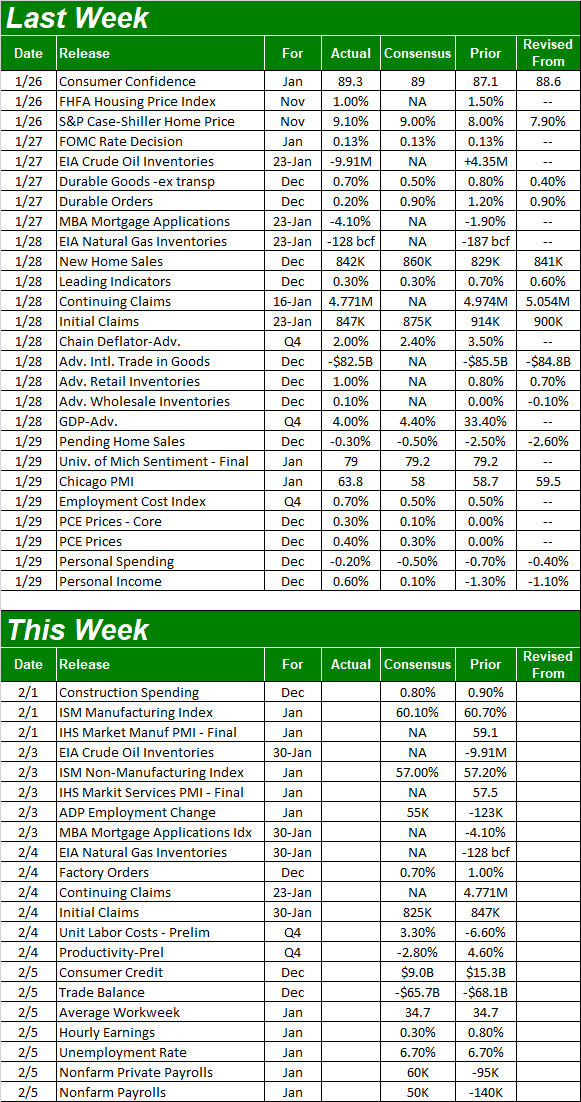
Everything else is on the grid.
Economic Report Calendar
 [4]
[4]
Source: Briefing.com
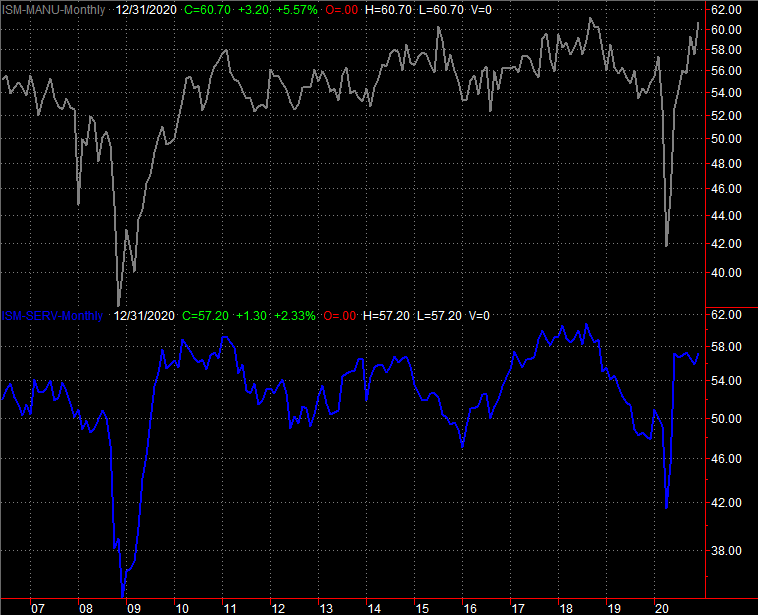
This week's going to be almost as busy, ending with a look at January's jobs picture. Before we get to that, though, we'll hear about last month's ISM numbers… manufacturing and services. Both are projected to peel back, but only just a bit. Both remain well above the critical 50 level that divides growth and contractionary environments.
ISM Index Charts
 [5]
[5]
Source: Conference Board, University of Michigan, TradeStation
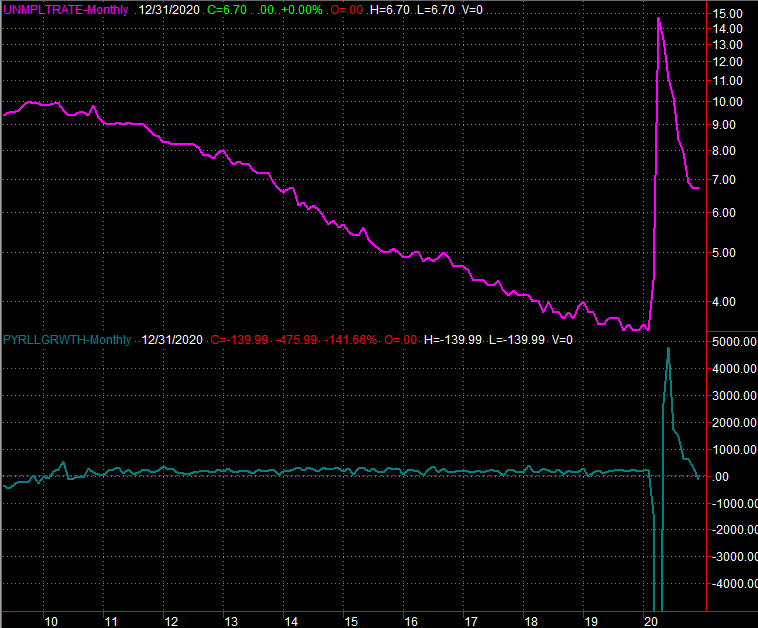
As for the employment picture, economists believe we actually added 50,000 nonfarm jobs in January, which means the current unemployment rate of 6.7% shouldn't budge. They may be on target. This is a report, however, that could be explosive for the market if the data doesn't come in close to those expectations.
Unemployment Rate and Payroll Growth Charts
 [6]
[6]
Source: Conference Board, University of Michigan, TradeStation
Stock Market Index Analysis
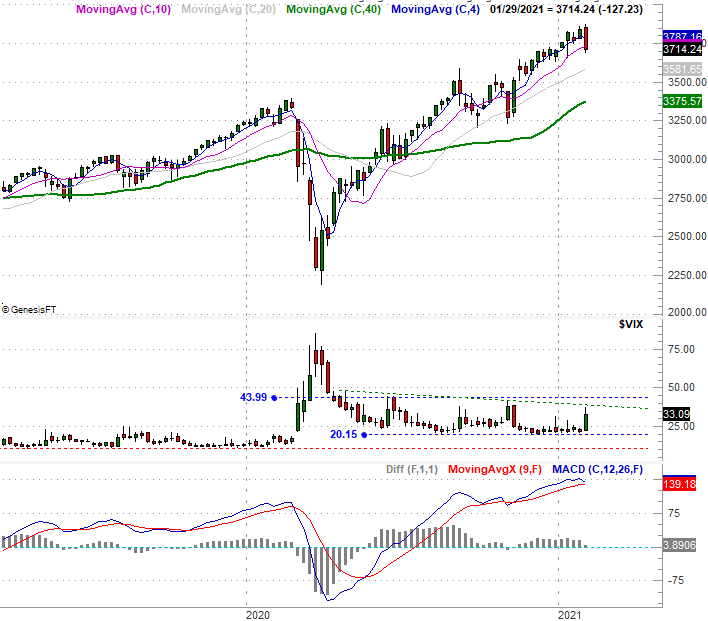
We'll start this week's analysis with a bird's-eye view of the S&P 500, using the weekly chart to offer than perspective. It doesn't take a genius to recognize — visually — to see last week's rout was a significant blow.
S&P 500 Weekly Chart, with VIX and MACD
 [7]
[7]
Source: TradeNavigator
It's not just the sudden and sweeping reversal from a rally, however, that's curious. The shape and placement of last week's bar is also noteworthy. Last week's open was almost above the prior week's high, and last week's low was definitely below the previous week's low — and the previous week was bullish. Last week's reversal engulfed the prior week's entire range, resulting in what's (literally) called a bearish engulfing bar. It's a clue that the reversal is serious.
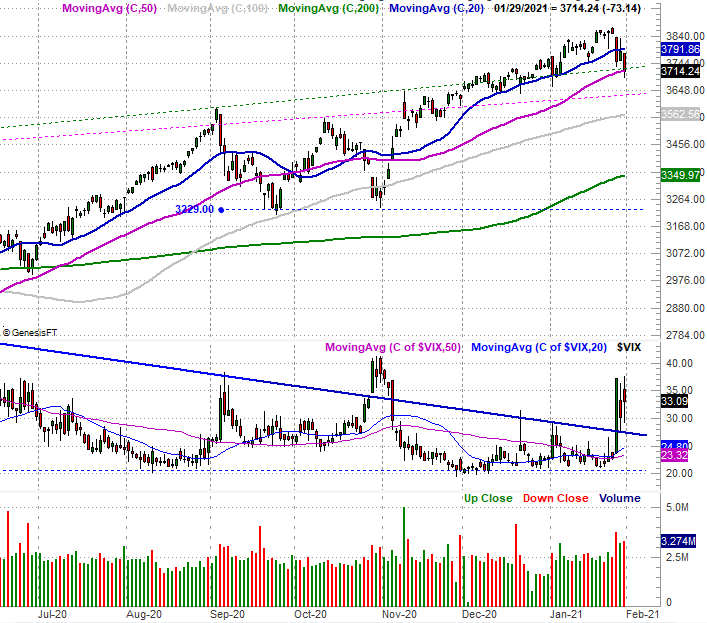
To that end, notice the VIX finally moved as well. Also note the VIX didn't punch through its technical ceiling around 39.5 or the other one at 44.0. Both of those resistance levels will need to snap before we really sweat, and in the same vein, the S&P 500's 50-day moving average line (purple) will need to fail as a floor before the bulls need to panic. The daily chart of the S&P 500 paints the 50-day moving average line's placement in a little more detail. It struggled on Friday, but ultimately held up when push came to shove…as the closing bell neared.
S&P 500 Daily Chart, with VIX and Volume
 [8]
[8]
Source: TradeNavigator
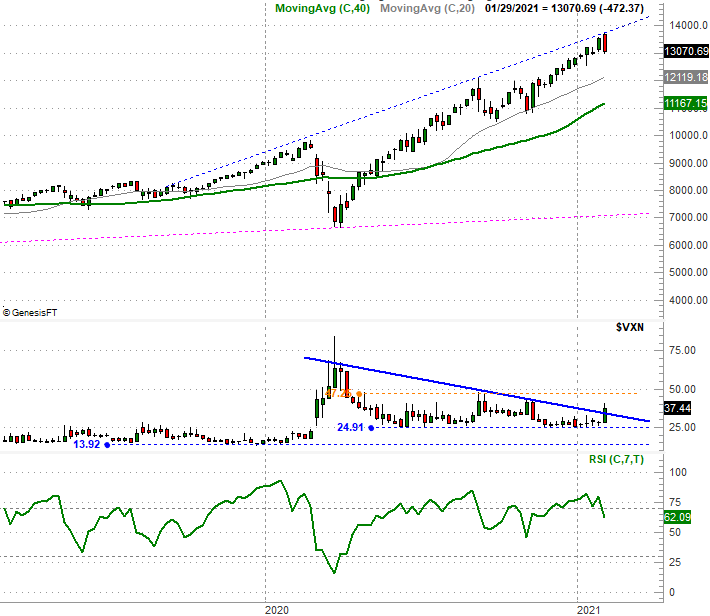
The same basic story applies to the NASDAQ Composite's charts, but with one exception. Whereas the NASDAQ dished out a bearish engulfing pattern last week after bumping into a long-standing resistance line, the composite's volatility index — the VXN — did push through its falling resistance line (thick, blue) in the process.
NASDAQ Weekly Chart, with VXN and RSI
 [9]
[9]
Source: TradeNavigator
Still, the NASDAQ Composite isn't in a full-blown unstoppable downtrend.
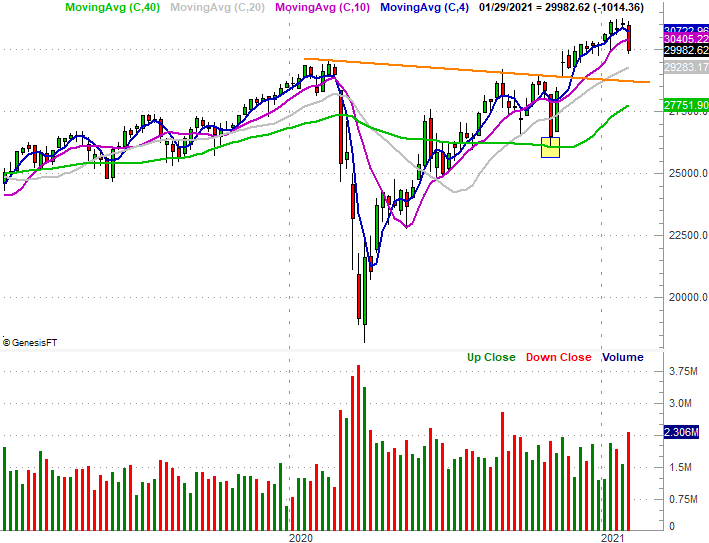
That being said, perhaps the biggest red flag from last week came from an index we rarely dissect… the Dow Jones Industrial Average. The blue chip index DID tumble below its 50-day moving average line (purple) last week as part of its 3.3% selloff. Given these names should theoretically be safer than most other names, this setback is telling. The volume behind the selloff is also telling.
Dow Jones Industrial Average Weekly Chart, with Volume
 [10]
[10]
Source: TradeNavigator
It's possible last week could have been nothing more than a fluke. We are, after all, up more than 60% in ten months, and deep into record-high territory. We could expect to see some profit-taking. Most of these corrections have been short-lived since last March.
One of them is eventually going to be more than a mere stumble though, and each day that doesn't happen brings us closer to that day.
Let's see what this week holds before jumping to any major conclusions. Just bear in mind the bulls are likely going to push back sometime no matter what. That effort won't mean much. It's the response to that effort you'll want to watch. If the bears are more serious than the bulls here, that rebound effort should be pretty short-lived.