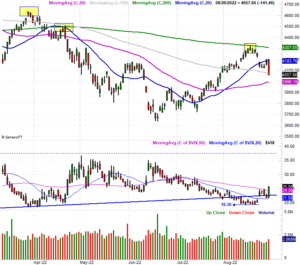
The bulls were holding on for the better part of last week, just looking to stay in position for a rebound. Friday's drubbing, however, made them lose their ever-weakening grip. Indeed, after Friday, the bulls have everything to prove. The sheer scope of the selloff suggests that's what was in the cards no matter what Fed Chairman Jerome Powell had to say about the economy, and subsequently, the market.
We'll take our usual detailed look at it all in a moment. First, let's review last week's biggest economic announcements and preview what's in the lineup for this week. Spoiler alert: The grand finale is August's jobs report.
Economic Data Analysis
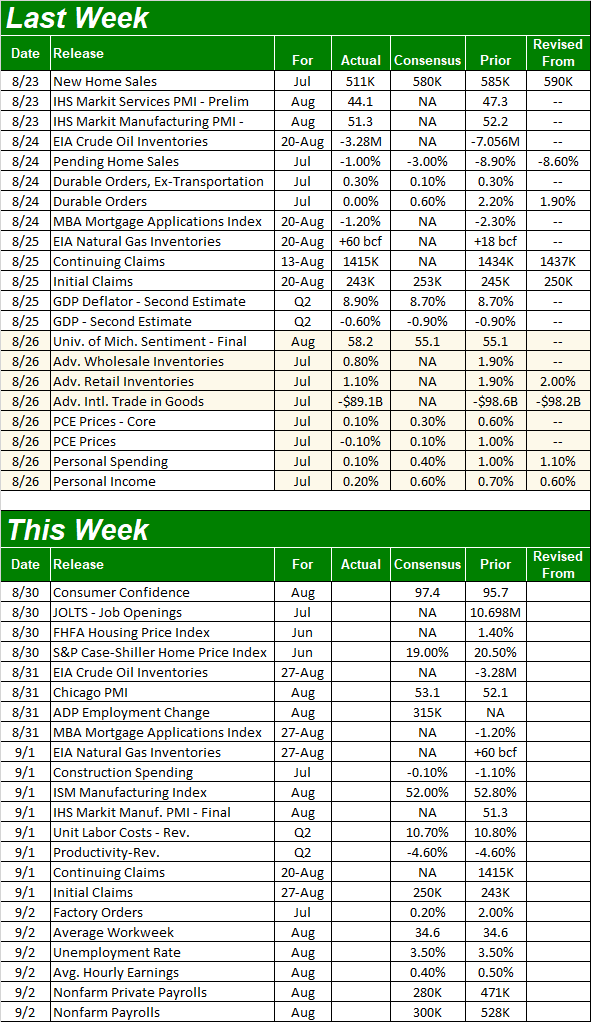
We heard a good deal of economic news last week, though only a couple items of any real interest… Tuesday's look at July's new home sales. The figure of 511,000 is not only well short of the expected 580,000, but fell to more than a six year low. Given a similarly-dramatic plunge in existing home sales, it's difficult to suggest a real estate recession isn't already upon us. Homebuilders certainly say so anyway.
New and Existing Home Sales Charts
 [1]
[1]
Source: U.S. Census Bureau, National Association of Realtors, TradeStation
In this same vein, pending home sales fell slightly again in July, following June's huge 8.9% stumble.
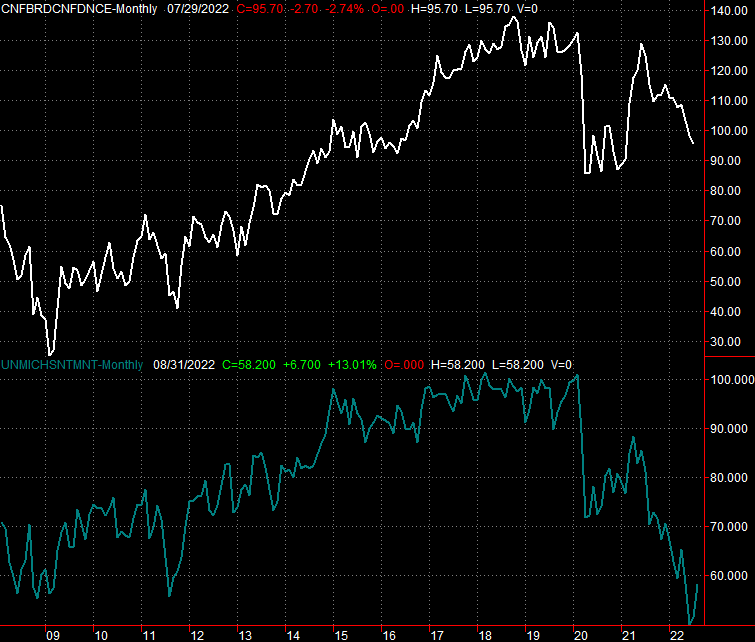
We also heard the third and final look at the University of Michigan's consumer sentiment index. It bounced sharply from July's levels, though July's levels were a multi-year low. Consumers are still worried overall, and bear in mind that third reading was taken before Friday's market rout.
Consumer Sentiment Charts
 [2]
[2]
Source: Conference Board, University of Michigan, TradeStation
We'll round out the look at consumer confidence with the Conference Board's measure of consumer confidence on Tuesday. It too's been in the relative gutter, and though economists are modeling a slight uptick from July's low, people aren't feeling much better on this front either.
Everything else is on the grid.
Economic Calendar
 [3]
[3]
Source: Briefing.com
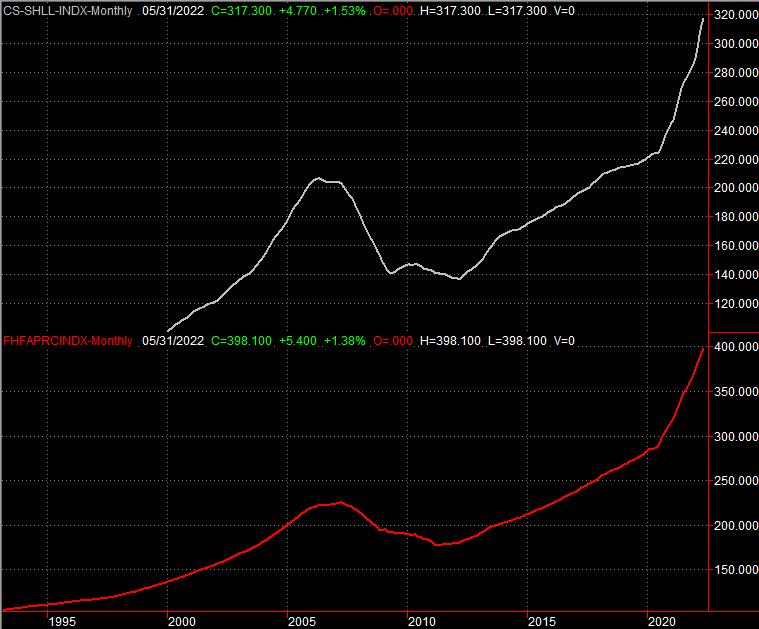
The real estate picture gets rounded out this week. On Tuesday look for the FHFA Housing Price Index and the S&P Case-Shiller Home Price Index. Both have been roaring of late, and that's not expected to have changed through June. Just bear in mind we're now moving into September, and much has taken a turn for the worst in just the past couple of months. Also keep in mind that the average home price looks at the average sales price, but doesn't account for the quantity of home (or lack thereof) sold.
Home Price Charts
 [4]
[4]
Source: Standard & Poor's, FHFA, TradeStation
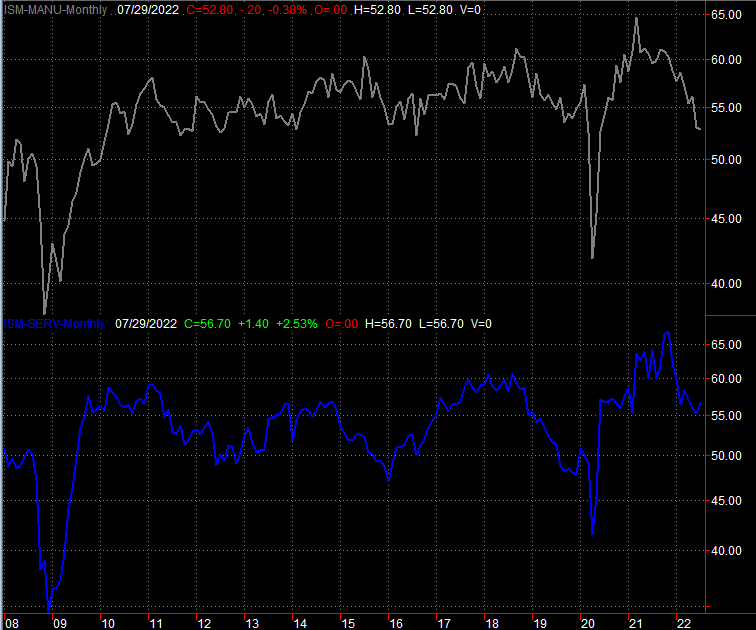
The Institute of Supply Management's Manufacturing Index will be updated on Thursday. Economists are calling for a slight contraction, from 52.8 to 52.0. That's still above the critical 50 level, though we're inching closer to the level that technically indicates a shift to net weakness.
ISM Manufacturing and Services Index Charts
 [5]
[5]
Source: Standard & Poor's, FHFA, TradeStation
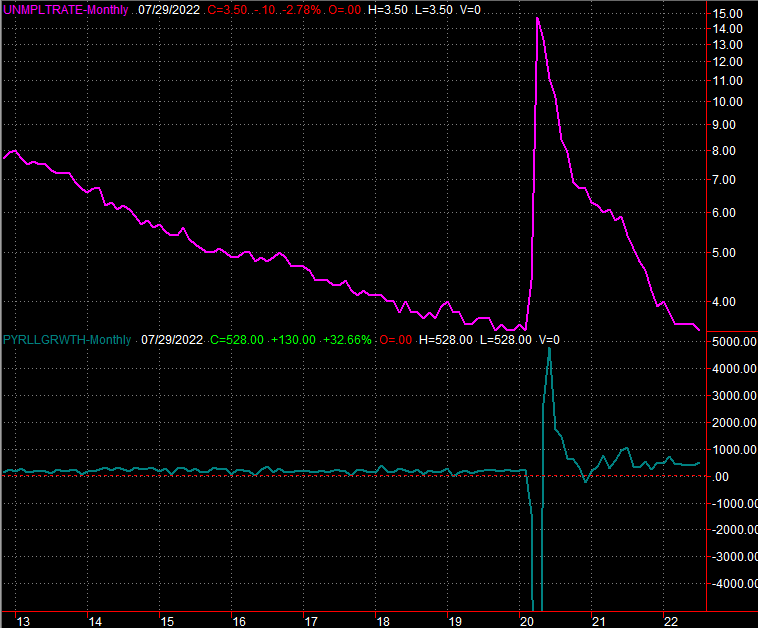
The biggie, of course, is Friday's jobs report. Analysts expect 300,000 additional payrolls to be added last month, although that's a slowdown from July's 528,000 new jobs, and won't likely be enough to drag the unemployment rate down from its current rate of 3.5%. Then again, at 3.5%, the unemployment rate is about as low as it can structurally go.
Payroll Growth and Unemployment Rate Charts
 [6]
[6]
Source: Bureau of Labor Statistics, TradeStation
Stock Market Index Analysis
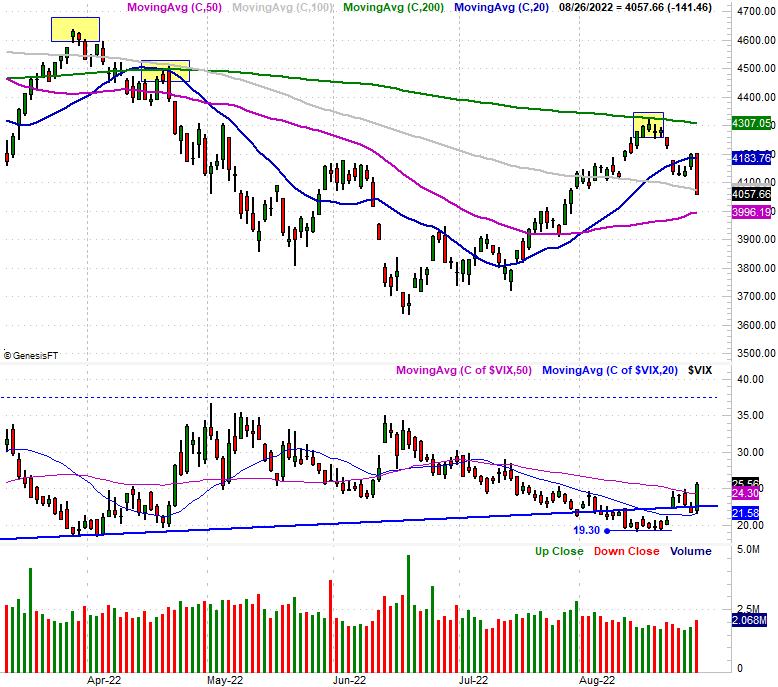
One bad day changed everything. On Thursday, the S&P 500 finally worked its way back above its 20-day moving average line (blue) at 4184. Friday's 3.3% selloff dragged it all the way below its 100-day moving average line (gray) at 4073. That breakdown to lead the index to its lowest close in weeks was decisive, not unlike many of the daily losses seen in April and May, when the selling was largely relentless, and persistent. At the same time, notice the S&P 500's Volatility Index (VIX) popped above its 50-day moving average line (purple) after struggling to poke above it the better part of last week; the VIX also seems to have pushed up and off of a horizontal floor at 19.3, underscoring Friday's thrust.
S&P 500 Daily Chart, with VIX and Volume
 [7]
[7]
Source: TradeNavigator
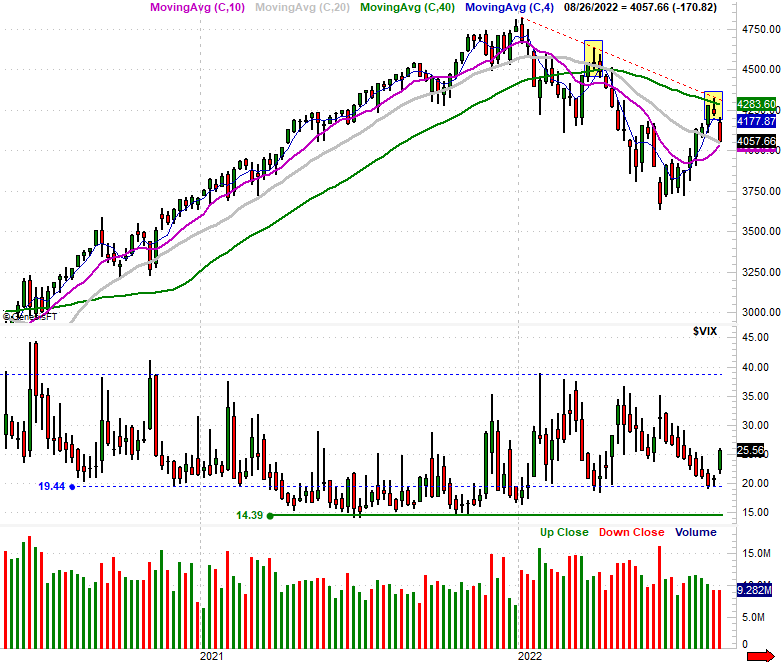
Here's the weekly chart of the S&P 500, for perspective. Last week's loss was a doozy, though the VIX's pop is even more pronounced from this vantage point. Mostly though, the weekly chart's past couple of weeks looks a whole lot like the rollover from April. The index bumped into the same technical ceiling (red, dashed), made a doji-shaped bar, and then followed through on the reversal clue that doji provided. [The dojis are highlighted in yellow.]
S&P 500 Weekly Chart, with VIX and Volume
 [8]
[8]
Source: TradeNavigator
The timing of the action makes plenty of sense too.
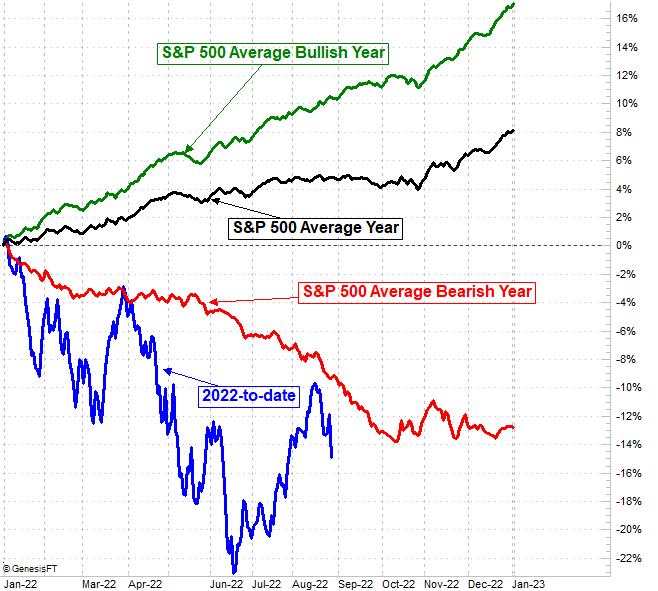
We discussed it a week ago but it bears repeating now – this is a bearish time of year. August is typically tepid, and September is more often than not a loser rather than a winner. As the image below shows us, the current weakness is merely putting the market back on course for its usual bearish year. The good news is, even the average bearish year stops losing ground by early October, and at the very least just moves sideways. There's a chance the bear market will even end in October. The average bear market only lasts about nine months, after all, and the inflation/interest rate rhetoric that's proven so problematic thus far may be about to wind down, with the Fed being increasingly pressured to back off its efforts to curb inflation.
S&P 500 Day-by-Day Cumulative Annual Performance
 [9]
[9]
Source: TradeNavigator
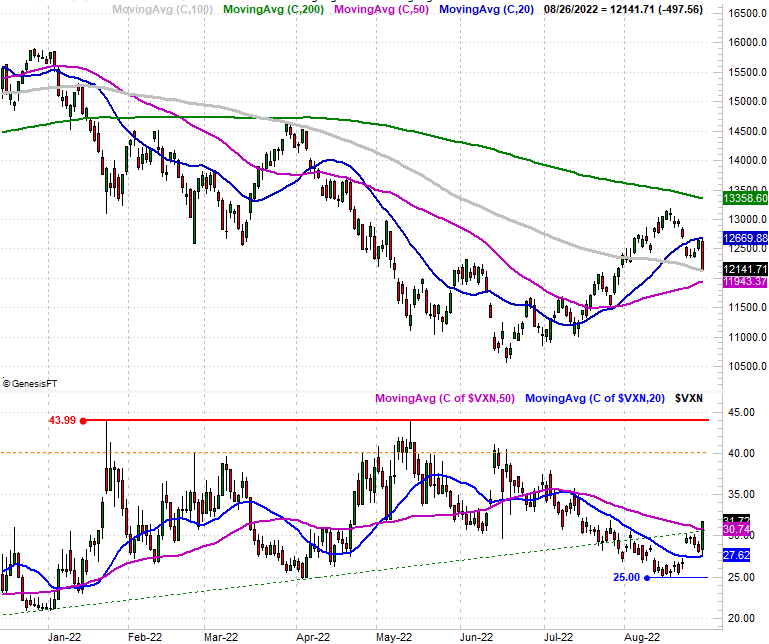
Here's the NASDAQ Composite's daily chart… looks about the same. That is, it struggled at its 20-day moving average line before finally buckling on Friday, when it tumbled to its 100-day moving average line. As was the case with the S&P 500, the sheer speed and depth of Friday's selloff speaks volumes. Ditto for the NASDAQ Volatility Index's surge.
NASDAQ Composite Daily Chart, with VXN
 [10]
[10]
Source: TradeNavigator
There are some people that might argue Fed Chairman Jerome Powell deserves all the credit/blame for the pullback, adding that it's only a temporary, rhetoric-sparked selloff. And, that may well be the case. It's more plausible, however, that traders had already mentally planned on a sizeable correction, and were just waiting for the catalyst to get it going. Powell provided it on Friday. Now that the ball's rolling though, it's going to be difficult to stop. It may need to run its full course, which may well put the bottom somewhere around late-September or early-October.
That's just a theory, of course. Both of the indices are currently squarely trapped between support and resistance… the 20-day and 100-day moving average lines. It could take a couple of days to shrug off the impact of Friday's volatility and then let the market regroup, and then start a more prolonged move outside of its current boundaries.
The onus, however, is on the bulls here.
