
That. Was. Incredible. Stocks were already positioned to close out the week with a win. But, unexpectedly good news on the jobs front — we actually gained some in May — sparked a 2.69% advance from the S&P 500 on Friday. That translates into a 4.9% win for the week. It was the best week for stocks since April, when the market was bouncing back from a rather nasty plunge in response to beginning of the coronavirus outbreak.
That's certainly a victory for stocks, and the move left behind some pretty compelling bullish technical cues. But, the sheer speed and distance of the advance leaves the market vulnerable to some profit-taking. Fortunately, there's enough technical support in place now that a pullback wouldn't necessarily be the end of the world.
We'll take a detailed look below, after a recap of last week's economic news and a preview of this week's.
Economic Data Analysis
Last week started out with a look at the ISM Manufacturing Index. Not great. The lackluster number wasn't a complete surprise. The pros were calling for 44.0, and the 43.1 we got was actually up a bit from April's 41.5. But, it's still below the critical 50 level. Ditto for the ISM Services index that was updated on Wednesday. It read 45.4 for last month, topping expectations for 45.8, and well up from the previous level of 41.8. But, it's still not quite as strong as we'd like to see it. Both did take an encouraging step forward though.
ISM Manufacturing Chart
 [1]
[1]
Source: St Louis Fred/TradeStation
We also heard last month's auto sales last week… from those companies that still report them by month. It takes a while to get or guesstimate the aggregated data, but we did get a final, annualized rate (for the U.S. anyway) by the end of the week. Total auto sales improved to a pace of 12.2 million in May, rebounding from 8.7 million in April. There are buyers ready, willing, and able. It seems unlikely the pace of 17 million seen for the past several years will be reclaimed anytime soon though. Notice truck sales drove most of the rebound, as they've led the way for the past several years.
Automobile Sales Charts
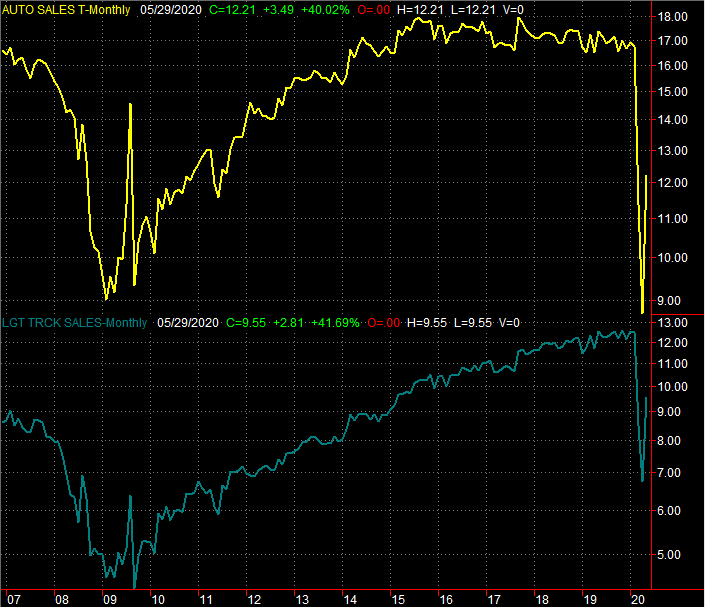 [2]
[2]
Source: St Louis Fred/TradeStation
Last week's biggie, of course, was the jobs report for May. We actually gained some. In fact, the 2.5 million jobs we gained was a record-breaker, suggesting much of the country was more ready for a return to the workplace than presumed. The unemployment rate is still sky-high at 13.3%, but that's lower than April's 14.7% and nowhere near the 19.9% that economists had modeled for last month.
Unemployment Rate and Job Growth Charts
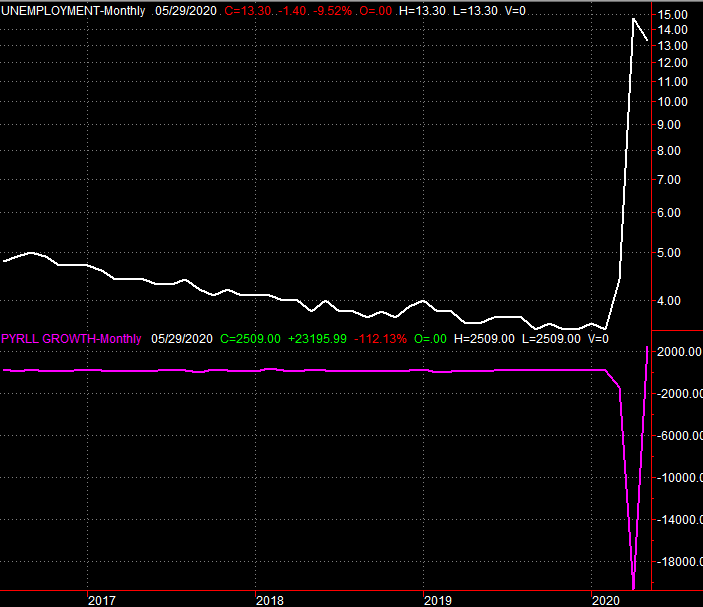 [3]
[3]
Source: St Louis Fred/TradeStation
Of course, the bar was set rather low for jobs numbers.
Everything else is on the grid.
Economic Calendar
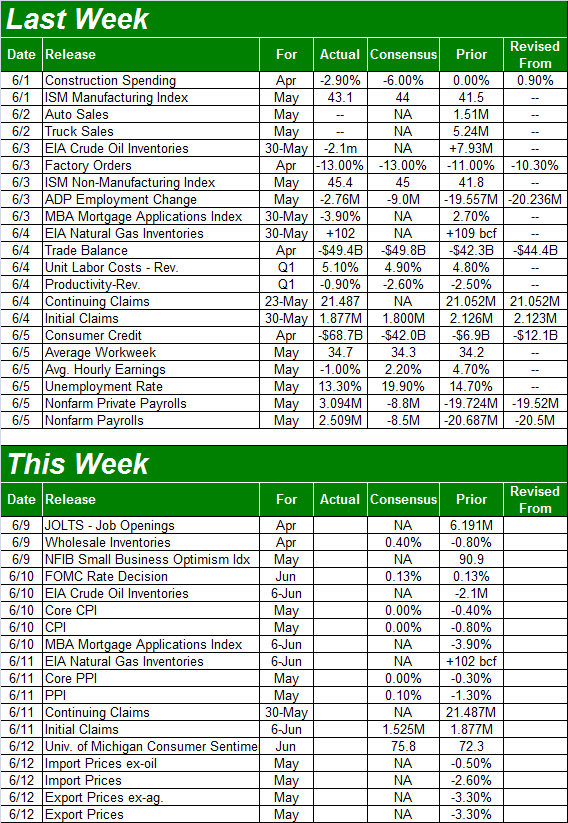 [4]
[4]
Source: Briefing.com
This week is going to be a pivotal one as well, albeit one with less data.
All ears and eyes will be open on Wednesday to hear what the Federal Reserve is thinking. It's a day scheduled to make a change to the nation's interest rates, if merited. But, traders are pricing in a 90% chance the FOMC won't alter their current Fed Funds target rate of between 0.0% and 0.25%.
That being said, the inflation reports due this week certainly might steer the Fed to rate cuts in the foreseeable future. Look for consumer inflation figures on Wednesday, and producer inflation numbers on Thursday. The overall consumer inflation rate (annualized) now stands at 0.3%. Economists are calling for inflation of nil once last month's data is tallied.
Consumer Inflation Rate (Annualized) Charts
 [5]
[5]
Source: BLS/TradeStation
You'll see a difference between the data on the chart above and the data on the table above. The chart is right, and the table's (the grid) wrong. The numbers from the Bureau of Labor Statistics — where all the official data comes from — confirms the annualized overall inflation rate stands at 0.3%. The other is a rate based on the previous month's change. Usually any differences from the provider and the actual, official numbers are so small that they're negligible. But, things are moving so quickly now that the numbers are struggling to catch up with one another.
Stock Market Index Analysis
Last week was the sign a lot of investors have been waiting for. The effort arguably was a bit overzealous and left stocks ripe for some profit-taking. But, the big move has gotten the market over some humps, and within reach of others.
The daily chart of the S&P 500 tells us a great deal. The index had already hurdled the last of its pivotal moving average lines — the 200-day moving average line (white) — as of a week ago. Now it's accelerated that bullish move to put some distance between itself and that long-term moving average line. Also notice there was a flood of volume behind Friday's big gain.
S&P 500 Daily Chart, with VIX and Volume
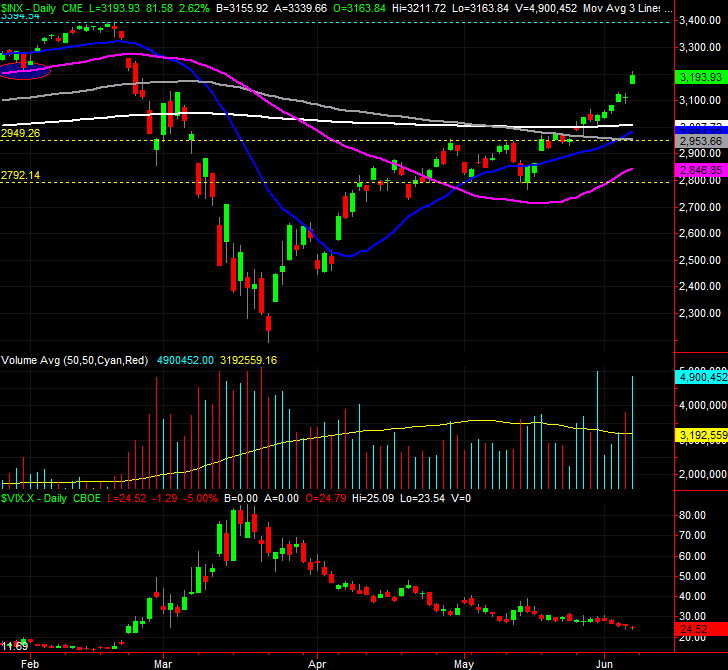 [6]
[6]
Source: TradeStation
It's curious though. While the market was roaring, the VIX barely budged. In fact, the VIX hasn't made a strong, decided move since mid-April even though the rally was rekindled then. It's a hint that traders aren't exactly becoming any more convinced that the advance is sure to last.
It may not be a terrible bet… or at least not a terrible hedge.
Counting Friday's bullish gap as a result of the strong open, the S&P 500 now has three unfilled gaps in the rearview mirror. At least some traders have to be somewhat fearful that someone will start trying to close some of them. Closing all of them would mean a move back to 2524, which is possible because anything is possible. But, it's not likely. A smaller setback is the more plausible outcome. Why? There's a major convergence of moving average lines all around 2995 that can (and probably will) act as technical support.
The NASDAQ Composite's situation is similar, and for that reason there's good reason to fear at least a slight pullback from here.
The specifics? The composite bumped into its February peak thanks to Friday's big gain, but failed to move any higher. Traders may have drawn a mental line in the sand there.
NASDAQ Composite Daily Chart, with VXN
 [7]
[7]
Source: TradeStation
Zooming out to a weekly chart of the NASDAQ puts things in more perspective, and also points to the most likely landing point. That's somewhere around 8600, where the 38.2% Fibonacci retracement line lies, as well as the Composite's 200-day moving average line (white).
NASDAQ Composite Weekly Chart, with Volatility Index
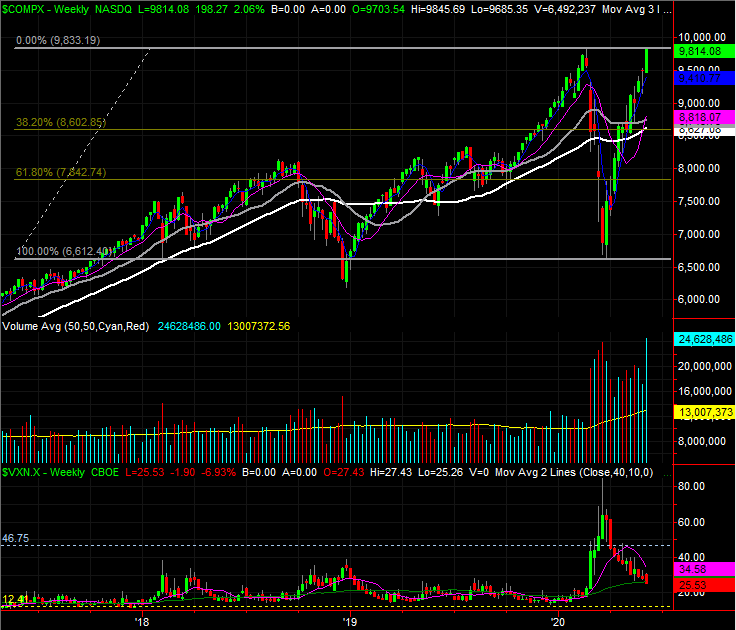 [8]
[8]
Source: TradeStation
It's possible the market could continue to melt up; we're in unprecedented times. But, a small profit-taking setback makes more sense here, and it doesn't necessarily have to mean the beginning of a bear market. A decent correction will do the trick.
Of course, the coronavirus (and now riots and politics) are in the driver's seat. Take any technical cues with at least a small grain of salt.