
Stocks were overbought and ripe for a correction anyway. A lack of a stimulus and a resurgence of COVID-19 gave traders all the reason they needed to get one going. It may not be over yet either.
Or, maybe it is. The last two months of the year are typically good ones, and the government has been rather responsive when it comes to staving off selloffs… even ones that are arguably healthy. Last week's setback won't necessarily lead into the usual dead-cat bounce though. Some serious damage was done, and in the grand scheme of things, last week's plunge hasn't yet sufficiently unwound the froth created by the S&P 500's 63% gain from March's low.
We'll look at why the selling may not be over yet below. First though, let's recap last week's big economic announcements and preview what's in store for this week.
Economic Data Analysis
The real estate sliver of the economy is doing just fine, whether you're measuring by pricing or measuring by actual purchases.
On the purchases front, new home sales actually fell a bit in September, to a pace of 959,000. Use the chart below to keep it perspective though. That's the third lowest reading since 2006, when it was on the way down after the subprime mortgage meltdown. The highest and second-best readings since then were August and July of this year, respectively, and those reading were clearly well up. While not shown on out chart, sales of existing homes reached a clip of 6.54 million in September, up 21% from August's levels. That too is a multi-year high.
New Home Sales Chart
 [1]
[1]
Source: Census Bureau, TradeStation
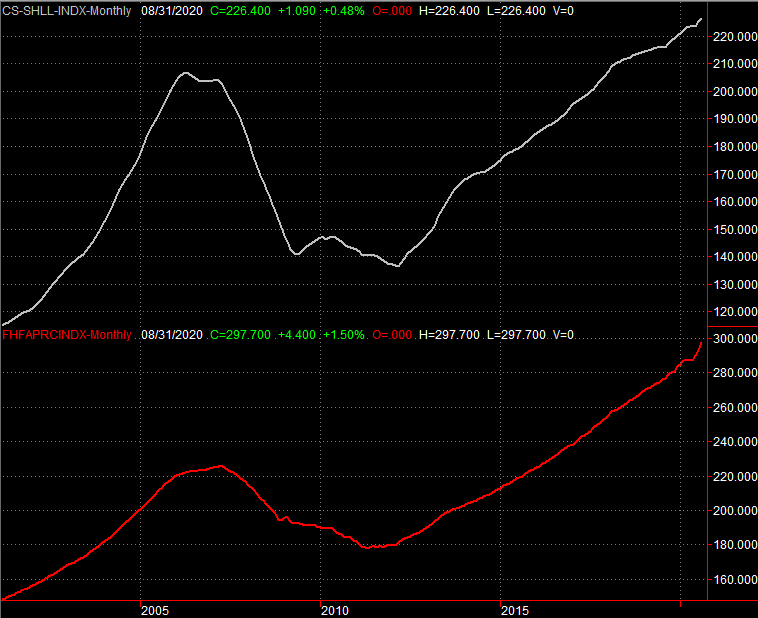
Just as telling is the fact that home-sellers are getting prices they have to like. After a brief lull shortly after the coronavirus pandemic made homes tricky to show and sell, home prices have soared. Both the Case-Shiller Index and the FHFA Housing Price Index reached record levels (for August) in last month's reports. The FHFA reading was up 1.5% from the previous month's value, and the Case-Shiller Index was up 5.2%.
Home Price Index Charts
 [2]
[2]
Source: Standard & Poor's, FHFA, TradeStation
Finally, consumer sentiment is…. Ok, or, about as good as one could expect. Neither the Conference Board now the University of Michigan say confidence is back to pre-COVID levels, but people do feel much better than they did just a few months ago. Perhaps most noteworthy is the fact that despite political turmoil, concern about a lack of stimulus checks, and a resurgence of coronavirus cases, sentiment is holding steady.
Consumer Sentiment Charts
 [3]
[3]
Source: Conference Board, University of Michigan, TradeStation
Everything else is on the grid.
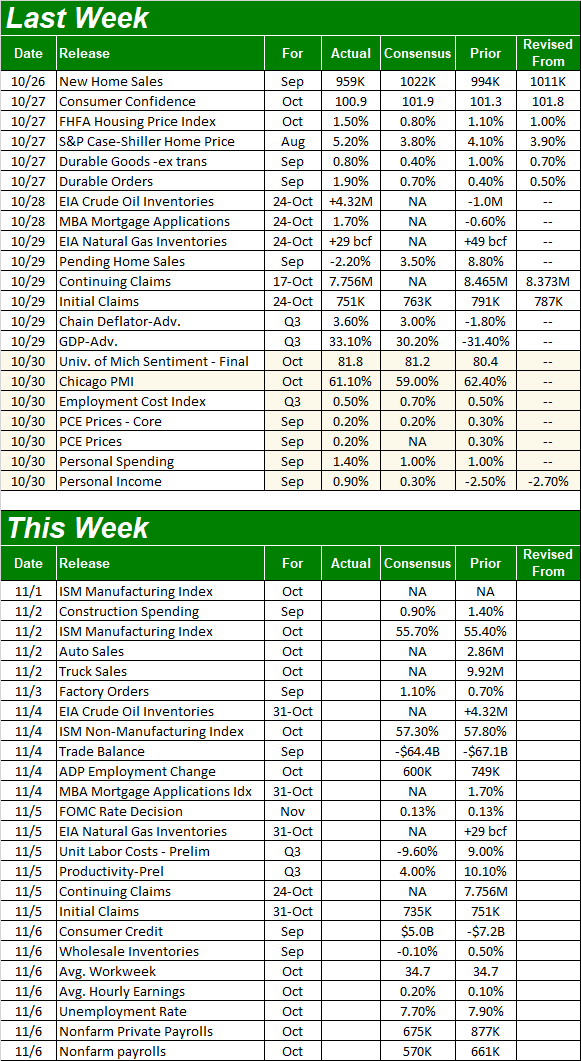
Economic Calendar
 [4]
[4]
Source: Briefing.com
This week is going to be just as busy – if not busier – kicking off with a look at last month's ISM index scores. The manufacturing report will post on Monday, and the services version will come on Wednesday. Both should be more or less in line with September's readings, but more important, both should remain well above the 50 level that delineates growth and contraction.
ISM Manufacturing and Services Index Charts
 [5]
[5]
Source: Institute of Supply Management, TradeStation
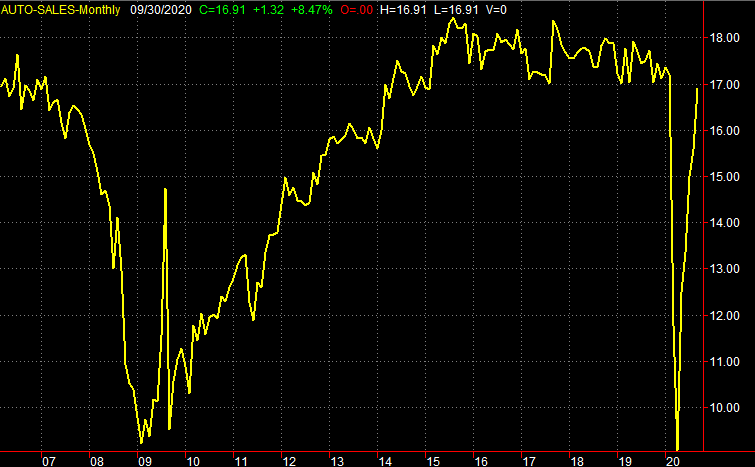
We'll also start to hear about automobile sales this week…at least from the manufacturers that still report them. Like housing sales, car sales hit a headwind in the early days of the pandemic, but have started to recover. In fact, despite the fact that car sales had been unusually strong for so long since 2015's peak, we're actually almost back to the levels we were seeing before the contagion took hold.
Auto Sales Chart
 [6]
[6]
Source: St. Louis Federal Reserve, TradeStation
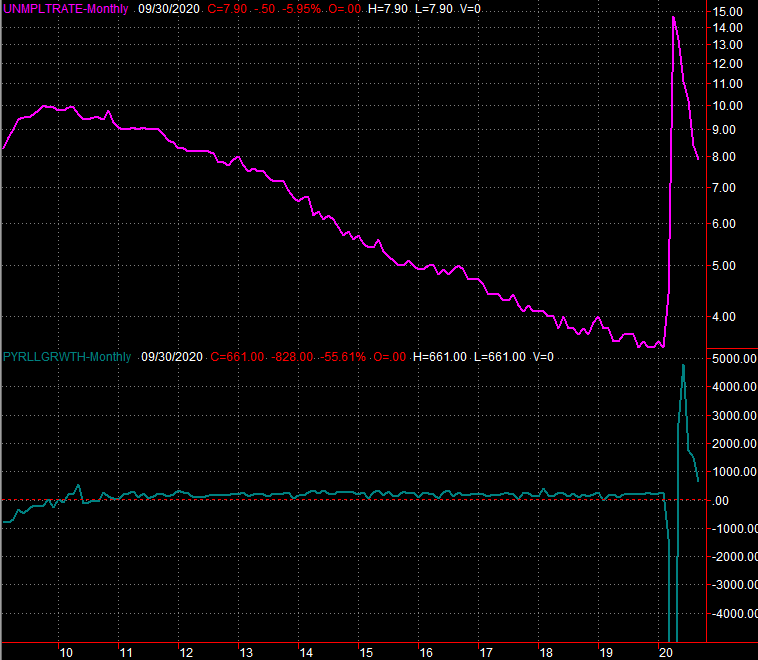
We're also going to hear from the Federal Reserve about interest rates, though don't expect any change from the Fed's current target of 0.13% for the Fed Funds Rate. The FOMC knows ultra-low interest rates can be risky, but the bigger risk right now is not doing anything and everything possible to keep the economy moving. Rather, the big Kahuna this week is a look at October's jobs numbers. Recent progress has been slowing, and economists are calling for even slower progress…. the unemployment rate should slide from 7.9% to 7.7% thanks to 675,000 new jobs. Just bear in mind last week's new unemployment claims were lower than expected, coming in at the lowest levels since the pandemic started. Analysts may be underestimating our progress.
Unemployment Rate and Payroll Growth Charts
 [7]
[7]
Source: Bureau of Labor Statistics, TradeStation
Stock Market Index Analysis
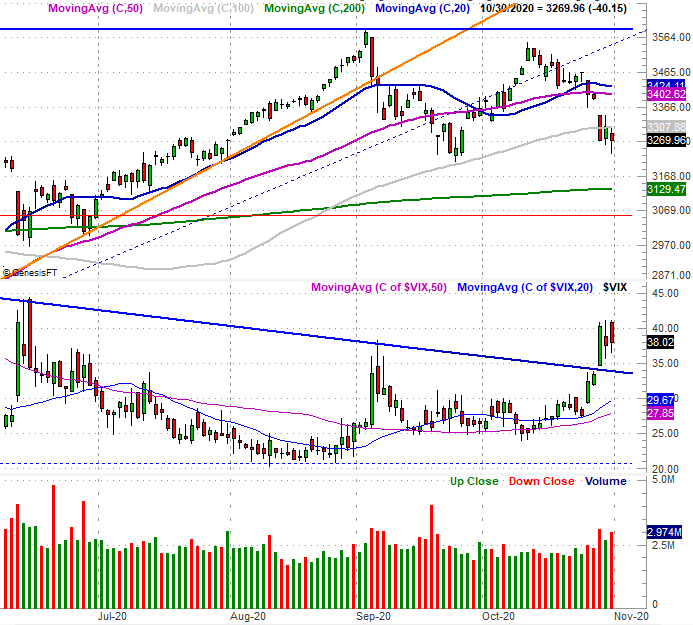
We'll kick off this week's analysis with a look at the weekly chart of the S&P 500, just to provide some perspective. It was clearly — visually – the biggest loss since March. Perhaps more important, the depth of the 5.6% setback broke some key technical floors along the way… namely, the 100-day moving average line (gray) at 3308. You'll also notice above-average volume behind last week's weakness as well.
S&P 500 Weekly Chart, with VIX and Volume
 [8]
[8]
Source: TradeNavigator
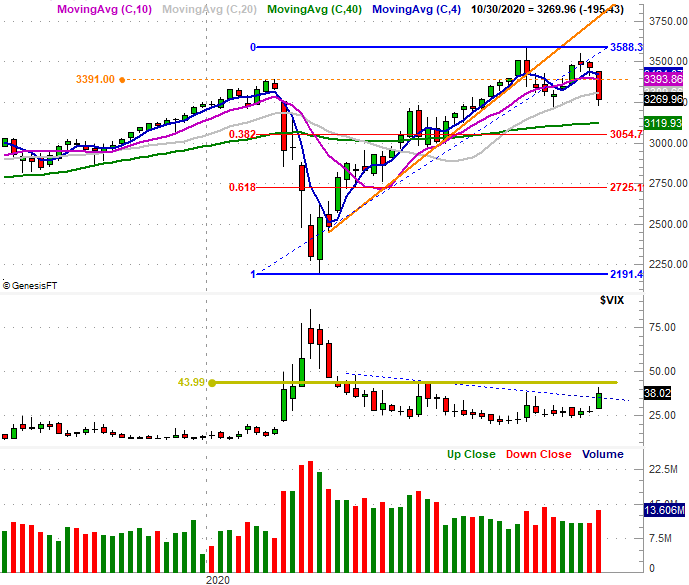
Zooming into the daily chart offers us a little more detail on the matter. In this timeframe we can see Thursday's intraday attempt to crawl back above the 100-day moving average line ultimately failed, as did Friday's. Friday's intraday rally, in fact, wasn't even able to move above that pivotal line. Arguably most concerning about last week's daily sessions is the clarity it offers about the volume trend… the two biggest selloffs were also the two highest-volume days.
S&P 500 Daily Chart, with VIX and Volume
 [9]
[9]
Source: TradeNavigator
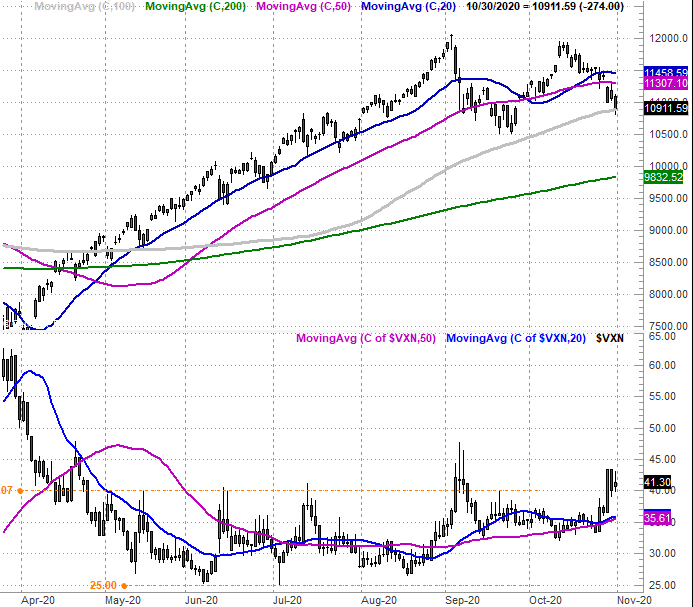
The same concern doesn't quite apply to the NASDAQ Composite… sort of. It didn't break below its 100-day moving average line, but it did test that level (at 10,892) with Friday's low. This is the point where the bulls have to put up or shut up.
NASDAQ Composite Daily Chart, with VXN
 [10]
[10]
Source: TradeNavigator
The daily chart of the NASDAQ shows us something else that was hinted at on the S&P 500's two charts above. That is, sentiment — as measured by the volatility indices — is slowly shifting towards defensiveness and away from the confident offensiveness that prevailed back in the summer. The VXN appears ready to hold the line above 40 now, which has bearish implications. [The S&P 500’s Volatility Index (VIX) has its line in the sand at 44.0, which has yet to be hurdled even though the VIX does look like it’s starting to curl higher.]
This is a tricky scenario. The last quarter of the year is a usually decidedly bullish, with the typical September lull persisting through the middle of October, when things take a turn for the better. This year's September dip was so exaggerated, stocks advanced rather than retreated in the first half of October. That set up the selloff in the latter half of last month. But, last week's drubbing may have spooked enough traders to keep them away for the next couple of months. COVID and a contentious Presidential campaign are exacerbating this risk.
There's also the not-so-small concern of whether or not we've actually been through enough of a selloff to justify a capitulation and a subsequent rebound. We've probably not, all things considered.
There are two clues that lead to this argument. One of them is the Fibonacci retracement lines on the weekly chart of the S&P 500 above. As rough as the past three weeks (in sum) have been, we've still only retraced 23% of the 64% gain between March's low and September's peak. A 38.2% retracement to the 3055 level would be a more complete, capitulatory selloff.
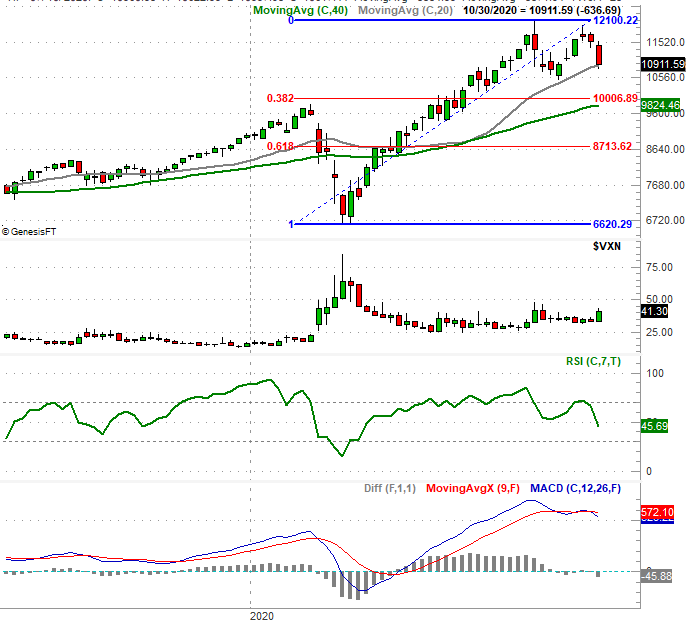
The other clue that suggest we've still not found a bottom? The NASDAQ hasn't reached its 38.2% retracement line at 10,007 either. You'll also see the weekly NASDAQ Composite chart's RSI indicator isn't yet into oversold territory, yet we do have a new MACD crossunder — bearish — thanks to last week's stumble.
NASDAQ Composite Weekly Chart, with VXN, RSI, and MACD
 [11]
[11]
Source: TradeNavigator
The big question is, does any of this matter? Or, have traders also decided to keep buying regardless of the backdrop, setting up a quick recovery beginning this week. We'd put the odds at 50/50 as things stand right now. We'll be able to make more decisive odds later this week, once we see what's going to happen with the 100-day moving average lines, the volatility indices, and of course, the election. Keep an eye on all of them.