It could have been worse last week, though it could have been better as well. In fact, it should have been better… at least for the bulls. While the indices managed to eke out a small gain and put an end to what was the worst two-week selloff we've seen in months, the indices failed to crawl back above some key lines in the sand with the bullish retest late last week. In fact, all the major indices closed back under a pivotal moving average line, indicating the momentum is (still) more bearish than bullish.
 [1]We'll dissect the good and the bad below, as always. Before we get into that analysis though, let's take a quick peek at last week's and this week's economic news, which is providing an important backdrop for all the recent market volatility.
Economic Data
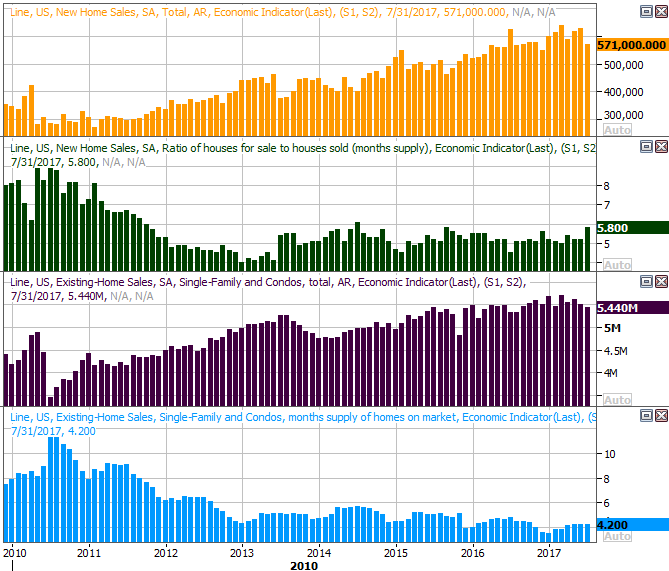
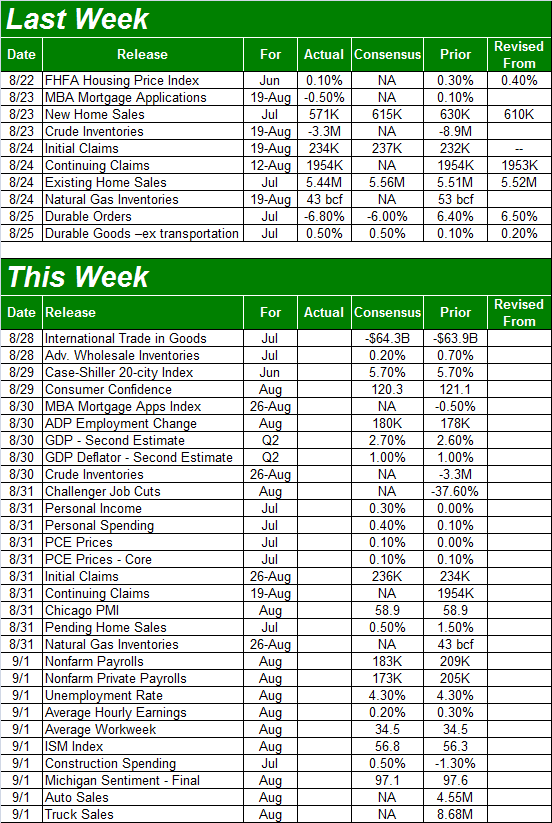
Last week was pretty light in terms of economic news, though it was a pretty big week for real estate data. The party started on Tuesday with June's FHFA Housing Price Index, though the highlight was July's sales of new and existing homes. Both were down, and perhaps worse, both rolled in even lower than expected. Interestingly — and this is the really alarming part — new home sales dipped despite a clear increase in inventory… one of the potential reasons new-home sales haven't been growing as quickly as they were a couple years ago. Inventory of existing homes didn't surge, though they didn't tumble either.
New and Existing Home Sales Charts
 [2]
[2]
Source: Thomson Reuters Eikon
We explored the matter in much greater detail at the website [3], ultimately concluding that with the continued growth in home prices [more on that below] and still-suppressed inventory levels, the real estate market is closer to the strong side of the continuum than the weak side.
Everything else is on the grid.
Economic Calendar
 [4]
[4]
Source: Briefing.com
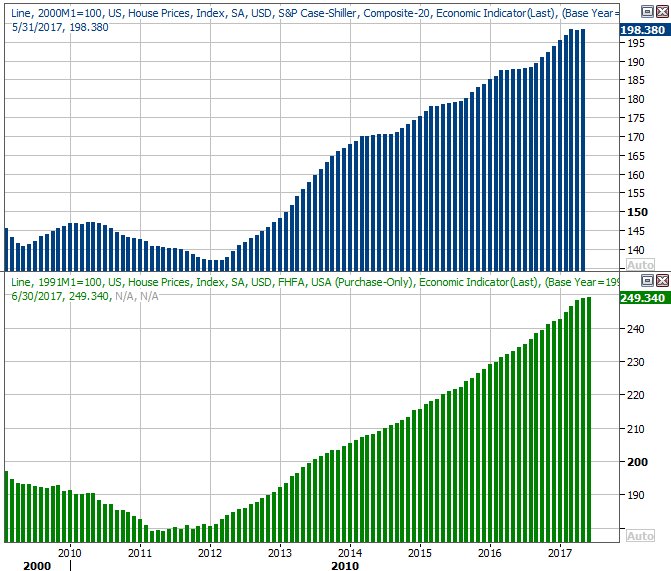
As was noted above, we got June's FHFA Housing Price Index data last week; the measure was up 10%. On Tuesday of this week we'll hear about June's Case-Shiller Index of home prices. Economists are looking for 5.7% year-over-year growth, continuing what's become a very long and very uninterrupted uptrend. A close look at the charts of both suggest that while the bigger-picture undertow is a positive one, it's slowing down. That's a red flag in light of last month's home sales lull.
Home Price Index Charts
 [5]
[5]
Source: Thomson Reuters Eikon
Bear in mind that in both cases, the home price data is for June, and not July, while the home sales numbers are for July.
We'll also get the second (of three) readings on Q2's GDP growth pace this week, on Wednesday. With more time and data to sift through, the pros are upping their initial estimate of 2.6% to growth of 2.7%. Historically, the third and final reading doesn't change much from the second reading. More important, a GDP growth rate of 2.7% is very impressive, and bodes well for earnings growth.
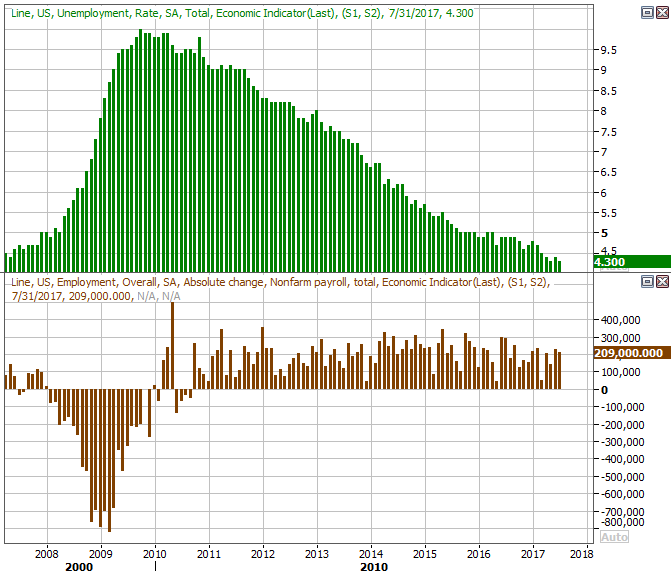
This week's highlight, of course, will be Friday's announcement of July's employment data. June's report was a pleasant surprise, though a tough act to follow. Economists expect the unemployment rate to hold steady at 4.3% on the heels of the addition of 183,000 new jobs.
Unemployment Rate and Job Growth Charts
 [6]
[6]
Source: Thomson Reuters Eikon
It's going to be tough to make net progress from here, as the nation is at full employment already. The growth of the job market from here will be in hours worked and pay rate-growth. Be sure to keep your ears open for those details as well on Friday.
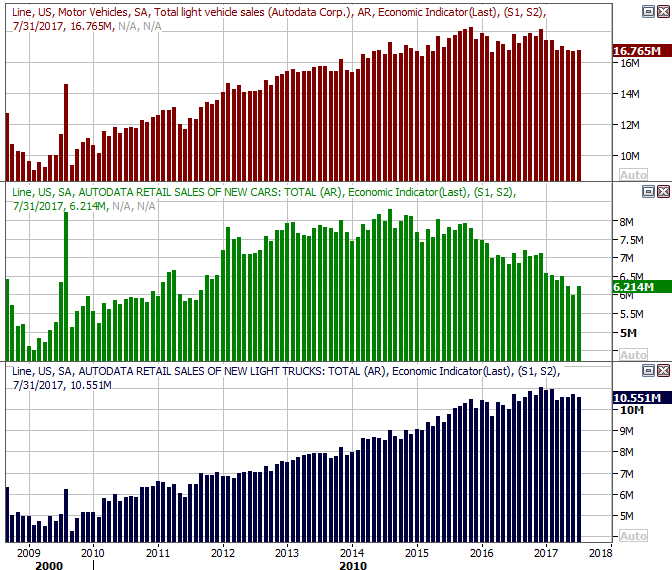
Finally, though most eyes will be peeled for August's jobs report on Friday, that's also the same day we'll get August's auto sales report…. an arena that could definitely use a glimmer of hope. They've been drifting lower for a little over a year now (though that's been tough to tell)., The pros are split on which direction they'll move when the numbers come out on Friday, but nobody's looking for a big change either way.
U.S. Auto Sales Charts
 [7]
[7]
Source: Thomson Reuters Eikon
The release of the results has the potential to rock the auto industry's stocks, as most investors of these companies are on edge.
Index Analysis
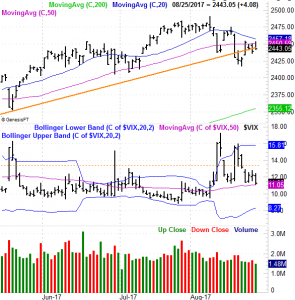
Generally speaking, last week's gain wasn't anything like the recovery the bulls were hoping for. Namely. not only did the S&P 500 not move back above the 20-day moving average line (blue), it almost appeared to be repelled by the key moving average line as it approached it. Just as bad is the fact that not only did the S&P 500 remain under the 50-day moving average line (purple) for the second week in a row, but it also closed under a major straight-line support level (orange) for a second week in a row.
S&P 500 Daily Chart
 [8]
[8]
Source: TradeNavigator
It's not like the shape and action from the chart of the S&P 500 last week has to spell doom — it was just disappointing. That disappointment was at least partially abated by the fact that volume was so light last week… it wasn't a majority opinion.
The vexing aspect of the S&P 500's daily chart — it's falling, which is bullish for stocks. Problem is, it could be back to a "too low" level all too soon, rekindling bearish pressure on the market.
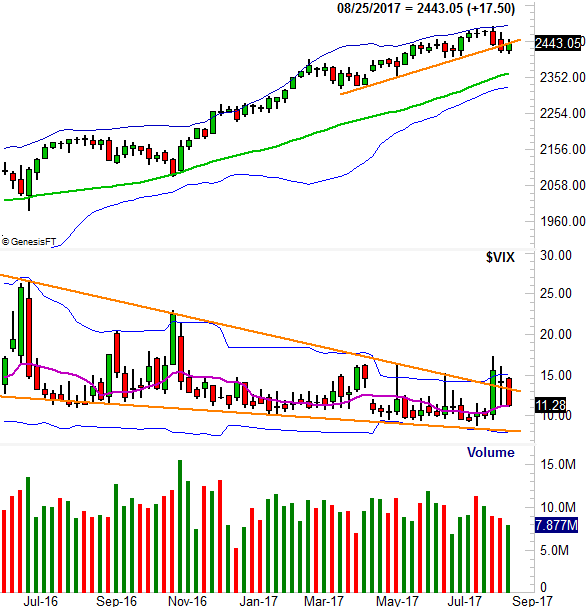
Zooming out to a weekly chart of the S&P 500 helps put this idea in perspective. Here we can see the VIX is back within the confines of a falling converging wedge, though there's not a lot of room left within that triangle shape for the VIX to maneuver. It's also on this chart we can see just how long (too long) the S&P 500 has gone without a major correction.
S&P 500 Weekly Chart
 [9]
[9]
Source: TradeNavigator
The NASDAQ Composite and the VXN are in a similar situation.
NASDAQ Composite Weekly Chart
 [10]
[10]
Source: TradeNavigator
In simplest terms, things could still go either way, though the pressure is on the bulls more than the bears here… pressure to pull the market back from the brink of a bigger selloff.
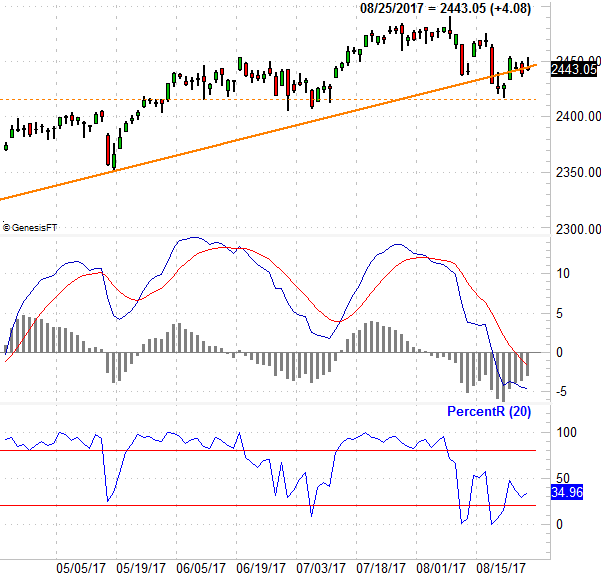
To paint the picture of what will confirm stocks have moved past the point of no return, we'll zoom back into a particular daily chart of the S&P 500, with a PercentR indicator and MACD lines. The MACD lines are already pointed lower and under the zero level. The PercentR line is not under the 20 threshold, but it has been (twice) lately, and is drifting in that direction again.
S&P 500 Daily Chart, with MACD and PercentR Lines
 [11]
[11]
Source: TradeNavigator
The clincher will be the point when the PercentR line tries to move higher again after falling under 20, but fails to do so on the same day the S&P 500 hits a lower low. Right now that "low" is last week's low of 2417. Think of it as a final blow, and the last sign that the bulls can do nothing to stop the selloff that's been brewing for some time.
Until that happens though, there's still a smidgen of bullish hope.