The weakness from two weeks ago could have been chalked up as a fluke, or to a little profit taking after a very respectable rebound from August's low. But, with a second losing week in a row – with last week's 1.0% tumble being bigger than the previous setback – there's cause for concern.
There's not yet cause for panic, to be clear. The market is still finding more support than resistance, and the time of year that tends to be weak for the market is closer to its end than its beginning. Still, there are a couple of clues that suggest stocks need to go through a more substantial correction, particularly given the backdrop. Timing is everything right now.
We'll look at all the gory details below, as always. First though, let's run down last week's economic news and preview this week's announcements.
Economic Data Analysis
The beginning of last week ended September's update of the real estate picture, with a look at the FHFA Housing Price Index and the S&P Case Shiller Index, both for July … before lower interest rates had a chance to kick in. That may be a big part of the reason the price increases have slowed to a crawl. Just bear in mind it wasn't until after July that things started to pick up on the purchase and permits front.
Home Price Index Charts
 [1]
[1]
Source: Thomson Reuters
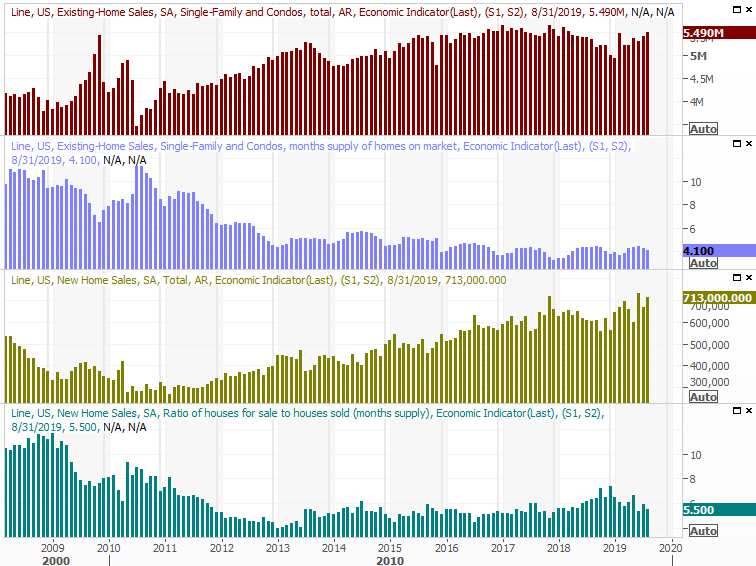
On that note, last month's sales of new homes did indeed perk up, from July's pace of 666,000 to 713,000 in August. That pop confirms an uptrend in buying interest remains in place. Also noteworthy is that existing home sales and inventory continued to move in a healthy direction. It suggests prices could have improved in August.
New, Existing Home Sales Charts
 [2]
[2]
Source: Thomson Reuters
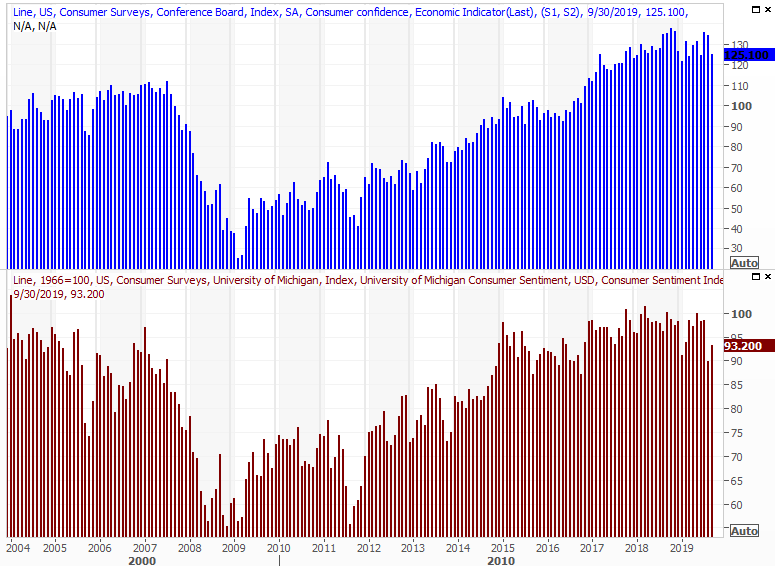
Finally, it was a big week for consumer sentiment. We heard the third and final measure for the Michigan Sentiment Index, and the one and only reading for the Conference Board's consumer confidence score. The Conference Board's reading fell a little, while Michigan's actually advanced a little bit last month. Both, however, have essentially stagnated. It's a clue that consumers are in limbo about what lies ahead.
Consumer Sentiment Charts
 [3]
[3]
Source: Thomson Reuters
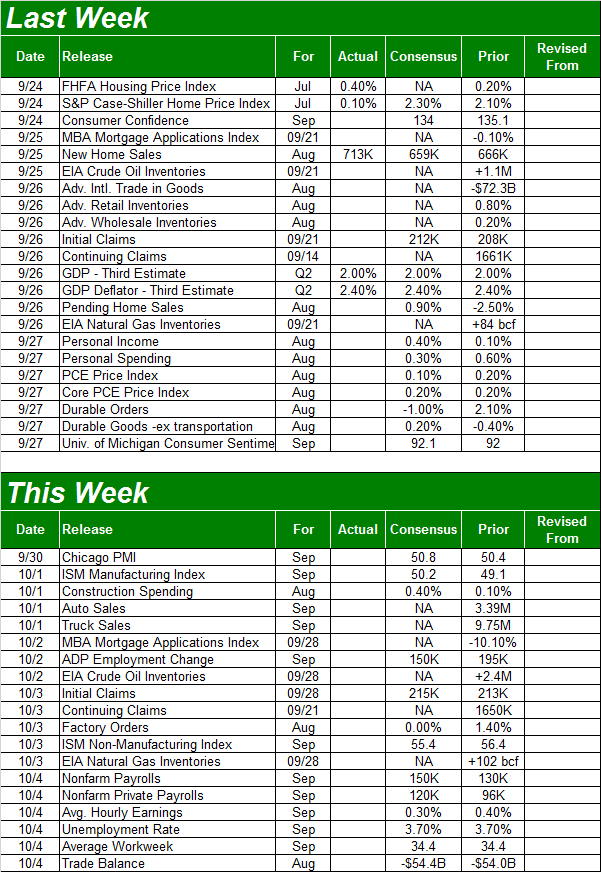
Everything else is on the grid.
Economic Calendar
 [4]
[4]
Source: Briefing.com
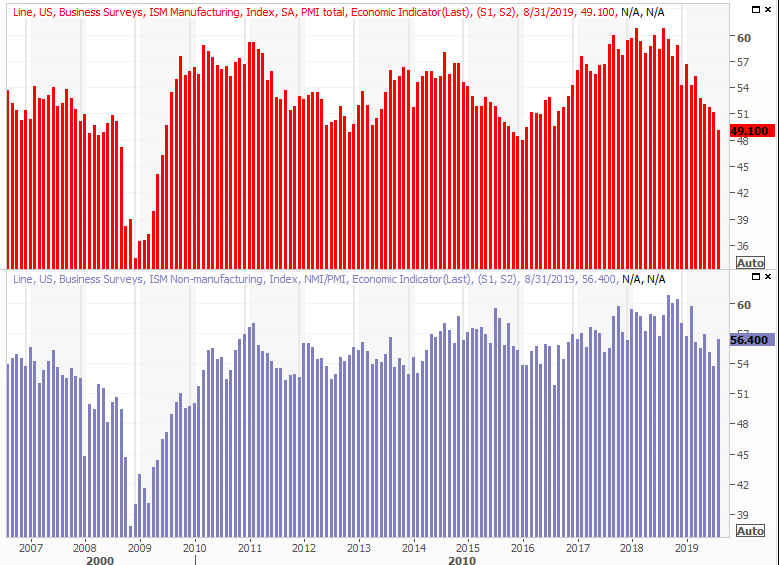
This week is a big one, ending with a look at September's jobs report; the pros are looking for a pretty healthy one again. But, first things first. On Tuesday we'll hear about September's ISM Manufacturing Index, and then on Thursday well get the ISM Services Index score. Economists are effectively looking for a repeat of August's readings. Broadly speaking though, each is drifting lower.
ISM Index Charts
 [5]
[5]
Source: Thomson Reuters
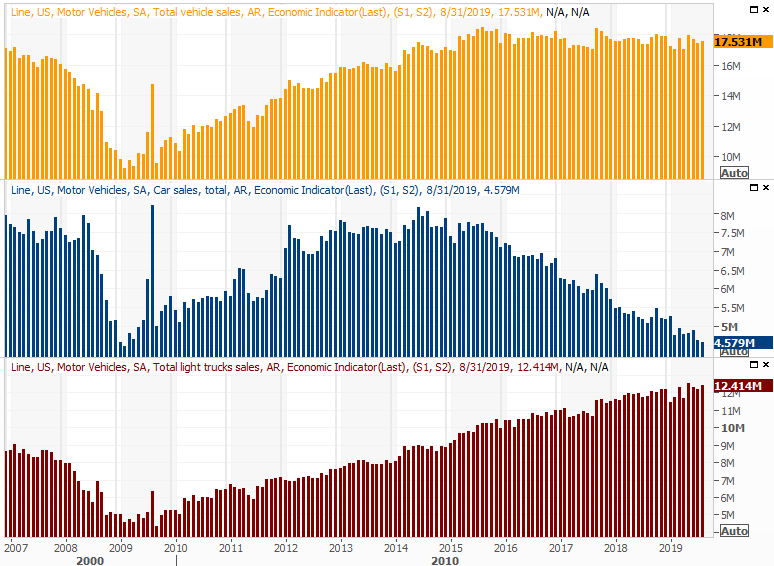
Also on Tuesday look for September's auto sales report. They've been flat since 2016, with continued growth in truck sales offsetting a continued deterioration in passenger sedan sales. Somehow though, the undertow looks and feels like it's trying to edge lower.
Auto Sales Charts
 [6]
[6]
Source: Thomson Reuters
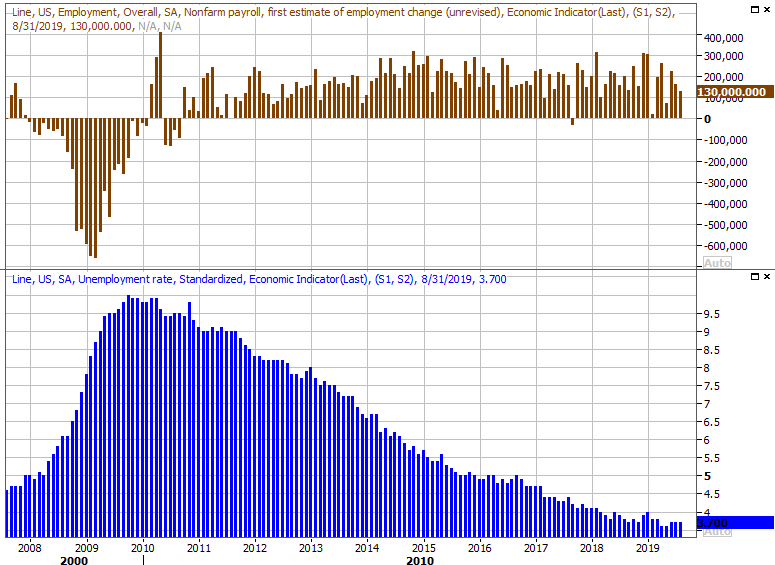
Finally, this week's biggie is Friday's jobs report for last month. Economists believe we added 150,000 new payrolls in September, up from the previous reading of 130,000. That shouldn't be enough to move the needle on the unemployment rate of 3.7%, but that rate may well be at an absolute low.
Unemployment Rate, Payroll Growth Charts
 [7]
[7]
Source: Thomson Reuters
Stock Market Index Analysis
Interestingly, the early September high for the S&P 500 didn't surpass the July high… the first time the index has failed to make a higher high in over a couple of years. It's not yet been followed by a lower low, but that's not to say it can't happen.
The most interesting aspect of last week's action, however, is where the selling finally stopped. The S&P 500 tested the 50-day moving average line (purple) action as a technical floor. But, it didn't break under it.
S&P 500 Daily Chart, with VIX, Volume
 [8]
[8]
Source: TradeStation
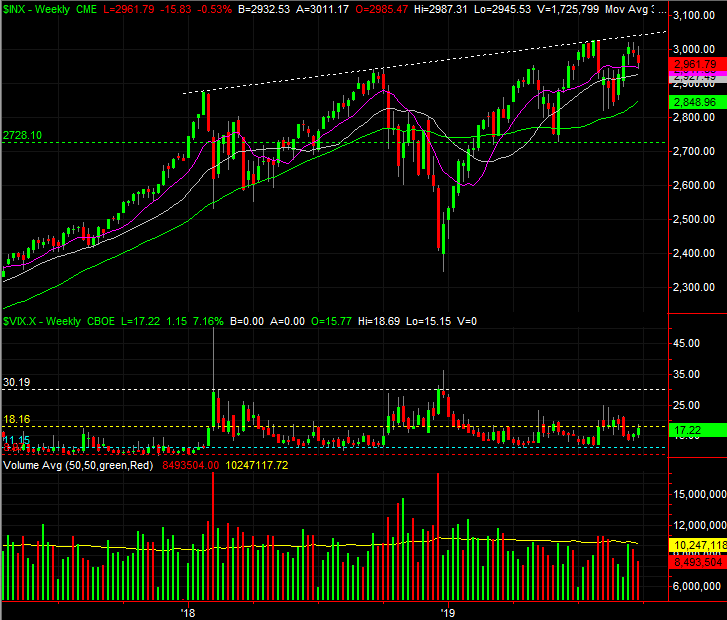
It could still do so. And, there are several indications that it probably will. Among them are the way the VIX is coming up and off of – well, near a – key low around 13.0. Also note that the VIX is struggling a bit to move above a ceiling around 18.00, which has proven itself to be a resistance area before. It's likely that the VIX will hurdle 18.0 and the S&P 500 will fall below its 50-day line right around the same time, if a breakdown is going to take shape.
The weekly chart, as usual, puts things in more perspective.
S&P 500 Weekly Chart, with VIX, Volume
 [9]
[9]
Source: TradeStation
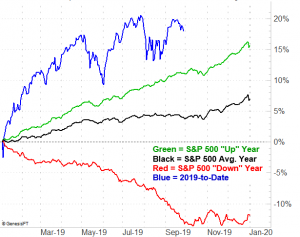
The problem for the bulls is (still) the calendar.
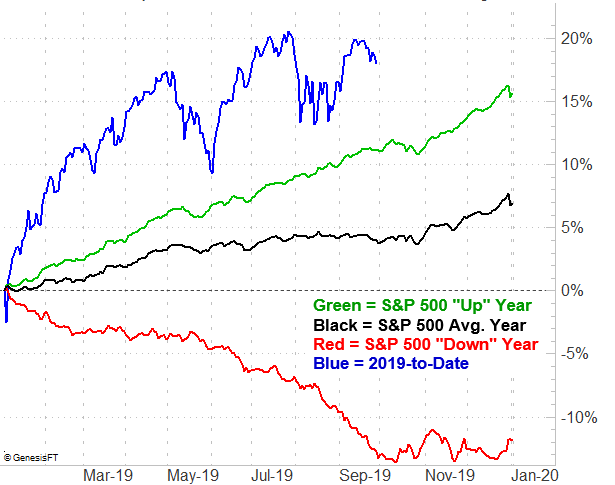
It's an idea we've presented before that merits an update now. That is, we're in the midst of a time of year that isn't especially kind to the market. Yes, September is usually a tough month, but recently, that trouble has tended to extend even through late October. And, we're already overextended more than we should be for this time of year.
S&P 500 YTD Performance vs. Average Performance
 [10]
[10]
Source: TradeNavigator
The picture is even more concerning when looking at this time of year for the third year of a Presidential term… when investors on are edge and uncertain about the future as they start to see the field of candidates take shape.
S&P 500 Presidential Term Performance vs. Average Performance
 [11]
[11]
Source: TradeNavigator
The good news? The fourth year of a Presidential term is usually a good one. The bad news is, when it's not a good fourth year, it's a very, very bad fourth year.
The X-factor is of course the prospective cooling of the trade war with China. It may or may not actually bring any real relief to companies based on either side of the Pacific Ocean, but it will be perceived as a bullish backdrop. That may well be enough to push stocks higher, and out of their current funk.
At the other end of the spectrum, if for some reason the scheduled meeting between Trump and Xi Jinping for October doesn't actually yield any real change, that too could lead investors into a bearish mindset (merited or not).
Just keep an eye on where the S&P 500 is in relation to the 50-day moving average line, and where the VIX is in relation to the 18.0 level.