
Another week, another ugly loss. And yes, this one added to the technical damage done by the selling a couple weeks ago. In some ways the market’s on its last leg, in fact, fighting to hold off weakness that would push stocks over a cliff and force it into making a full-blown correction.
On the other hand, given how overdue the market is for such a setback, it might not be the end of the world. If that’s what’s in the cards, barring any unforeseen development in the meantime we’ll presume it’s a buying opportunity.
Either way, stocks may have set up a bit of a bounce headed into the new trading week. Just don’t be too quick to jump of that’s how things start it.
We’ll flesh out all these details in a moment below. Let’s first run through last week’s top economic reports and the preview what’s slated for this week.
Economic Data Analysis
We didn’t get much economic news last week, but some of what we got was pretty important.
But first things first. On Monday the Institute of Supply Management told us last month’s domestic manufacturing activity slipped a little bit from January’s pace, and on Wednesday we learned last month’s services activity ticked a bit higher. Both are more or less at the same so-so levels they’ve been at for some time now. While both numbers are also above the critical 50 mark, it would be more encouraging if both were at least edging a little higher.
ISM Manufacturing, Services Index Charts
Source: Institute of Supply Management, TradeStation
Last week’s big Kahuna, of course, was Friday’s jobs report. While politicization made the figures sound much better or much worse (depending on) than they were, make no mistake… they were essentially the same. The bigger trends are at least stagnant, but it appears the undertow leans slightly toward economic weakness.
Payroll Growth, Unemployment Rate Charts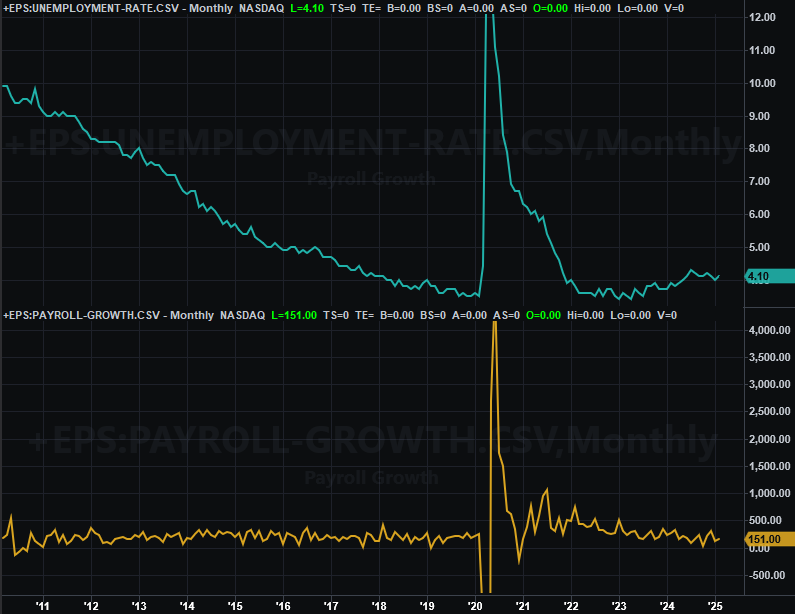
Source: Bureau of Labor Statistics, TradeStation
Just bear in mind the calendar and fresh economic instability — perhaps rooted in actions from the Capital — may have jolted everything. Although net payroll growth was fairly modest, the number of people suddenly out of the labor force (and therefore not being counted as unemployed) jumped by 414,000, but the number of people who wanted full-time jobs but only found part-time work jumped even more by 460,000.
In other words, don’t be too quick to jump to any conclusions here, even though plenty of people already did.
Everything else is on the grid.
Economic Data Report Calendar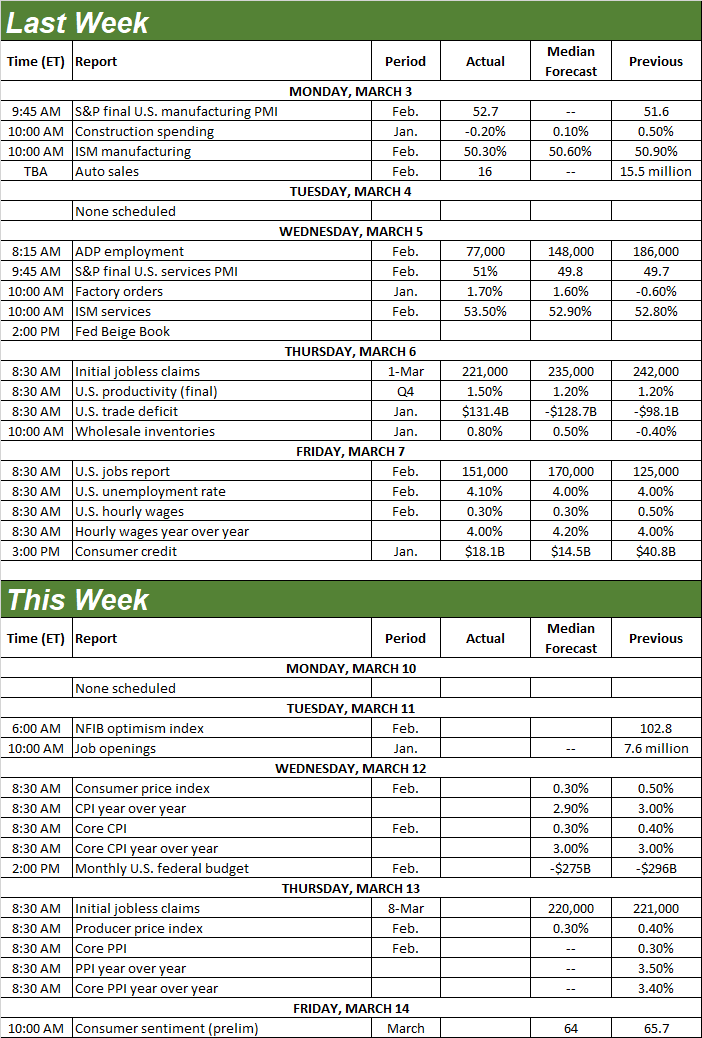
Source: Briefing.com, TradeStation
The only item of interest in the lineup this week is another biggie …. Inflation. Consumer inflation numbers for February will be posted on Wednesday, with producer inflation data due on Thursday. Forecasters are calling for a slight cooling from January’s somewhat lifted levels, which will be a welcome change of the recent pace.
Consumer, Producer Inflation Charts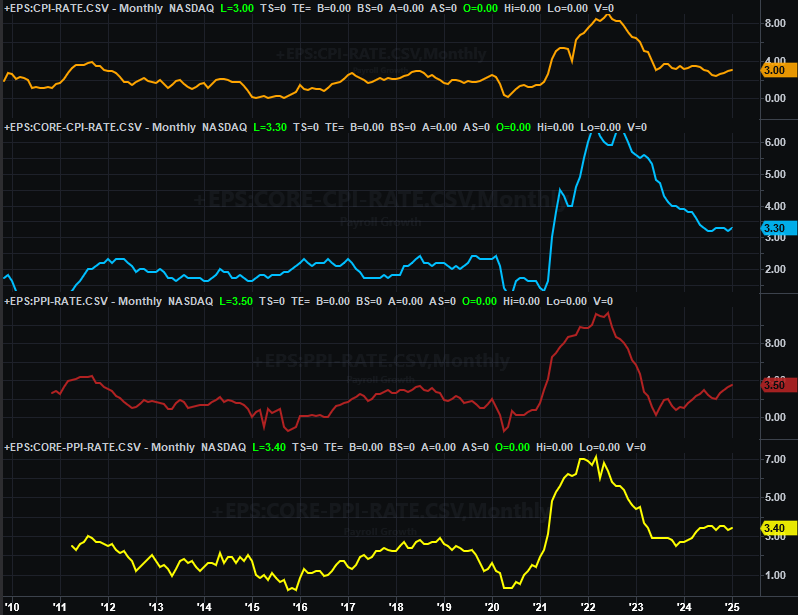
Source: Bureau of Labor Statistics, TradeStation
Even so, overall inflation remains somewhat elevated, and certainly still too high to let the Federal Reserve impose any major rate cuts in the immediate future.
Stock Market Index Analysis
If you think the market moves in completely random, unpredictable ways, last week’s action disproved it. The market actually made that point a week earlier as well, but the premise was cemented in place last week.
How so? Take where the S&P 500 stopped and turned on Friday. The intraday low carried the index well below the pivotal 200-day moving average line (green) at 5,733, but the encounter with that important indicator line turned out to be a bullish catalyst. By the end of the day the bulls had carried the index back above that mark.
S&P 500 Daily Chart, with VIX and Volume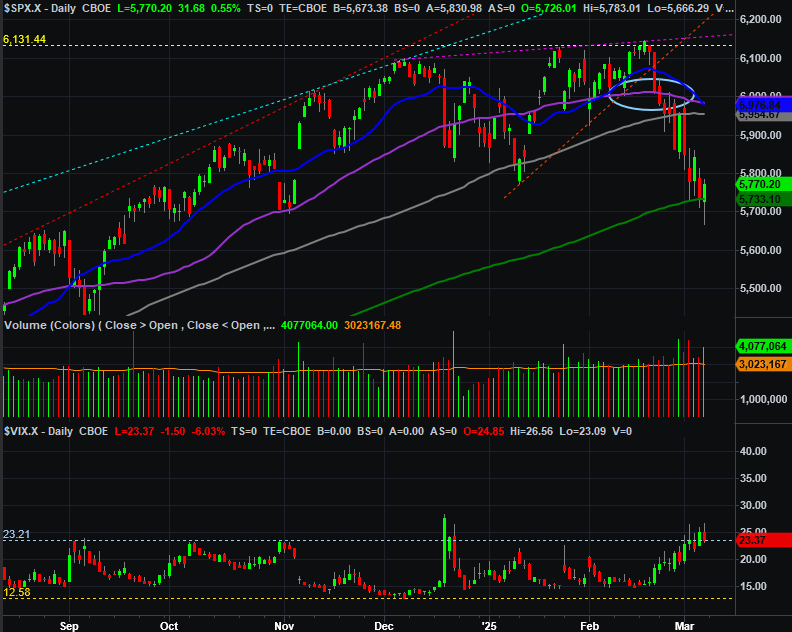
Source: TradeNavigator
Coincidence? Maybe. Let’s take a step back and look at the weekly chart of the S&P 500 though. Here we’ll see that the S&P 500’s volatility index (VIX) at the bottom of the chart also appears to be bumping into a technical of its own around 24. This weekly chart also reminds us that the 7.5% pullback the index has suffered since mid-February may not be the typical 10% correction, but it is in line with all the stumbles the S&P 500 has been through since its late-2023 low.
S&P 500 Weekly Chart, with VIX and MACD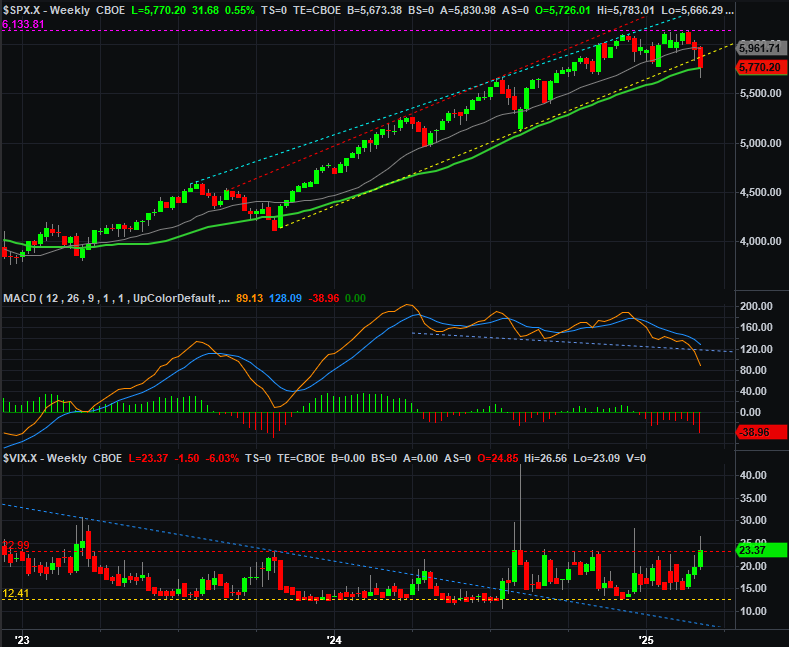
Source: TradeNavigator
Still not convinced this is anything other than random? Just take a look at the weekly chart of the NASDAQ Composite. Although the index moved below and remained under its 200-day moving average line (green) at 18,501, Friday’s low of 17,769 just kisses the rising technical support line that’s been steering the index upward since 2023. This is the most likely place the composite would find support and rekindle its bigger-picture gains.
NASDAQ Composite Weekly Chart, with VIX and MACD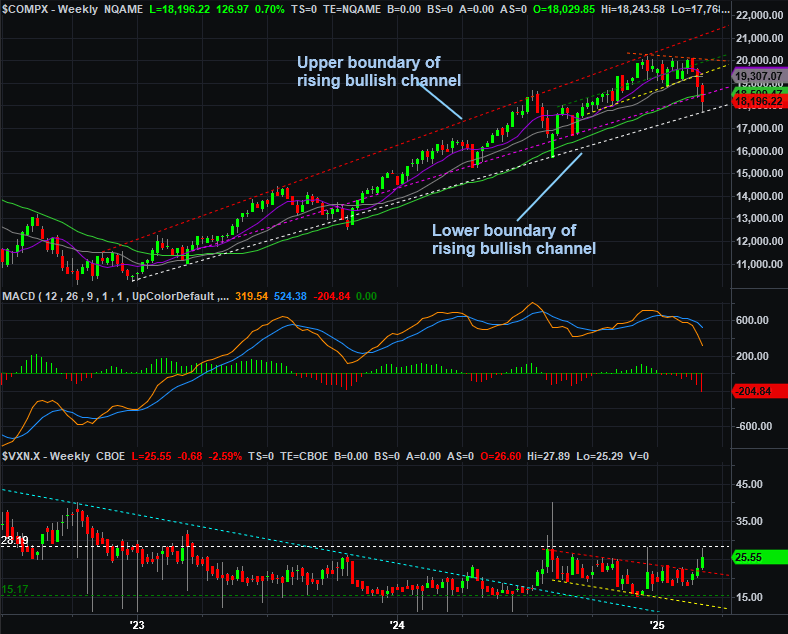
Source: TradeNavigator
This doesn’t inherently and automatically guarantee the market’s intraday rebound effort on Friday marks the beginning of a recovery move. As the daily chart of the NASDAQ Composite below shows us, not only is the index now decisively below its 200-day moving average line (green), the 20-day line (blue) is now below the 50-day moving average line (purple) and 100-day average (gray). This is a sign that momentum has taken a pretty firm turn for the worse (underscoring the fact that the MACD lines on the weekly chart of the NASDAQ are just is decidedly bearish). Even if the bulls are ready to start a reversal effort, they’re going to have to fight a palpable headwind.
NASDAQ Composite Daily Chart, with VXN and Volume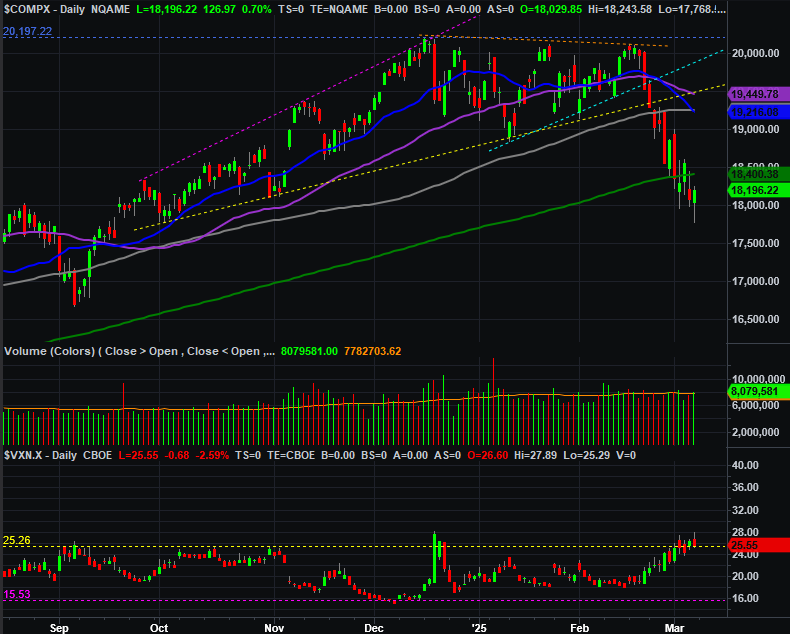
Source: TradeNavigator
So what now? For now do nothing. There are times to be proactive, and there are times to be reactive. This is a time to be reactive, as the market could go either direction from here.
Either way, we’re looking for at least a brief bullish pushback following last week’s rout. It’s just too much selling too fast. As to whether or not it turns into something more will depend on what happens when we start testing 20, 50, and 100-day moving average lines again. For the S&P 500, they’re all converging right around the 5,960 area, so definitely mark that level on your charts.