 [1]It was against the odds, but the market found a way to press on into new, record-high territory. The S&P 500 logged a gain of 1.2%, ending the week at 2939.88. The volume behind the move was thinner than preferred, though surprisingly not as thin as one would expect following a 22% gain since late-December. The market is inarguably overbought here.
The question is, when might that matter? Now or later, the market remains uncomfortably vulnerable to a wave of profit-taking.
We'll explore that risk in detail below, as always, after running down last week's economic reports and previewing this week's big announcements.
Economic Data Analysis
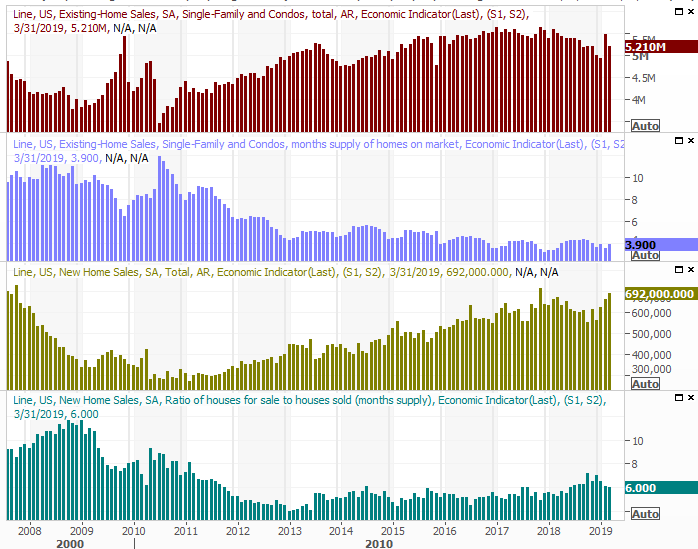
Last week we rounded out the look at real estate that started two weeks ago, with existing home sales being reported on Monday, and new-home sales for March being posted on Wednesday. The former was down, and fell short of expectations, while the latter was up and topped expectations.
Although the existing-home sales pace was a bit of a letdown, it was a letdown compared to a downright heroic February. In the meantime, new-home sales improved for a fourth month in a row. This was and is the much-needed rebound we needed to see for the housing market.
New, Existing Home Sales, Inventory Charts
 [2]
[2]
Source: Thomson Reuters
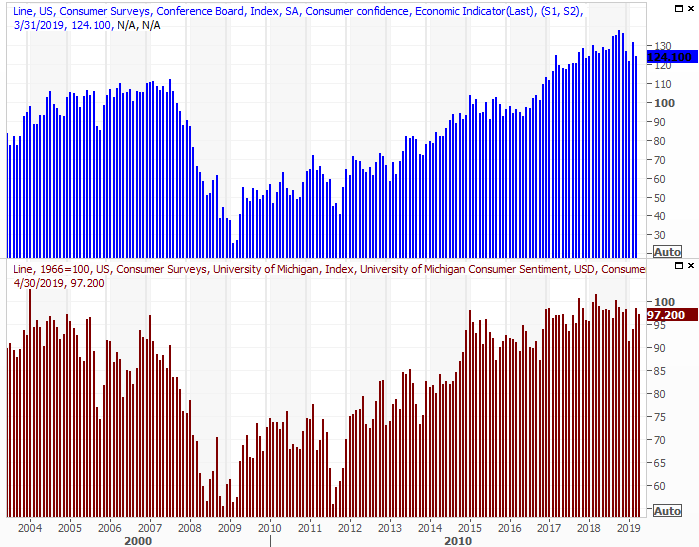
We also got the third and final Michigan Consumer reading for April on Friday of last week. The last score of 97.2 was a tad higher than the second reading, but down a bit from March's score.
Consumer Sentiment Charts
 [3]
[3]
Source: Thomson Reuters
Though we don't yet have April's official sentiment score from the Conference Board, like its Michigan sentiment counterpart, it's in a bit of a funk. It's not 'bad' per se, but the direction of this data can be more important than the raw levels. It's certainly something to watch anyway.
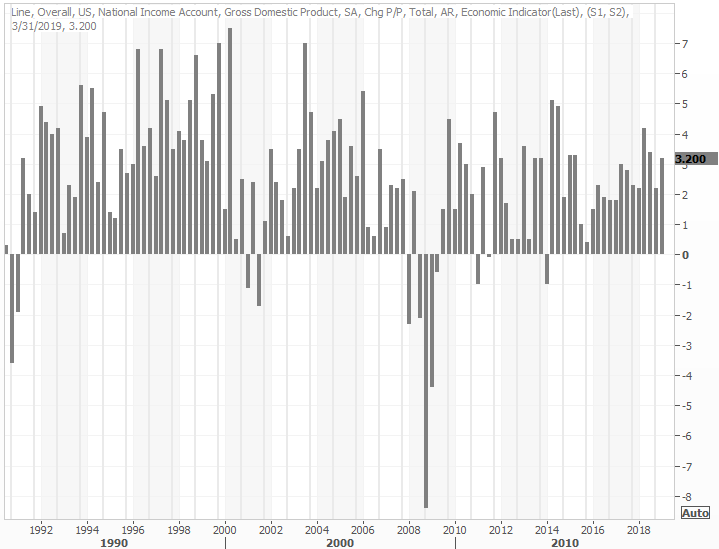
Last week's biggie, of course, was the first (of three) first-quarter GDP growth reports. The pros were calling for progress of around 2.0%. They got an unexpectedly strong improvement of 3.2%.
GDP Growth Charts
 [4]
[4]
Source: Thomson Reuters
It's a slightly misleading figure, in that it was trumped up by a shrinking trade deficit and a surge in corporate purchasing that may or may not last. Nevertheless, the number also suggests economists may be broadly underestimating the economy. They're also well aware of factors like trade deficits and enterprise-level spending well before they have to come up with a forecast.
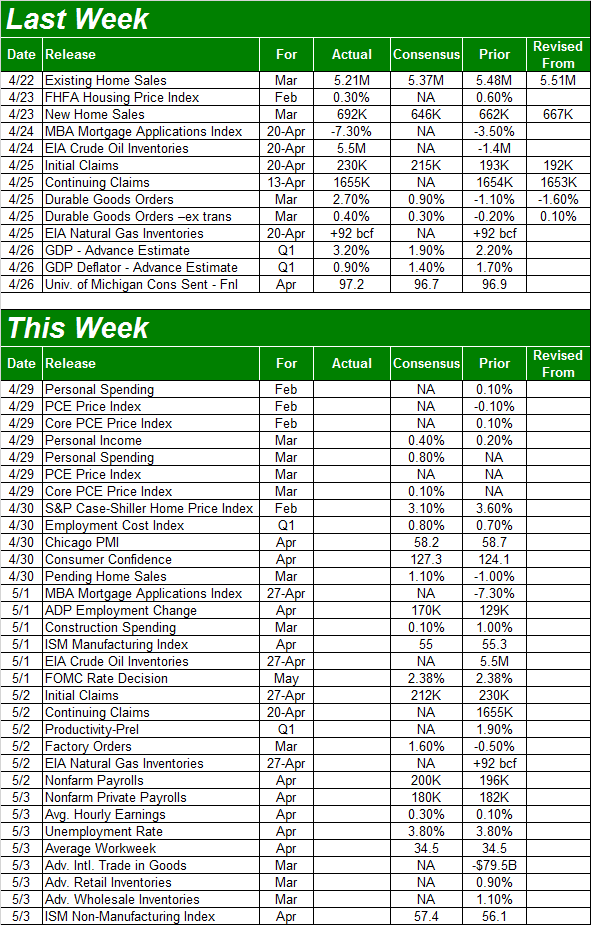
Everything else is on the grid.
Economic Calendar
 [5]
[5]
Source: Briefing.com
This week is going to be an extraordinarily busy one, as we make the transition from April to May, dishing out the data that falls at the very end of the month as well as the beginning of the month.
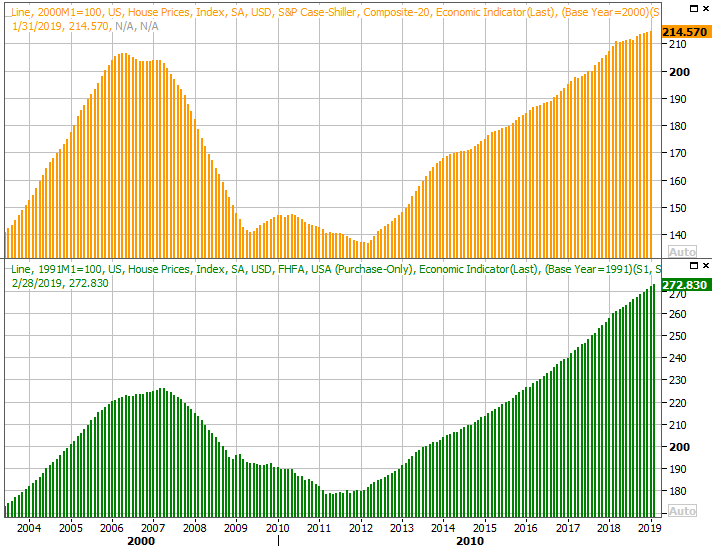
A couple of the earliest major releases are the Conference Board's consumer confidence score for April and the S&P Case-Shiller Home Price Index for February. The former was previewed above with the Michigan Sentiment index, and like its counterpart, economists are calling for a slight contraction. The latter will flesh out last week's report of the FHFA Housing Price Index. As the graphic below illustrates, home prices are still rising, and expected to continue doing so, albeit it as a slower.
S&P Case Shiller, FHFA Home Price Index Charts
 [6]
[6]
Source: Thomson Reuters
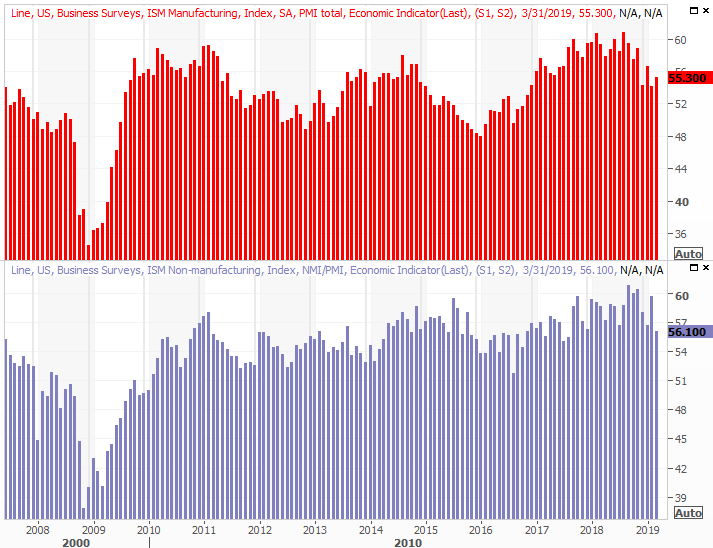
It's also a big week for ISM data, with the manufacturing index figure coming on Wednesday, and the services index slated for Friday. Both are already well above the crucial 50 level, but pros expect readings for April that are just a little higher than March's numbers. It's all good news.
ISM Index Charts
 [7]
[7]
Source: Thomson Reuters
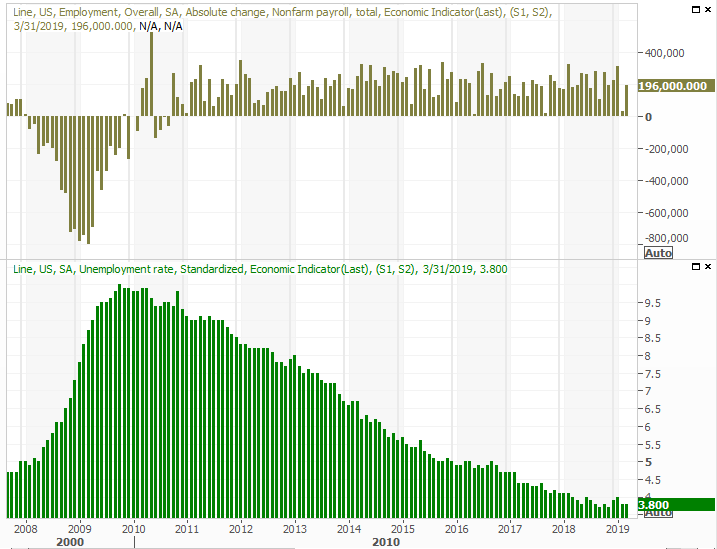
The coming week's big Kahuna, of course, is Friday's jobs report for April.
You'll recall the previous was superficially good, but problematic in a couple of ways. The pros are looking for about the same results this time around. That is, the unemployment rate is expected to remain at an already-low 3.8%, and are expecting 200,000 new jobs to be created. Once again it's the 'other' data – like wages — that will be far more telling about the true health of the labor market.
Payroll Growth, Unemployment Charts
 [8]
[8]
Source: Thomson Reuters
Stock Market Index Analysis
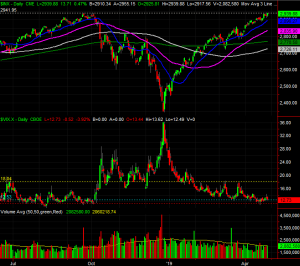
This is it. Though the market has made a couple of record-high closes within the past week, it's not decisively moved to record intraday highs. Indeed, it's suspiciously peaked almost exactly where it peaked in September and October. The pause may only be for psychological reasons, but they're major psychological reasons. The ceiling is plotted in white on the daily chart of the S&P 500 below, right around 2941.
S&P 500 Daily Chart, with Volume
 [9]
[9]
Source: TradeStation
The index is overbought. Of that there can be no doubt. The question is, does it matter? Although the VIX is near what is effectively an absolute floor around 11.0, it was near that floor around the middle of last year, and hovered around 11.0 while the S&P 500 continued to climb through September. But…
… there's another way of gauging how far is too far.
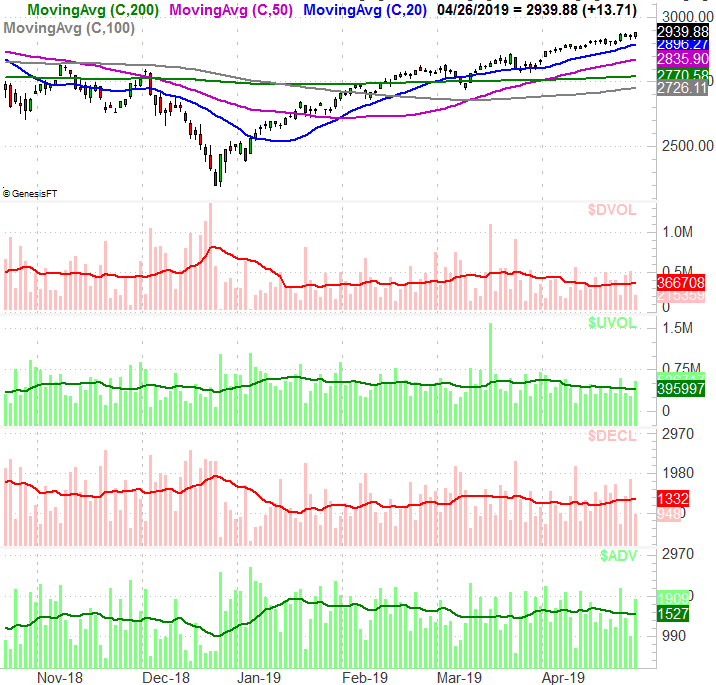
As of Friday's close, the S&P 500 is now 6.1% above its 200-day moving average line, plotted in green. When the index peaked in September, it was 6.5% above the 200-day average. The numbers aren't exactly the same, but the point is – this divergence has reached rarely-seen and rarely-sustained proportions.
That's not necessarily a call for a pullback. It's likely, though not a foregone conclusion. It's the groundwork for another relevant discussion either way, however. That is, if the resistance at 2940 is going to broken, it will almost certainly have to be a meltup that makes it happen (and you'll likely have noticed the meltup rhetoric has picked up steam lately). While that sort of rally can be fun, they're also usually short-lived. In this instance, one 'last hurrah' could set the market up for a huge wave of profit-taking.
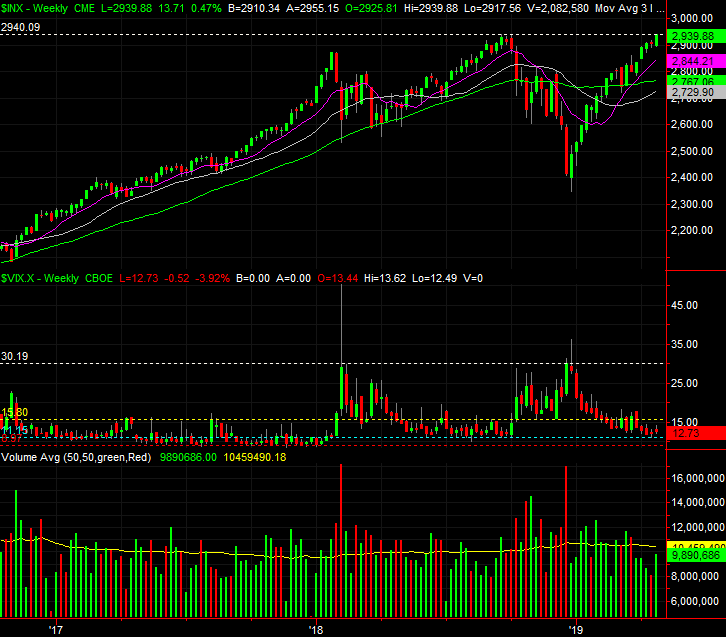
Zooming out to the weekly chart of the S&P 500 puts that idea in perspective. While it had the advantage of starting out after a harrowing Q4 rout, the 25% bounce from the late-December low is one of fastest four-month rallies on record. The market's already overextended. A meltup would push the matter into unprecedented territory.
S&P 500 Weekly Chart, with Volume
 [10]
[10]
Source: TradeStation
Point being, be careful what you ask for.
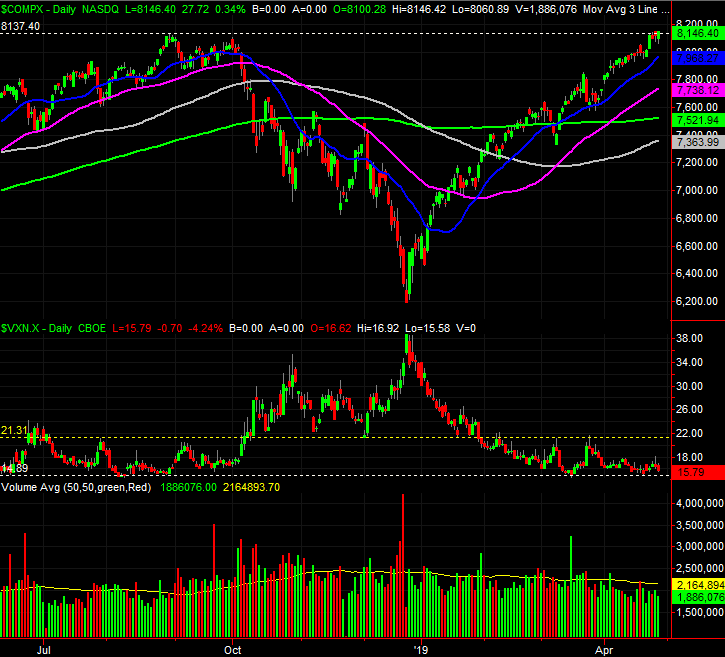
The NASDAQ Composite, by the way, is in the same basic situation. September's peak around 8137 is being tested, but has yet to be crossed. Traders may be wondering which outcome they're supposed to make happen here at this pivotal time. The put/call ratio and Arms Index readings, by the way, are also sending mixed messages, underscoring the idea traders are hesitant to commit to a trade in either direction.
NASDAQ Composite Daily Chart, with Volume
 [11]
[11]
Source: TradeStation
Also to the extent it matters, the S&P 500 is now valued at a trailing P/E of 19.37 and a forward-looking P/E of 17.23. We've seen higher on both fronts, but not much higher for very long. Again, it's making traders confused about what they're supposed to do here.
With all of that being said, know that despite Friday's respectable, robust bullishness, the recent undertow has been anything but bullish. The amount of daily bullish volume has been dwindling since the beginning of the month, and the amount of bearish volume has grown. In fact, though Tuesday and Friday were exceptions – perhaps telling exceptions – the number of daily advancers has dwindles since the middle of the month, and the number of decliners has grown. It's too soon to call a couple of good days a complete change of heart.
S&P 500 Daily Chart, with NYSE Advancers, Decliners, Up and Down Volume
 [12]
[12]
Source: TradeStation
Our outlook is a cautious expectation of a pullback, though it doesn't necessarily have to be a big one. There are several moving average lines immediately below, any of which could stop the bleeding quickly enough. We're still fully conceding, however, the market is in a good position to renew the rally, and traders are of a mindset where they care less about fundamentals and more about headlines. Let's just hope any breakout thrust isn't just the bears' way of giving would-be buyers a headfake, only to unload on them.