
It was a rough week, but at least the market ended it on something of a high(ish) note. The S&P 500 edged 0.22% higher on Friday, following the NASDAQ's 1.43% bounce. While it was still the worst week for stocks since March of 2020 when the pandemic sent investors into a panic, there's now a glimmer of hope that the bleeding has stopped. The thing is, that glimmer isn't just Friday's pop.
Then again, it's also possible that Friday's pop was an inevitable dead-cat bounce following the S&P 500's 12% pullback suffered over the course of the past week and a half.
We'll take a look at the other good reason there's a glimmer of hope here in a moment below. First, let's run through last week's biggest economic announcements — including the Fed's rate hike — and see what's in store for this week.
Economic Data Analysis
There's no sense dancing around the issue. The Federal Reserve's governors are getting antsy about rampant inflation. While the market was largely expecting the 75 basis point increase in the Fed Funds Rate by the time it was announced on Wednesday, there's something about seeing it in black and white. For short while the market celebrated the decision, seeing the glass as half-full rather than half-empty. With a day to think about it though, most people decided the move was more of a red flag than not.
Of course, in light of the numbers that were unveiled earlier in the week, you can't really blame the FOMC for its call. In step with sky-high consumer inflation figures released a week earlier, the Bureau of Labor Statistics announced on Monday that producer (wholesale) inflation soared to the tune of 10.8% in May, remaining near multi-decade highs.
Consumer and Producer Inflation Rate Charts
 [1]
[1]
Source: Bureau of Labor Statistics, TradeStation
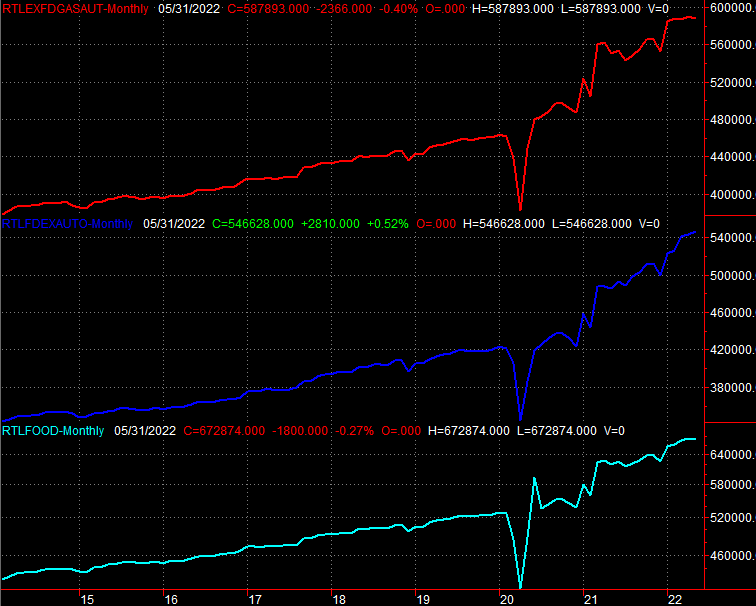
Higher prices may finally be starting to take a toll on consumer spending too. When counting automobile sales, retail sales actually fell last month versus expectations for growth. And, though consumer spending was up when taking cars out of the mix, the pace of growth fell versus April's growth.
Retail Spending Charts
 [2]
[2]
Source: Census Bureau, TradeStation
It's too soon to say this is a sign of impending disaster, but this is something you'd see at the onset of a recession.
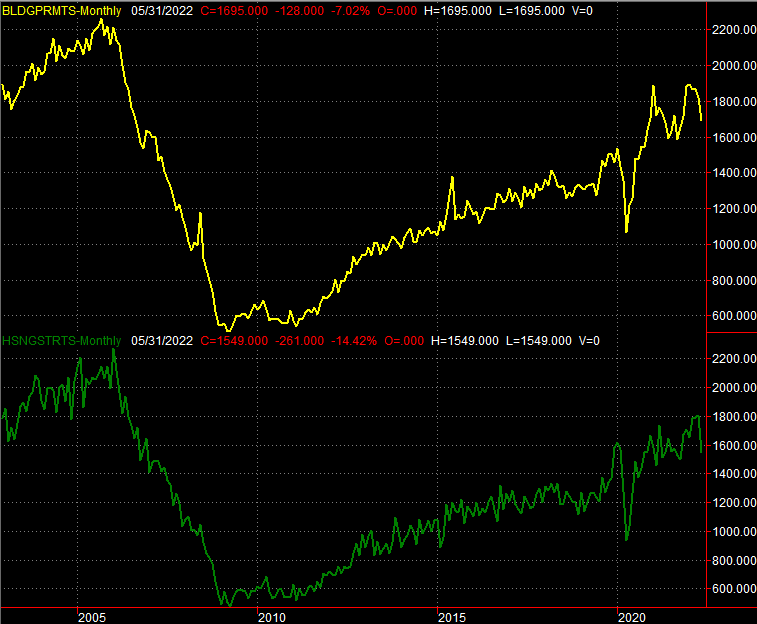
The sharp slowdown in May's housing starts and building permits is something else you'd expect to see at the beginning of an economic headwind. Surprising forecasters, last month's starts fell from 1.82 million to 1.55 million, while permits tumbled from 1.82 million to 1.7 million.
Building Permits and Housing Starts Charts
 [3]
[3]
Source: Census Bureau, TradeStation
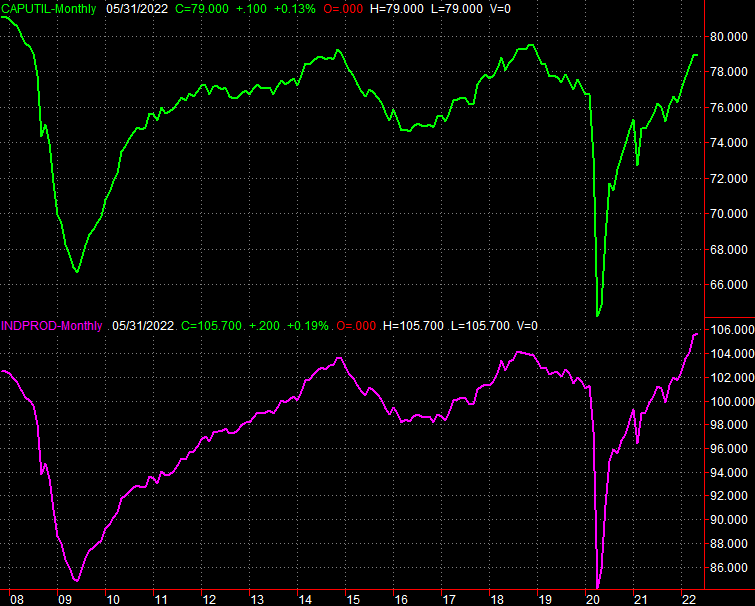
And these still aren't the only places we're starting to see tepidness. The Fed's capacity utilization number for May was more or less in line with April's, potentially ending a healthy growth streak. Meanwhile, actual industrial production was only up 0.2% last month, falling short of expectations, and slowing from the prior month's 1.4% growth.
Capacity Utilization and Industrial Productivity Charts
 [4]
[4]
Source: Federal Reserve, TradeStation
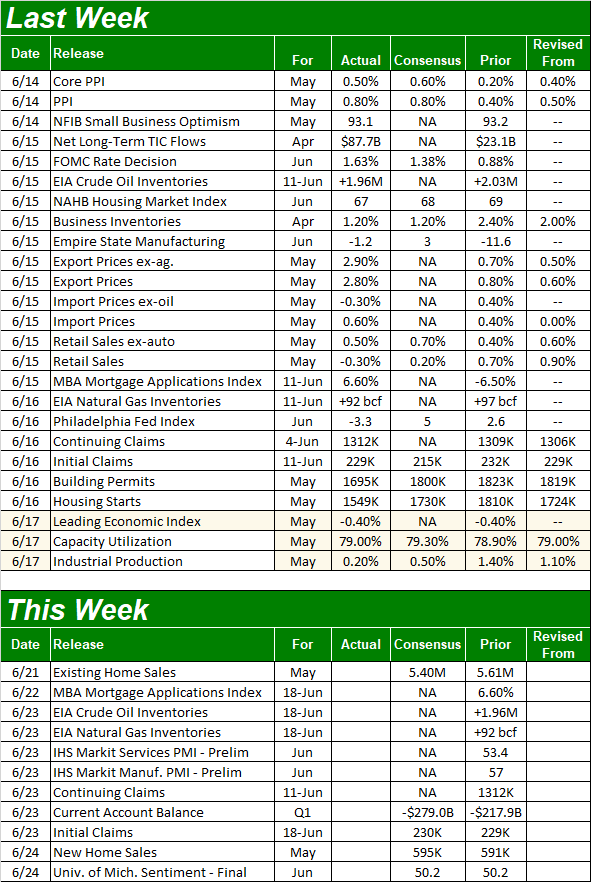
Everything else is on the grid.
Economic Calendar
 [5]
[5]
Source: Briefing.com
This week is a relatively light one in terms of economic reports, but an important one all the same. On Tuesday look for May's existing home sales figures, and on Friday brace for last month's data on new home sales. Forecasters aren't expecting much of a headwind on the sales front, but they weren't anticipating such a slowdown for starts and permits last month either. Either way, disappointing numbers could easily roil the already-vulnerable market.
New, Existing Home Sales Charts
 [6]
[6]
Source: Census Bureau, National Association of Realtors, TradeStation
Stock Market Index Analysis
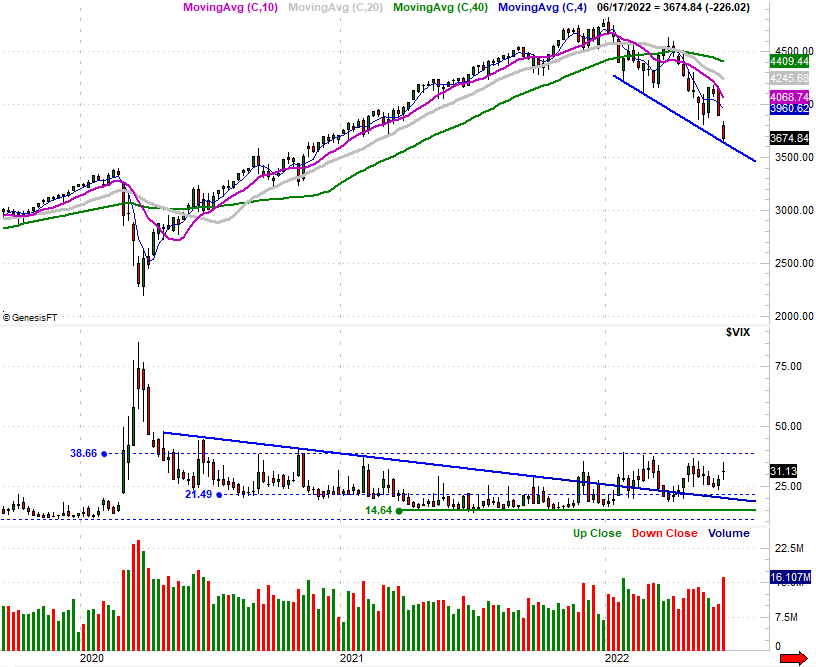
We kick this week's analysis off with a look at the weekly chart of the S&P 500, mostly because we need to establish perspective first before getting to the nitty-gritty details. And, the thing to notice first and foremost on this chart is that last week's low of 3636.87 just touches the falling floor (plotted in blue) that connects all the key lows made since this selloff got started in earnest back in January. This may be a big part of the reason the selling was stopped on Friday after Thursday's drubbing – we're finding good technical support.
S&P 500 Weekly Chart, with VIX and Volume
 [7]
[7]
Source: TradeNavigator
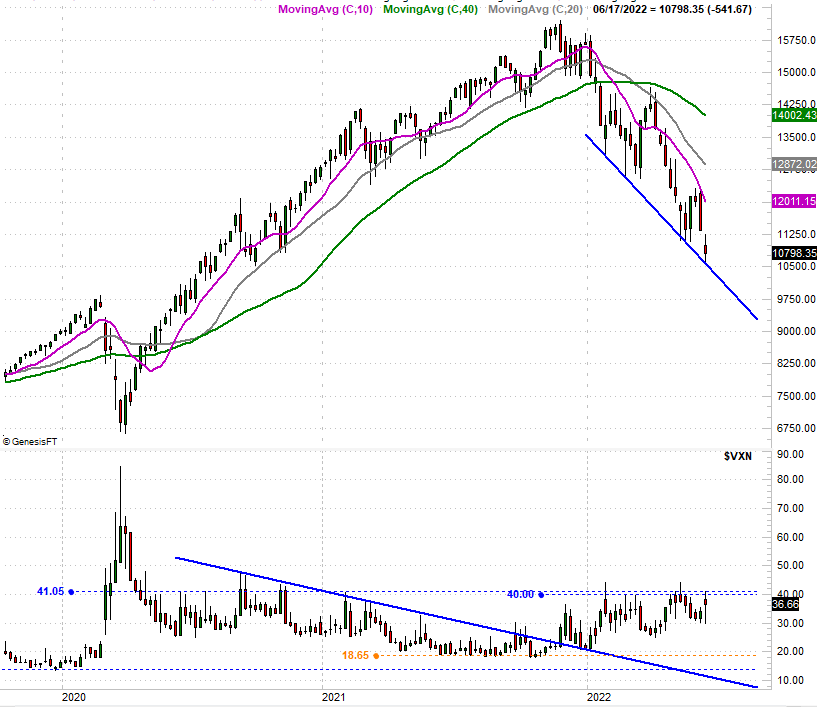
Were it just the S&P 500, the selloff's stoppage might be something just to dismiss. It's not just the S&P 500 though. The NASDAQ Composite did the exact same thing, bumping into a technical floor on Thursday that connects all the lows made since January (also plotted as a blue line on the weekly chart below). The sheer severity of the selloff may not be the only thing working in favor of a bounce effort now.
NASDAQ Composite Weekly Chart, with VXN
 [8]
[8]
Source: TradeNavigator
And yet, these support lines aren't the most interesting aspect of either index's weekly chart.
Take a look at both graphs again, only this time look at the lower portions of the images where the volatility indices are found. The S&P 500's Volatility Index (VIX) is edging higher by virtue of a string of higher lows since January, as is the NASDAQ Composite's Volatility Index (VXN). Neither has pushed above their key technical ceilings at 39 and 40 (respectively), but both of those resistance levels are being tested, or are nearly being tested.
This actually makes a lot of sense. Stocks generally find support right around the same time the volatility indices reach a ceiling, as we're seeing now. The fact that neither the VIX nor the VXN have punched through to move above their technical resistance underscores the likelihood that stocks are truly finding support and not just merely taking a break from the steep selloff.
On the other hand, we're just one more bad day away from seeing the indices break below their technical floors, and correspondingly seeing the volatility indices breaking above their ceilings. If we see either happen in earnest, be worried. If we see both decidedly happen, be afraid. To this end, as much as it feels like we're due for a bounce, don't assume anything here. This is a time of year when bad markets notoriously get even worse.
We discussed this in some detail at the website on Wednesday (https://www.bigtrends.com/stocks/the-good-and-not-so-good-news-about-this-current-rout/) but it bears repeating now: Bear markets tend to dish out their most pain in the summer months.
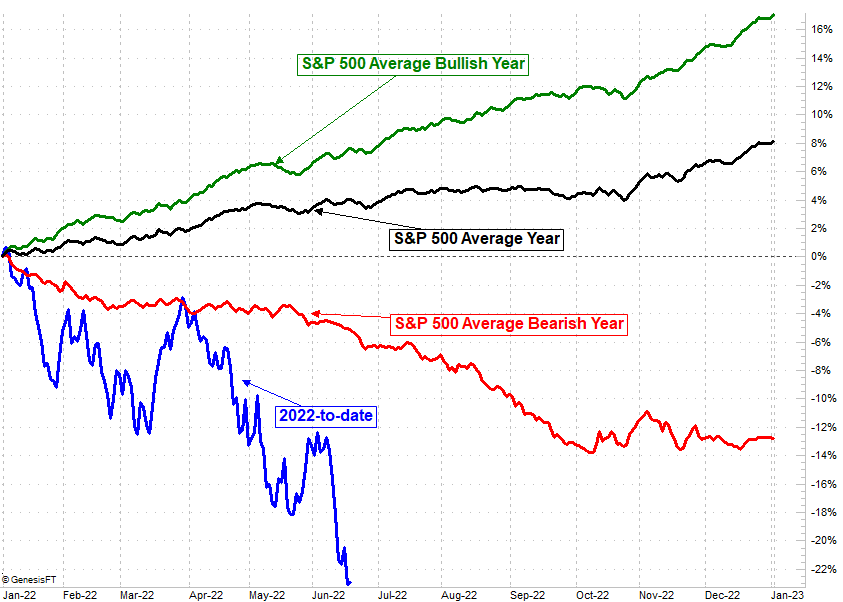
The graphic below puts things in perspective. While stocks are usually moving higher and the long-term average says the market essentially breaks even in the middle third of the year, when it's bad, it's REALLY bad between June and September.
S&P 500 Full-Year Cumulative Performance Comparison Chart
 [9]
[9]
Source: TradeNavigator
Yes, the 2022-to-date performance is so bad that it seems like it could be setting up a rebound despite the norm. Just remember that the market is coming off a year that was unusually bullish. Were it not for the fact that it was dropped from such highs, the S&P 500 wouldn't be as deep in the red as it actually is at this time. That makes the bearish action so typical this time of year in this scenario a little more likely.
In any case, here's the daily chart of the S&P 500. Here we can see three distinct bearish gaps left behind that are now begging to be filled, bolstering the bullish argument. This doesn't necessarily mean they'll be pressured to be filled in right away, however. Either way, at this point the S&P 500 is going to have to move back above its 50-day moving average line (purple, currently at 4117) to truly convince us any rally has real staying power.
S&P 500 Daily Chart, with VIX and Volume
 [10]
[10]
Source: TradeNavigator
Oh, don't get too distracted by Friday's volume surge. Monthly and quarterly options expired that day, causing a rush of trading… trading that wasn't anticipated just a few weeks ago before the market went into a freefall. That's going to spur a lot of activity. It doesn't mean much for us going forward.