
It wasn't a disastrous week, but the bears clearly won it, squelching the previous week's budding rebound effort.
If you think last week's marks a firm, decided beginning of an overdue pullback though, think again. All the key indices remain above critical technical support, and the bears aren't showing any more conviction here than the bulls have shown (or are showing). Everything remains on the fence. And for better or worse, we know exactly where the next make-or-break points are.
We'll look at these things in detail below, as always. First, however, let's look at last week's most important economic reports and preview what's coming this week.
Economic Data Analysis
We heard several important pieces of economic data last week, but none so talked about — and none so misunderstood — as last month's retail sales numbers. We'll start there, just to clear up any confusion.
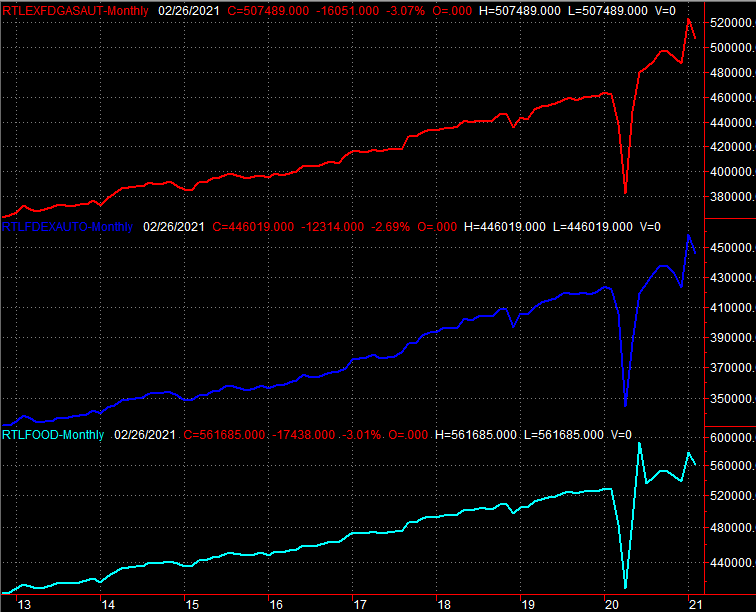
Yes, technically speaking, retail spending fell in February. But, it's important to know what they fell from. The figure is an annualized number, and they didn't fall year over year. Indeed, they were up an incredible 6.3% year over year. They only fell from January's annualized clip, but even then, they're skewed. January's comparison was particularly tough, having soared 9.5%. Also bear in mind that last February, consumers were starting to stock up on basic consumer goods, but also starting to stay home in an effort to avoid a then-alarming COVID-19 pandemic. The important take-away for right now is, the bigger trend is one of growth rather than contraction.
Retail Sales Charts
 [1]
[1]
Source: Census Bureau, TradeStation
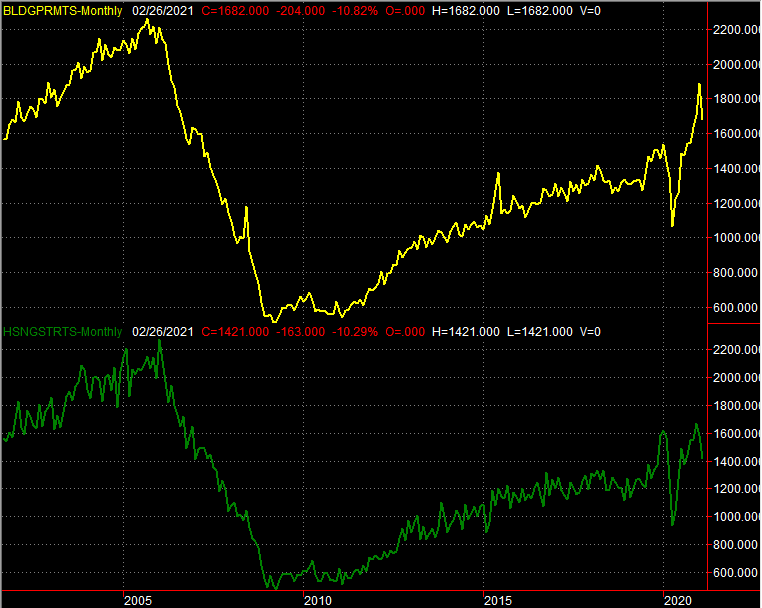
Or, maybe there's more contraction underway that we realize on the surface. While consumer strength (as measured by retail spending) seems strong, the surge on home-buying appears to be cooling. Last month's housing starts and building permits fell from January's levels. They're still solid to be sure, but all big trends start out as small ones.
Housing Starts and Building Permits Charts
 [2]
[2]
Source: Census Bureau, TradeStation
We also can't chalk it up to the impact of higher interest rates. Not only were rates not higher a month ago, the threat of rising interest rates — theoretically anyway — would have prompted a swell of new starts and permits. Maybe we saw that swell in the few last months of last year. The potential demand for new homes is still quite how though. This looks as if the housing boom has peaked.
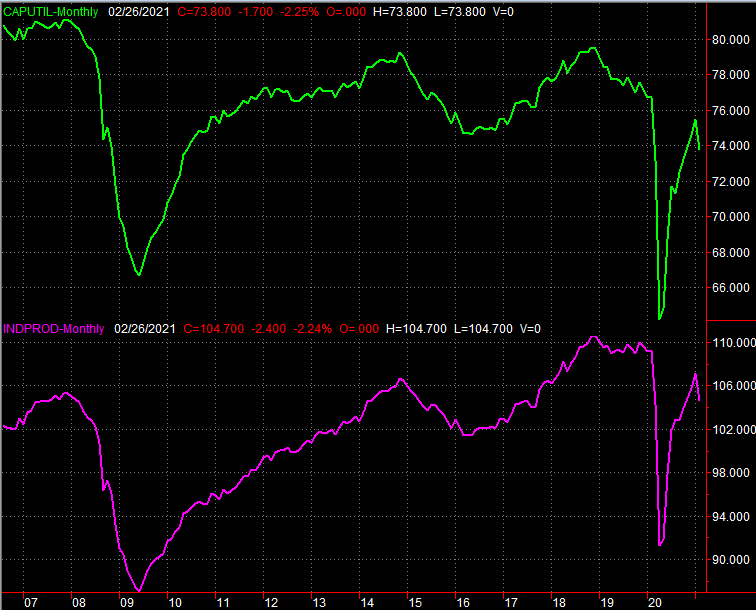
Maybe the manufacturing rebound has peaked too. After several months of progress, capacity utilization and industrial production suffered an unexpected setback in February.
Industrial Production and Capacity Utilization Charts
 [3]
[3]
Source: Federal Reserve, TradeStation
It's possible an uncharacteristic winter storm that shut down a big part of the south is the culprit. Poor weather though — even oddly poor weather — doesn't typically take this sort of toll, as it causes increases in other areas of industrial production. The housing market isn't quite as fragile to weather incidents than last month's struggle would suggest, unless the disruption in Texas is actually being understated.
Whatever the case, we can't take another month of this sort of weakness on the homebuilding and industrial activity fronts.
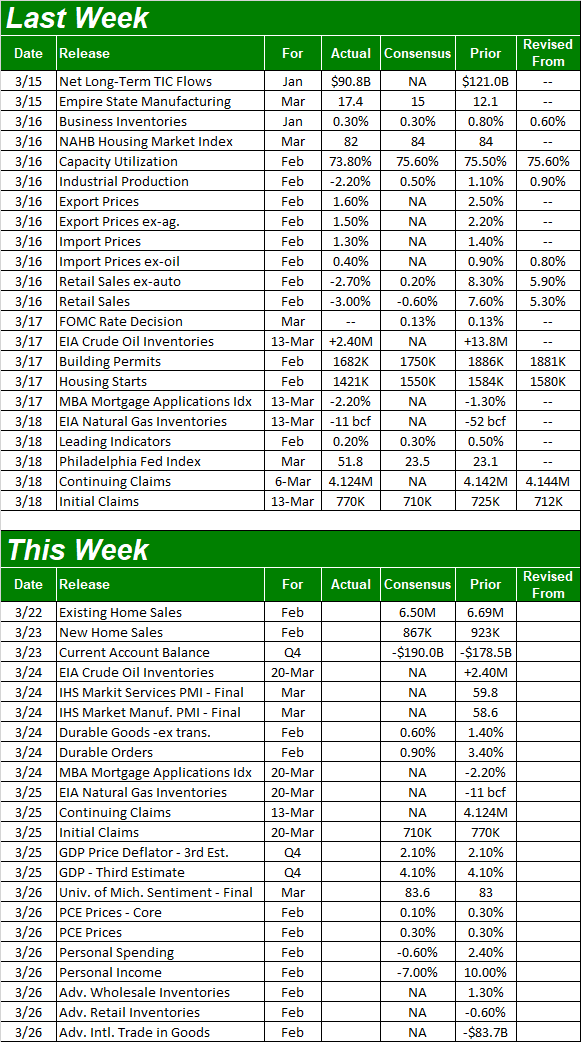
Everything else is on the grid.
Economic Report Calendar
 [4]
[4]
Source: Briefing.com
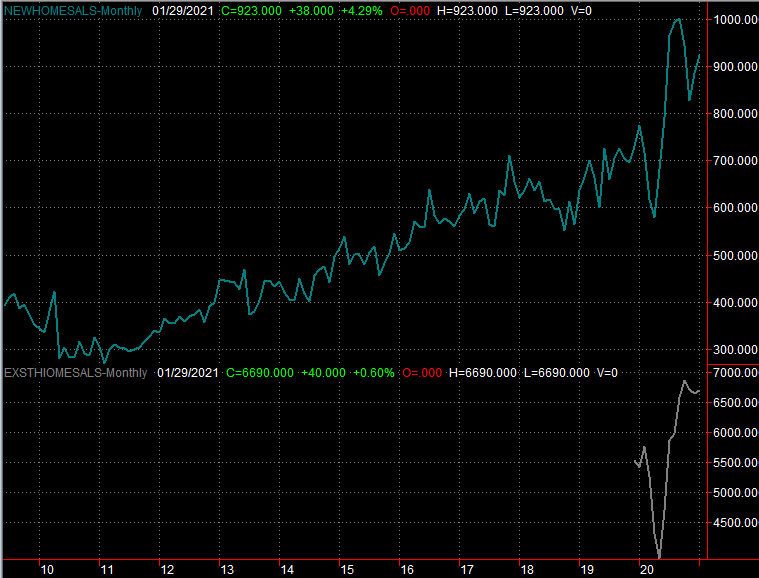
This week we'll round out the real estate picture with a tally of February's home sales…new, and existing. Economists are calling for a slight lull for these measures too.
New, Existing Home Sales Charts
 [5]
[5]
Source: Census Bureau, National Board of Realtors, TradeStation
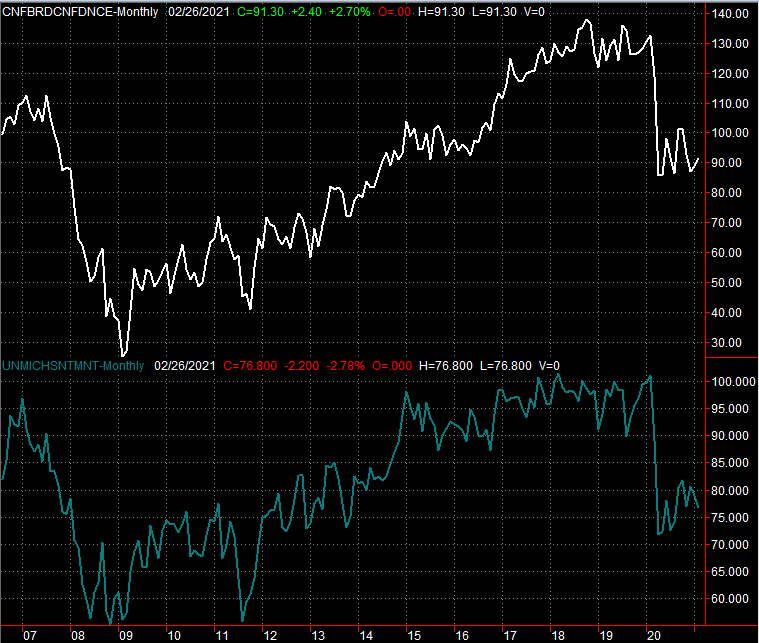
It's not terribly urgent or imperative at this point, but on Thursday look for the third and final reading of Q4's GDP growth rate, followed by the third and final reading of the University of Michigan's consumer sentiment survey. It's unlikely the GDP growth estimate will be revised from its previous print of 4.1%, which is solid, but coming from a place of weakness in the middle of last year. As for the Michigan Sentiment Index, economists are modeling a slight improvement of the second February estimate, which would mark a particularly strong improvement in January's final figure.
Consumer Sentiment Charts
 [6]
[6]
Source: Census Bureau, TradeStation
It's curious progress given the rhetoric surrounding last month's retail spending report and the clear slowdown in homebuying.
Stock Market Index Analysis
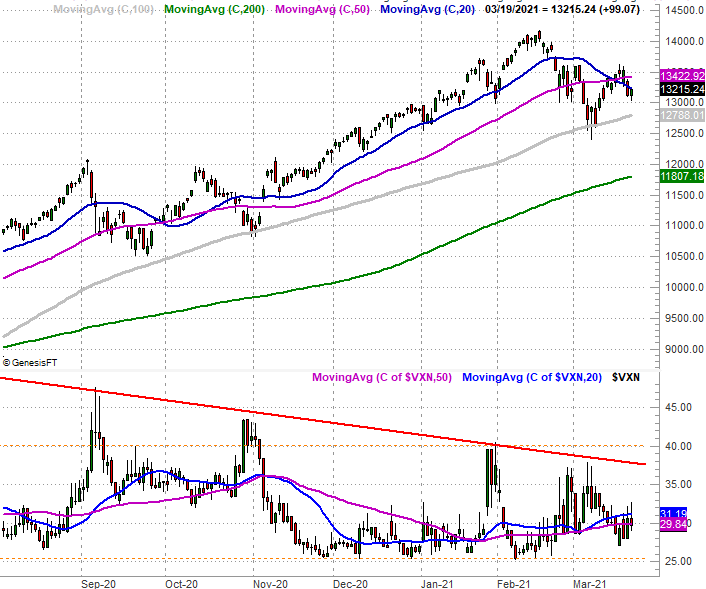
The market may still be on the bullish side of the fence, but it's not in an ideal situation for the bulls. The NASDAQ is below its key short-term moving averages, and never even came close to testing last month's peak. It's an important detail, as the NASDAQ Composite tends to lead the market higher or lower.
Let's start this week's look at the charts there. On the daily chart of the composite below, the 20-day (blue) is below the 50-day (purple) moving average line, and the NASDAQ itself is below both of them. The 100-day moving average line (gray) that was a major technical support level earlier this month is about to be tested again… as it was back in late-October. And, it's clear the market is struggling with the weight of the big gains since November.
NASDAQ Daily Chart, with VXN
 [7]
[7]
Source: TradeNavigator
The NASDAQ's other liability is its volatility index, or VXN. It's too low.
That's not the end of the world. The VXN can remain "too low" for weeks on end and the market rallies the whole time, as was the case between November and last month. That's not a particularly sustainable condition though, especially when stocks are as overextended as they are at this time. The market tends to start rallies when the volatility indices are peaking… or at least have room to fall. Right now, the volatility indices only have room to rise, which works against stocks. Notice how the S&P 500's volatility index, the VXN, is coming up and off a period of sustained lows, having hit a multi-month low just last week.
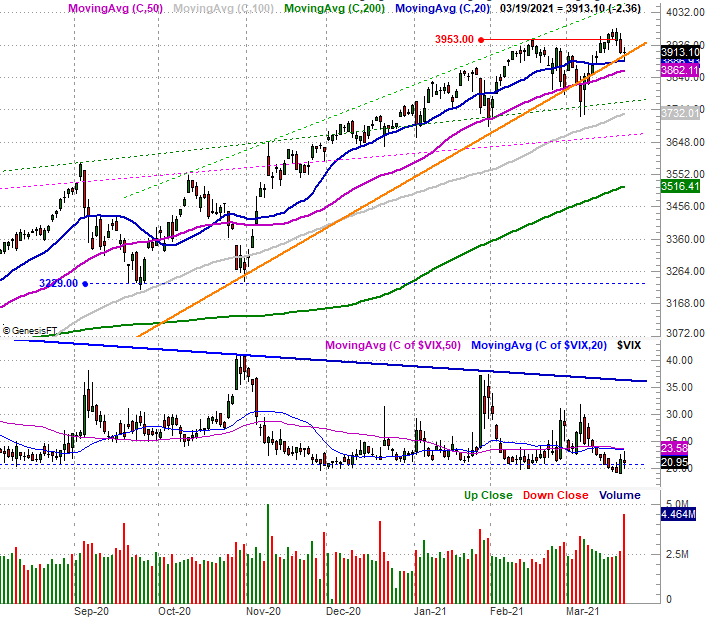
S&P 500 Daily Chart, with VIX and Volume
 [8]
[8]
Source: TradeNavigator
The S&P 500 is in better shape than the NASDAQ Composite in at least one way though. That is, it still appears to be finding support – pretty strong support – at its 20-day moving average line (blue) at 3887. The bears are going to have to tackle that one first if they're going to have any hope of putting a pullback into motion. [Friday’s volume spike is mostly the result of sweeping option expirations, and as such not a detail from which we should infer much.]
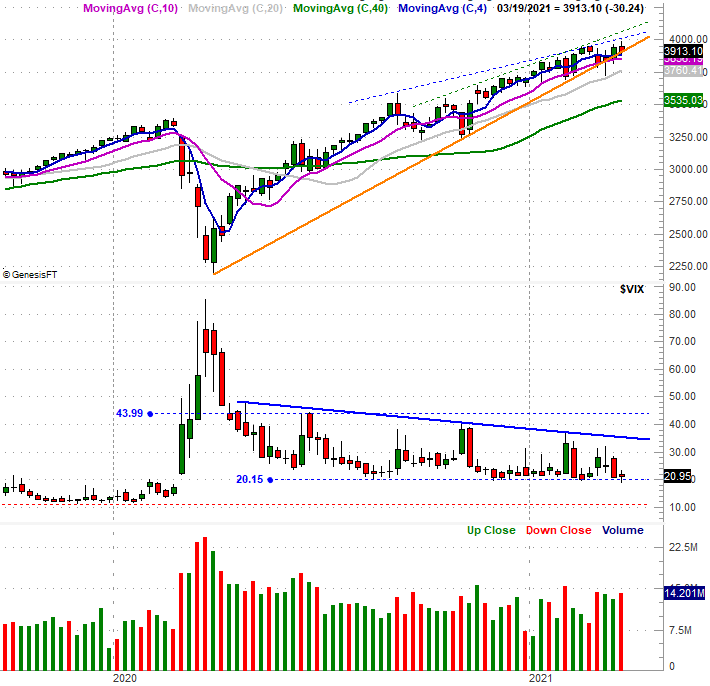
Now take a step back and look at the bigger picture, using weekly charts, starting with the S&P 500's. From this vantage point we can see just how much ground the market's covered since last March's low. We can also see, however, the weight of those gains is starting to make things tough.
S&P 500 Weekly Chart, with VIX, and Volume
 [9]
[9]
Source: TradeNavigator
The index is making higher highs, but each subsequent peak is a little less impressive than the last. We can also see how big of a deal the rising support line that connects most of the lows going back a year (orange) is being asked to do more work now than it's had to do at any time yet. Also notice the VIX's horizontal floor near 20. It can move lower, but it hasn't done so in well over a year.
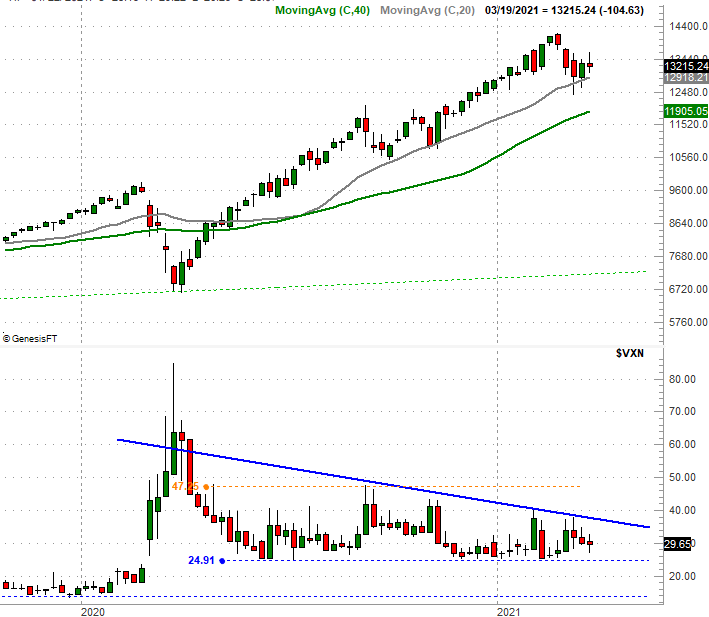
The NASDAQ's weekly chart looks similar, as does the NASDAQ Volatility Index. In the weekly timeframe though, we still can't help but notice the composite never even tried to revisit last month's high with last week's rebound effort. It's also inescapable that the 100-day moving average line (gray) is being tested in a big way as a technical floor. One or two bad days could do some significant damage.
NASDAQ Weekly Chart, with VXN
 [10]
[10]
Source: TradeNavigator
Simply put, this is a waiting game. The undertow is still bullish despite last week's stumble, but it's clear even the bulls are a bit rattled. The bears, however, aren't pulling the trigger. The good news (still) is though, we know exactly what's going to signal the beginning of a correction. The VXN and the VIX have both plotted key technical ceilings, and the NASDAQ's 100-day moving average line at 12,788 is within striking distance.
Hang tight. Clarity is coming.