On the surface the bulls got what they wanted. Stocks ended the holiday-shortened week on a high note, with the S&P 500 making a record high and record high close late Thursday. The NASDAQ fared even better, pushing up and off of the technical support we discussed a week ago. And, at all happened at the beginning of April… a month in which the S&P 500 averages a 1.56% gain, and is twice as likely to move higher than it is to move lower. All's right in the world.
Except, of all the ways to rekindle a rally, this is far from the ideal one. A couple of subtle clues (still) suggest there's not a lot of room left to run. And, Thursday's big jumps left behind a couple of pitfalls.
We'll take a look at those pitfalls after a recap of last week's economic reports and a look at what's coming this week. Spoiler alert: Last month's jobs report was fantastic.
Economic Data Analysis
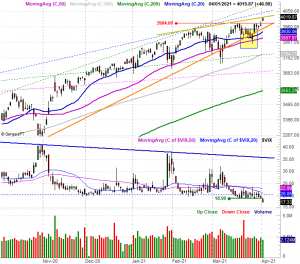
The employment update from the Department of Labor may have been last week's biggie, but there was plenty of other noteworthy data reported last week. Case in point: Home prices. Both the FHFA Housing Price Index and the Case-Shiller Index were up in a big way, underscoring sustained demand for homes and the ensuing shortage in homes to buy. Both measures continue to push deeper into record territory.
Home Price Index Charts
 [1]
[1]
Source: Standard & Poor's, FHFA, TradeStation
Of course, bear in mind that the Case-Shiller and the FHFA numbers reported last week were for January. Things could have changed in the meantime, and probably did to some degree. Also notice that February's pending home sales (not shown) fall more than 10%.
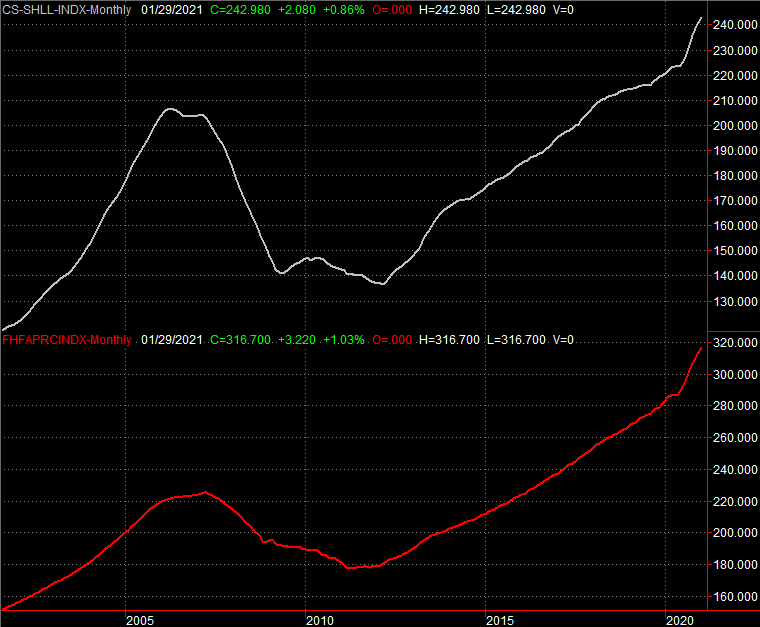
It's not from a lack of optimism though. The Conference Board's consumer confidence reading for March jumped to 109.7, easily topping expectations and hitting the highest level it's seen since the pandemic took hold.
Consumer Sentiment Charts
 [2]
[2]
Source: University of Michigan, Conference Board, TradeStation
This sentiment is supported by other data too. The ISM Manufacturing Index, for instance, jumped to a multi-year peak of 64.7 as the country's factories restart to meet a year's worth of pent-up demand.
ISM Index Charts
 [3]
[3]
Source: Institute of Supply Management, TradeStation
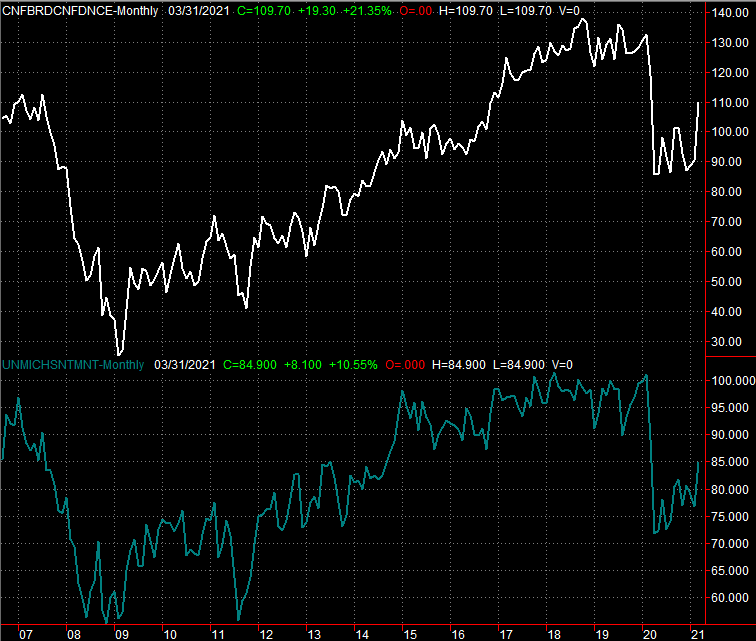
The same growth undertow is evident in the rebirth of a bunch of new jobs. That nation added (or at least restored) 916,000 jobs last month, pulling the unemployment rate down to 6.0%.
Payroll Growth and Unemployment Rate Charts
 [4]
[4]
Source: Department of Labor, TradeStation
Be wary of reading too much into the big jump, however. Most of these improvements were made in the areas of leisure and hospitality, education, and construction, the former two of which were directly and decidedly crimped because of pandemic-related restrictions. This isn't a sweeping evolution/revolution.
Everything else is on the grid.
Economic Report Calendar
 [5]
[5]
Source: Briefing.com
This week won't be quite as busy. In fact, there are only two items of interest, and those are just partial looks.
The first report worth a look will be Monday's ISM Services Index update, rounding out last week's ISM Manufacturing report. As was the case with factory output, analysts are modeling a measurable increase in service activity.
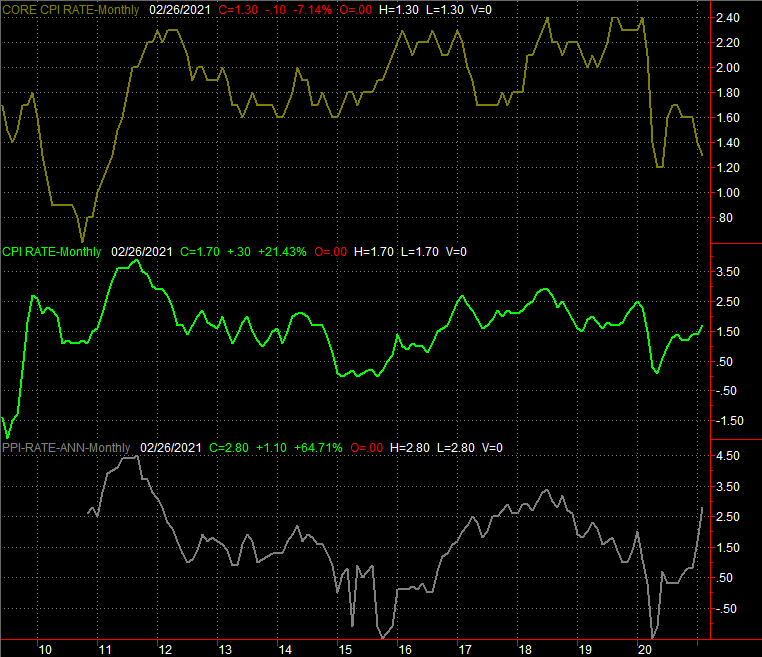
The other news to note is Friday's producer inflation update. Economists are looking for modest price increases for the nation's factories and processing plants, but not so much that the economy is stifled.
Inflation Rate (Annualized) Charts
 [6]
[6]
Source: Department of Labor, TradeStation
Look for consumer inflation data next week. It should be about as tame as it and producer inflation has been in recent months despite the influx of cheap money. Do know, though, that the proverbial bill is coming due sooner or later. As it stands right now the FOMC is calling for no inflation this year, and at most modest inflation through 2023, moving up to a palatable 2.1% (core).
Stock Market Index Analysis
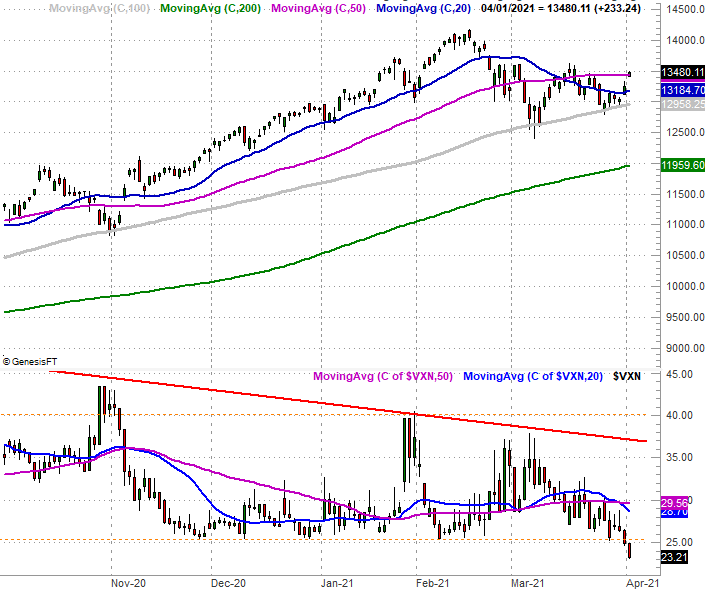
The NASDAQ Composite bounced up and off of the 100-day moving average line (gray) it ran into with the pullback from a week ago. That's the good news. The bad news is, it left behind a gap with Friday's portion of the rally, and it stalled when it bumped into the 50-day moving average line (purple) with Friday's surge, never actually clearing it. Take a look.
NASDAQ Daily Chart, with VXN
 [7]
[7]
Source: TradeNavigator
Some else just as curious (if not more curious) happened last week too. The NASDAQ's volatility index, or VXN, finally broke under a recent floor near 25.0 (red, dashed).
There are two interpretations of such an event. In some regards it's bullish, as the VIX tends to fall when the market is rising. This newfound downward push from the VIX implies the composite can keep rallying. In other regards, the VIX's move is bearish, as it takes the volatility index to multi-month lows that have been difficult to sustain for very long.
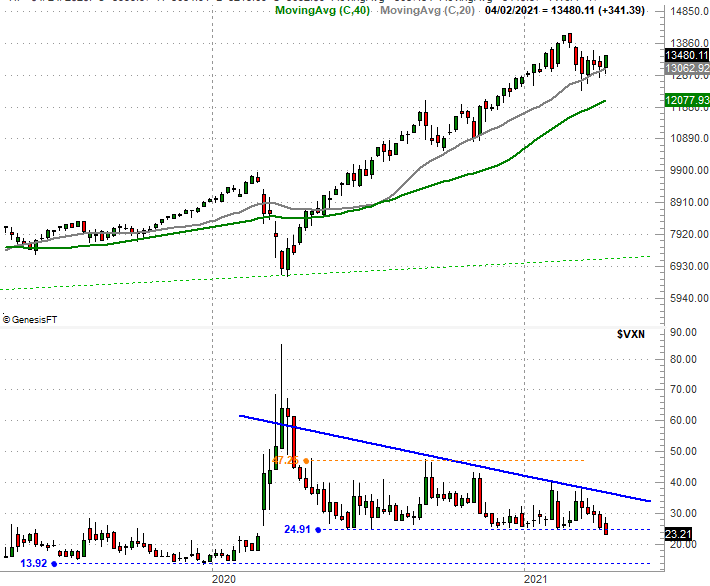
Except, maybe that slide under the 25.0 level isn't as problematic is at seems it could be. When zooming out to a long-term weekly chart of the NASDAQ Composite, we can see 25.0 isn't an absolute floor for the VXN. It can fall as low as 14.0 (blue, dashed) before it hits a dangerously low level. It's also from this viewpoint we can see just how dramatic the pullback since February has been. There's arguably room for a rebound now, if the sheer scope of the rally since last March isn't too great for our own good.
NASDAQ Weekly Chart, with VXN
 [8]
[8]
Source: TradeNavigator
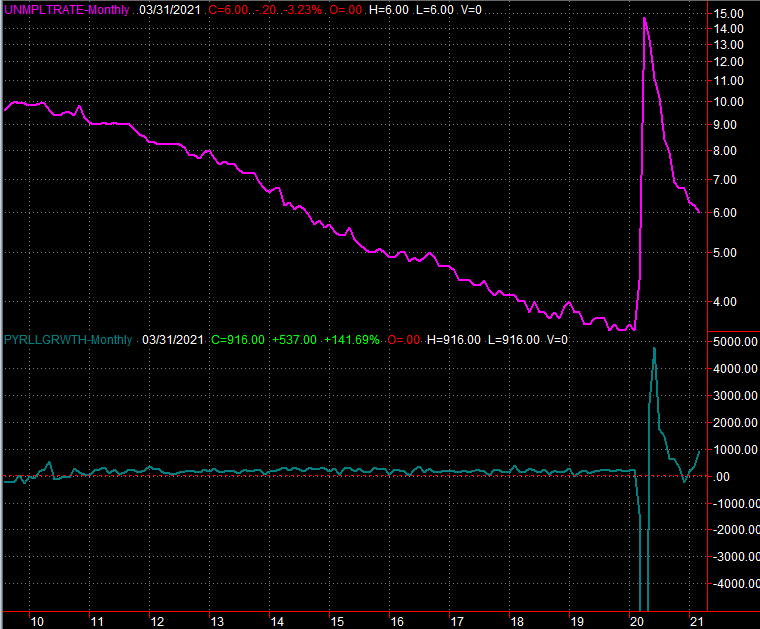
The S&P 500 looks similar, though not identical. Like the composite, the S&P 500 found support at key moving average lines a week ago (highlighted) and pushed up and off them last week. And, like the NASDAQ, the index left a gap behind in the process on Friday. Unlike the composite though, the S&P 500 pushed into record-high territory on Thursday and then again on Friday.
S&P 500 Daily Chart, with VIX and Volume
 [9]
[9]
Source: TradeNavigator
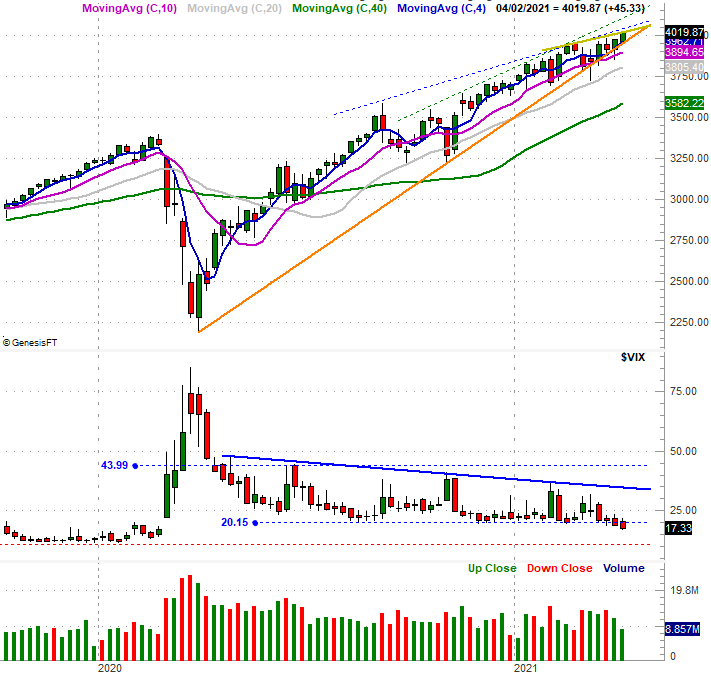
Here's the weekly chart of the S&P 500, for more perspective.
S&P 500 Weekly Chart, with VIX, and Volume
 [10]
[10]
Source: TradeNavigator
On the weekly chart we can see the S&P 500's Volatility Index – like the NASDAQ Volatility Index – may be breaking to new multi-year lows, but it's not yet to a more absolute low around 11.0. But, the weekly chart also shows us the S&P 500 is now creeping into the endpoint of a rising converging wedge, where there's little room left to navigate. [The bottom boundary of this wedge is orange, while the top part of more loosely defined by a few dashed-line ceilings.] If-and-when the wedge pattern fails to contain the index's movement, there's a lot of pent-up energy to release. Given the amount of bullish ground covered since the wedge started to take shape though, the most likely break out of the narrowing trading range is to the downside. In the same vein, while there's a little more room for the volatility indices to move lower, there's not a lot of room. The longer the VIX and VXN linger at or near multi-year lows, the greater the risk of their reversal…which will coincide with a pullback from stocks.
The tricky part of preparing for such an outcome is timing. While the prospect of a correction is clear, there's nothing to indicate traders are ready to make it happen. The most important technical support lines continue to hold up. They'll have to break down first before we can entertain the possibility that a selloff is taking shape. Until then, the rally remains intact.