
Hopes for a renewal of the rally that started to wobble four weeks ago were largely dashed last week, with both the NASDAQ Composite as well as the S&P 500 making their lowest weekly closes since early May. Yet, there’s plenty more room for both indices to keep falling, and a growing amount of reason to think they will.
Still, there are a couple of ways and places the bulls could make a stand.
But first things first. Let’s run through last week’s biggest economic news and preview what’s in the lineup this week.
Economic Data Analysis
Nothing wildly important was dropped last week, but a few items are worth noting. One of them was May’s new home sales. You may recall that sales existing homes edged a little higher last month, although are still lingering at the same low levels seen since sales dried up in 2023. Well, sales of newly-built houses plunged to a pace of only 580,000, falling under January’s then-multi-year low of 587,000.
New, Existing Home Sales Charts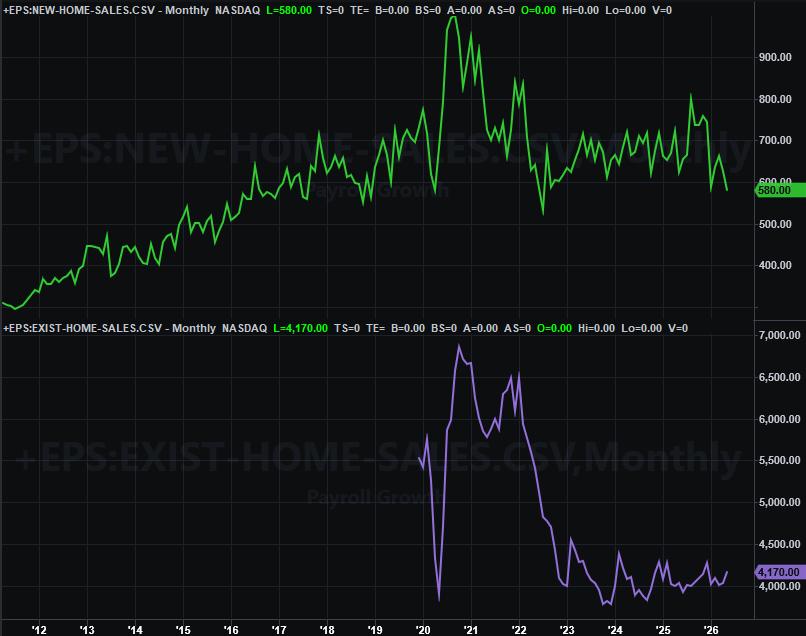
Source: National Association of Realtors, Census Bureau, TradeStation
Although home prices are holding up, clearly that alone doesn’t tell the whole story.
Last week’s big news was of course last month’s inflation snapshot as measured by changes to personal income and personal expenditures. It’s similar to the Bureau of Labor Statistics’ official inflation figure, but more important right now, May’s spending and income figures confirm the other measure, with expenditures rising 4.1% year over year on a 3.4% increase in income. The Fed’s got no room to lower interest rates anytime soon.
The only other report of any real interest last week was the third and final update of May’s consumer sentiment reading from the University of Michigan. Although not yet updated on our chart below, it did bounce just a little to 49.5. It’s too soon to say this is the beginning of a more meaningful rebound though.
Consumer Sentiment Charts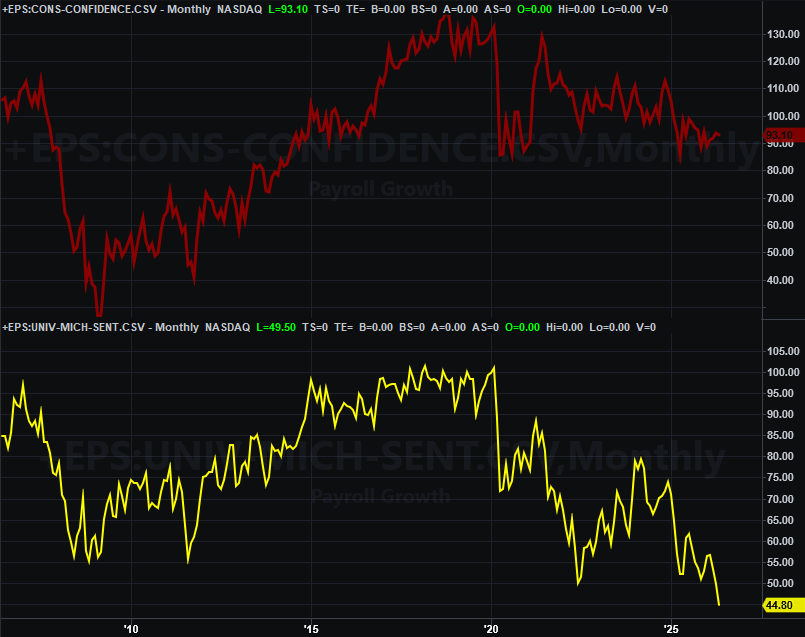
Source: Conference Board, University of Michigan, TradeStation
The Conference Board’s look at consumer confidence for this month is coming on Tuesday of this week. Look for a slight improvement of this number as well.
Everything else is on the grid.
Economic Data Report Calendar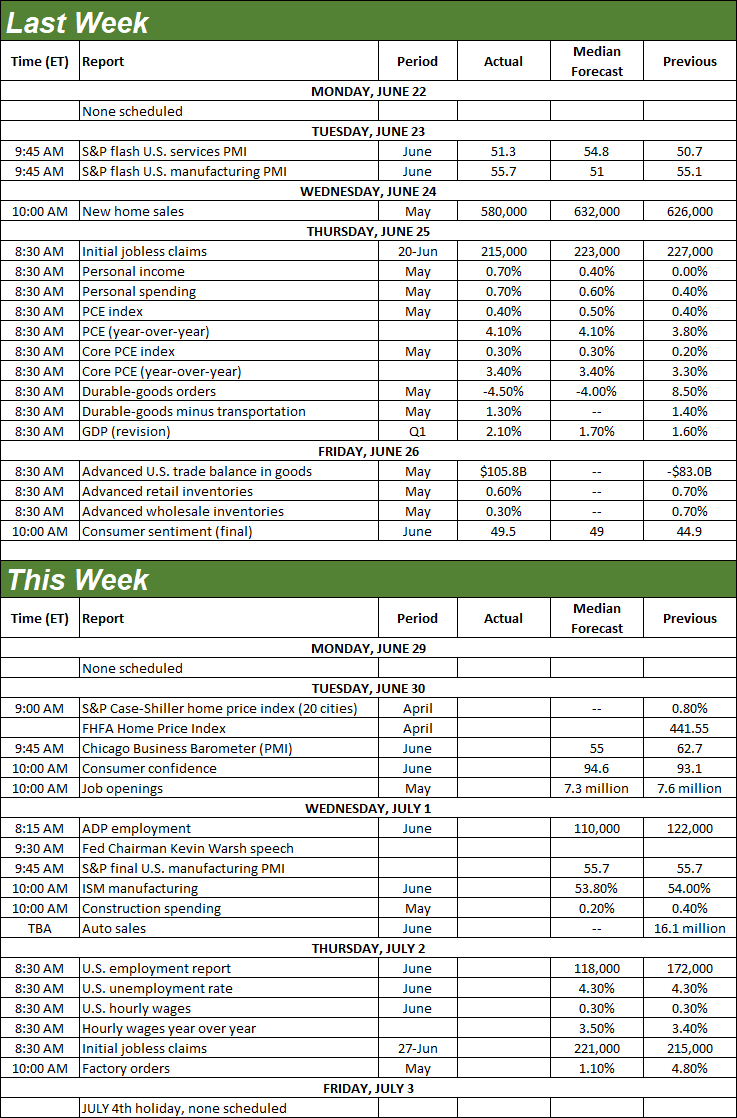
Source: Briefing.com, TradeStation
We’ll also be getting a couple of major real estate updates on Tuesday of this week. That’s the Case-Shiller Home Price Index, and the FHFA Home Price Index, both for April. Each is still relatively high, but continued growth has been anything but a foregone conclusion since early last year.
Home Price Index Charts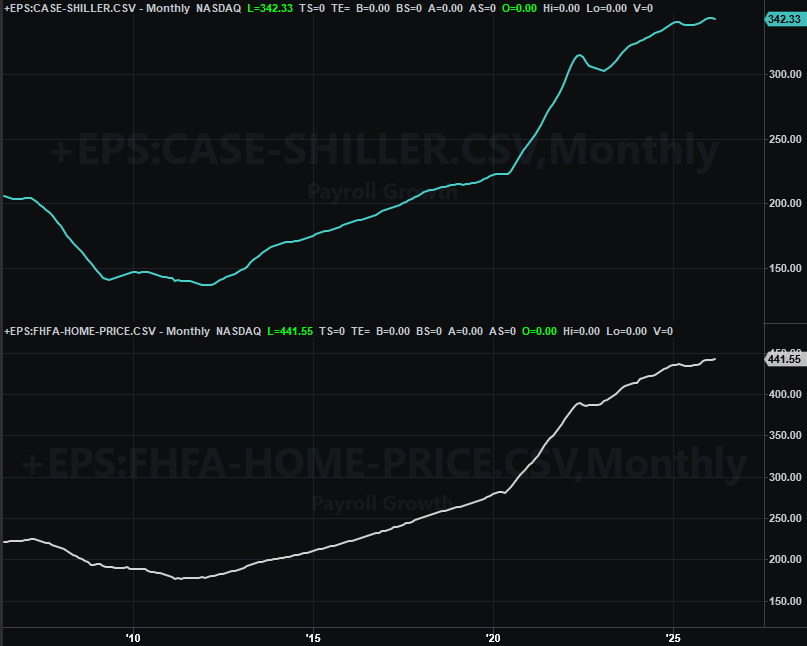
Source: FHFA, Standard & Poor’s, TradeStation
On Wednesday we’ll get June’s ISM Manufacturing Index report from the Institute of Supply Management. Economists think it cooled slightly, to 53.8. However, May’s figure surged. That’s still a very strong figure, confirming the economic strength that inflation (in a way) suggests.
ISM Services, Manufacturing Index Charts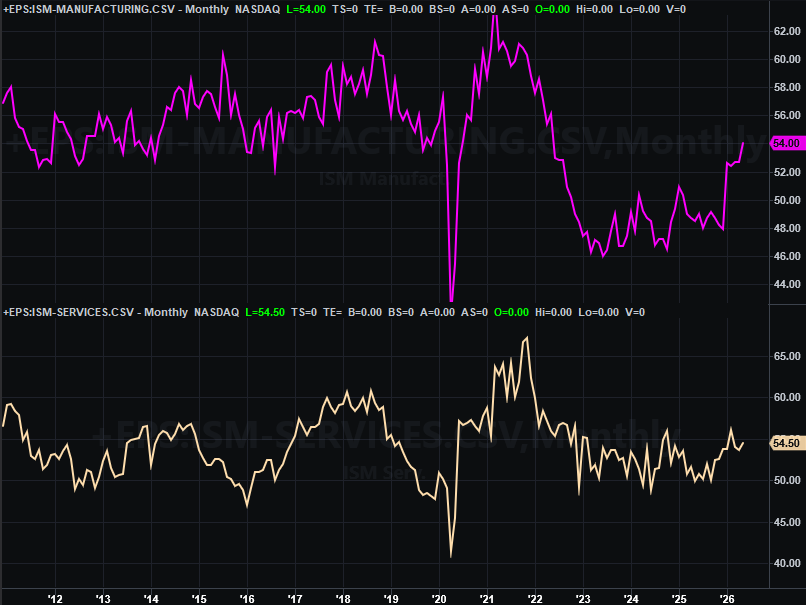
Source: Institute of Supply Management, TradeStation
The ISM Services Index for June won’t be released until next week.
This week’s big news will of course be Thursday’s (not Friday’s) jobs report for June. You may recall May’s figures ended up being surprisingly strong. Forecasts for June’s payroll growth are dialed back slightly, but they should still be more than enough to hold the unemployment rate at a pretty low 4.3%.
Unemployment Rate, Payroll Growth Charts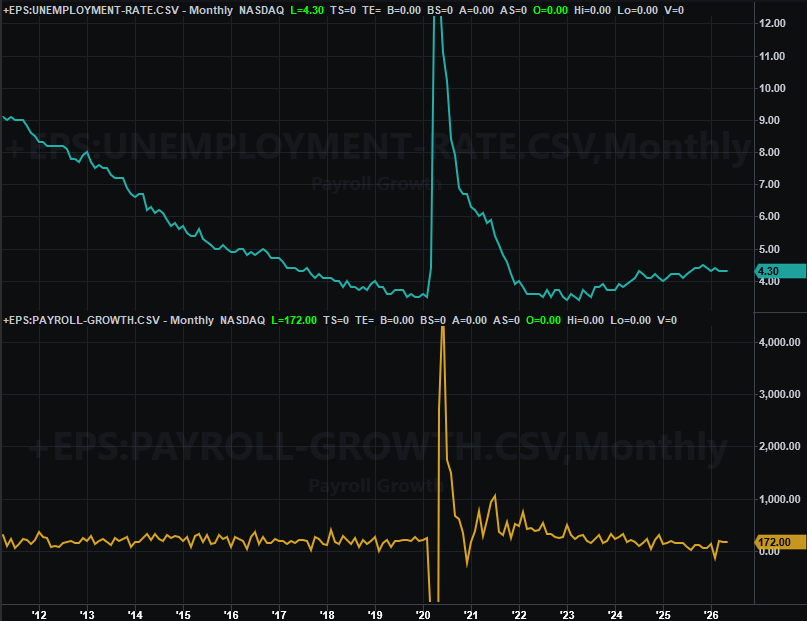
Source: Department of Labor, TradeStation
Stock Market Index Analysis
The weekly chart of the S&P 500 below doesn’t say it all, but it says most of it. When the index bumped into a long-term technical ceiling (dashed) four weeks ago, the market immediately reversed course. The bulls tried to push back the next couple of weeks… trying to rekindle the bullishness that had been so rewarding from early April. They finally had to give up/give in though. Stocks are still too overbought, and as could have been expected, the wild valuations so many AI-related stocks are sporting are finally being questioned.
S&P 500 Weekly Chart, with MACD and VIX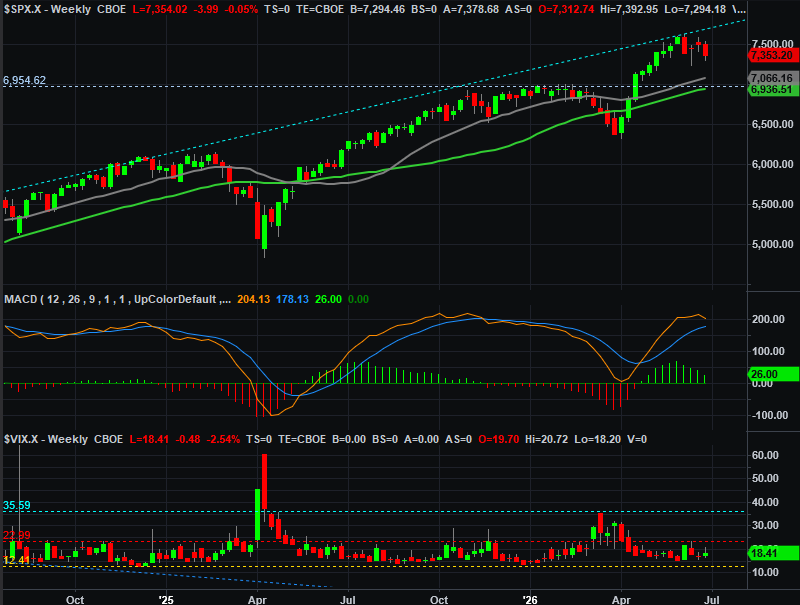
Source: TradeNavigator
As the weekly chart also shows us, there’s some room for the S&P 500 to continue sliding before finally finding a technical floor somewhere around 7,000.
The really odd (and somewhat scary) aspect of the weekly chart above? The Volatility Index (VIX) isn’t pushing higher. It’s not even acting like it might want to try to do so. Given the market’s weakness, you’d expect at least a little more “up” from it to clear what’s increasingly looking like a technical ceiling (red, dashed) at 23.0. It’s a problem just because the market tends not to make a major bottom until the VIX makes a pointed top… like it did in March.
The NASDAQ Composite’s weekly chart looks similar, although not identical. Here we’re seeing at least a little upward travel from the NASDAQ’s Volatility Index (VXN), although it’s certainly not pointed enough to suggest the composite has already made its bottom. That said, the weekly chart suggests the NASDAQ Composite’s next technical floor is around 24,100 (red, dashed), where the index peaked late last year.
NASDAQ Composite Weekly Chart, with MACD and VXN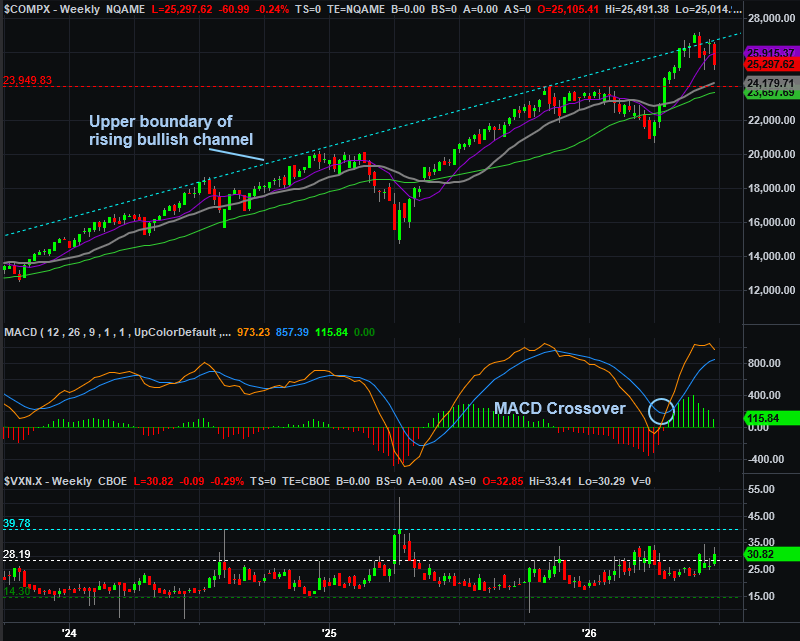
Source: TradeNavigator
Here’s a zoomed-in, daily chart of the NASDAQ Composite. The only additional nuance worth noting here is that last week’s low is also the low made earlier in the month (green, dashed) at 25,000. Maybe that means something. Maybe not. Either way, a move below that mark opens the door to the next floor somewhere around the 100-day (gray) or 200-day (green) moving averages.
NASDAQ Composite Daily Chart, with Volume and VXN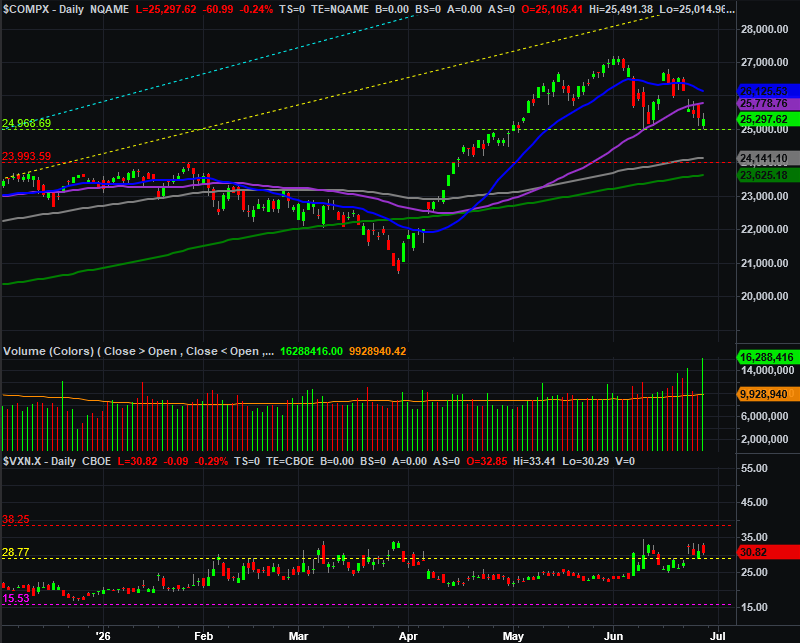
Source: TradeNavigator
Finally, here’s the daily chart of the S&P 500. Note that the index closed under its 50-day moving average line (purple) after falling under it on Friday, unable to crawl back above it despite its best late-session effort. That’s a problem. On the other hand, what used to be a technical ceiling (red, dashed) through February seems to be technical support now, propping the index up in early June and again on Friday. It’s something — although not much — to build on.
S&P 500 Daily Chart, with Volume and VIX 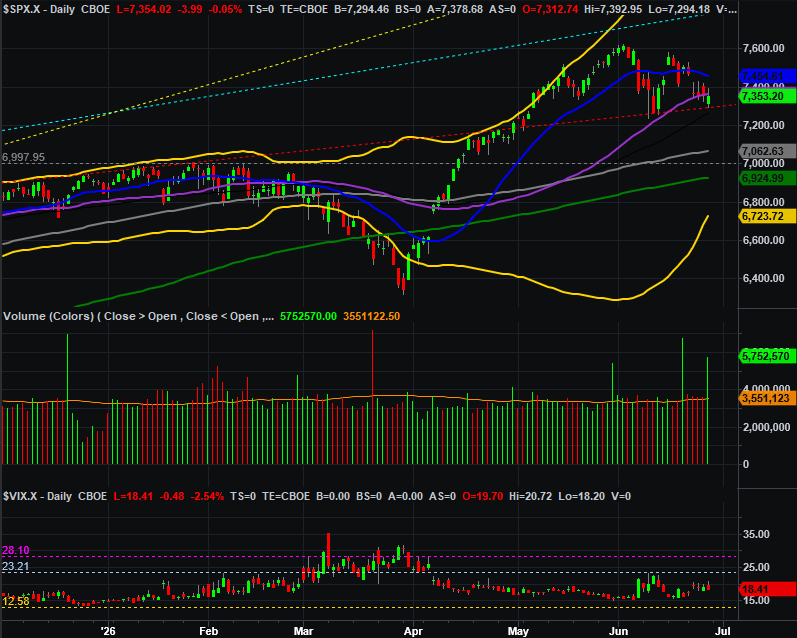
Source: TradeNavigator
Just chill for now. The bulls may be feeling good enough to continue wading back in early this week, pushing up and off of the technical floors encountered on Friday. It remains to be seen if that effort’s going to go anywhere, however, and even if it does, the 20-day moving average lines (blue) loom above. They’re going to be tough to hurdle now that the market’s illustrated it’s vulnerable to its recently-creating technically-overbought situation… and its steep valuation. We’re still overdue for an ordinary correction, and the path of least resistance is still down.
We’re also at a time of year that’s not exactly known to be wildly bullish for stocks.