
A week ago stocks were rolling. But, the effort also felt like it was running out of steam, as at least the S&P 500 is also testing a key technical ceiling. Although the NASDAQ Composite managed a small gain and has a little room in front of it before bumping into resistance, things are getting tougher.
And, there’s another small red flag.
We’ll look at things in some detail in a moment. Let’s first look at last week’s biggest economic news and preview what’s coming this week.
Economic Data Analysis
There was only one data set of any real interest posted last week. That’s inflation. As of November it’s still holding up. In fact, it actually ticked a little higher last month, with the overall inflation rate edging up from 2.6% to 2.7%. Producer prices continue to rise as well, extending a rising trend that’s been underway since the middle of last year. At this current rate, consumer prices can’t remain this well contained forever.
Consumer, Producer Inflation Charts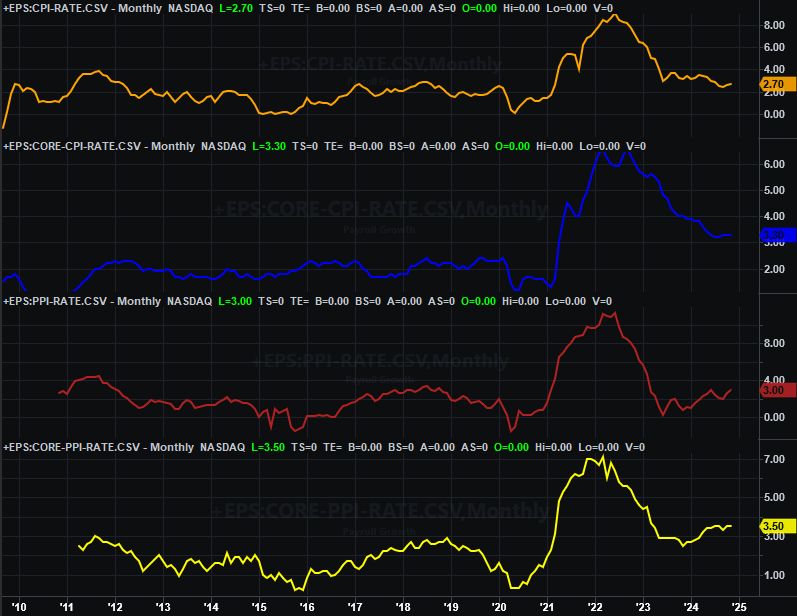
Source: Bureau of Labor Statistics, TradeStation
This complicates things for the coming week. The Federal Reserve has a scheduled chance to change interest rates on Wednesday, and the prevailing consensus thus far has been — and still is — that a quarter-point rate cut is in the cards. It wouldn’t be crazy if the FOMC chose not to do so this time around though… although it’s likely already been decided, and won’t be changed now.
Everything else is on the grid.
Economic Calendar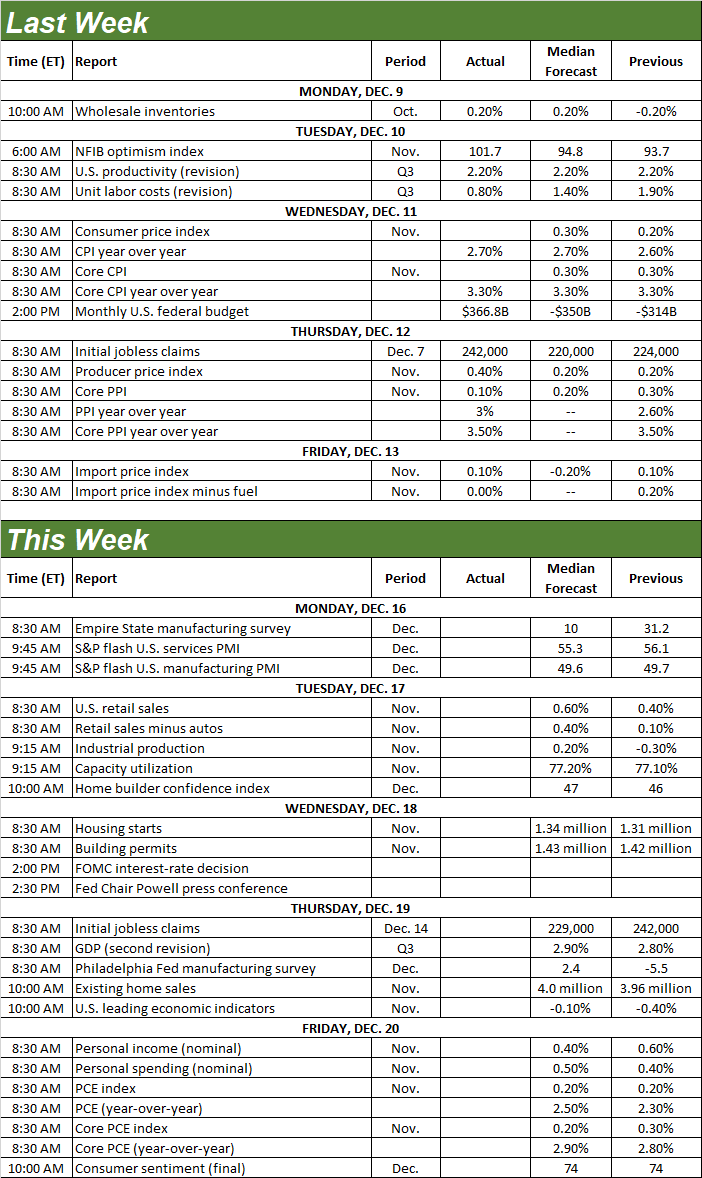
Source: Briefing.com
This week’s loaded, with far more than Wednesday’s decision regarding the Fed Funds Rate.
The party starts on Tuesday, with last month’s retail sales as well as November’s capacity utilization and industrial production.
Retail spending has been mostly growing since early this year, and is expected to accelerate from October’s paces for last month.
Retail Sales Charts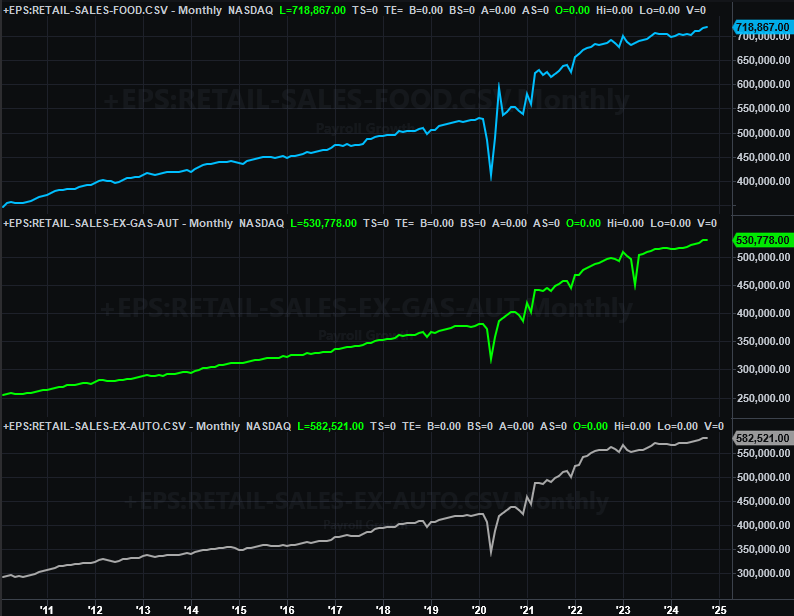
Source: Census Bureau, TradeStation
Industrial output and usage of the nation’s factory capacity has been waning — or at least been stagnant — since 2022. So far it’s not been a major impediment to economic growth, but thee correlation between this data and corporate profits is a strong one. Economists are calling for a slight improvement of these numbers for November, but certainly not enough of an improvement to say the tide’s taking a turn for the better.
Industrial Production and Capacity Utilization Charts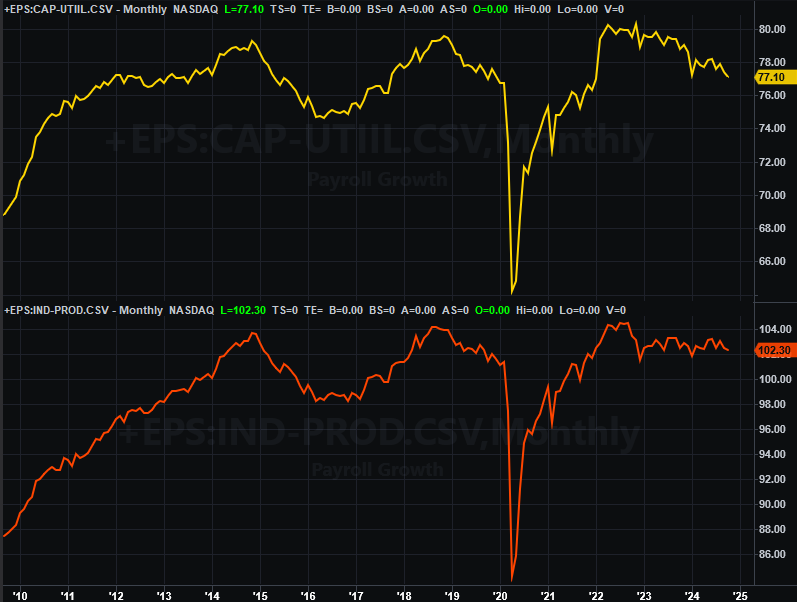
Source: Federal Reserve, TradeStation
Last month’s housing starts and building permits will be posted on Wednesday, before the Federal Reserve makes its interest rate decision. Both of these data sets have also been edging lower for some time. Don’t look for any real change from October’s anemic levels.
Housing Starts and Building Permits Charts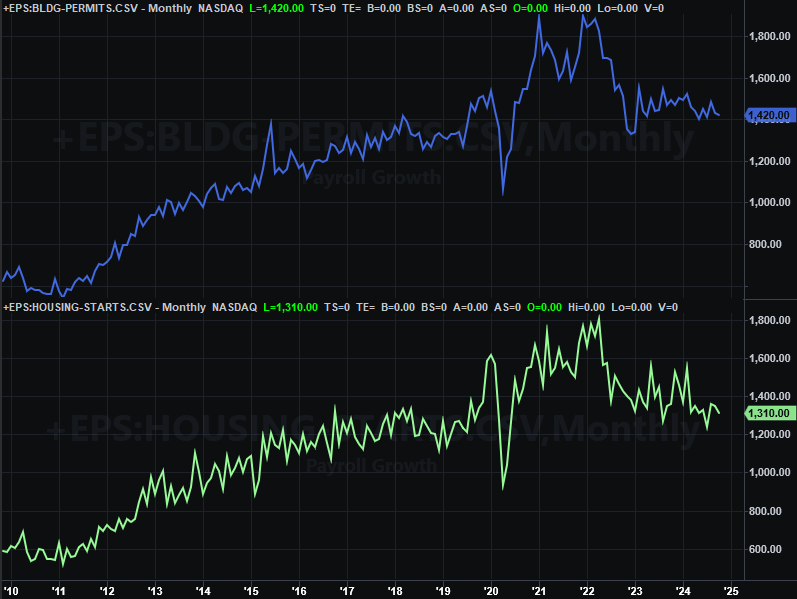
Source: Census Bureau, TradeStation
Last month’s existing home sales report will be posted on Thursday. They perked up a little bit in October, but should remain at relatively low levels.
New, Existing Home Sales Charts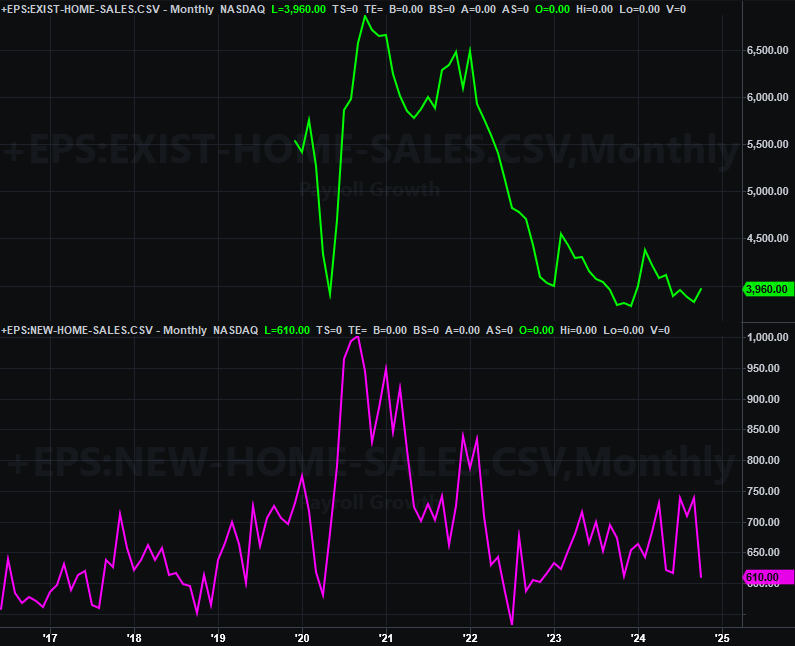
Source: Census Bureau, National Assn. of Realtors, TradeStation
Meanwhile, as the chart above show, sales of new homes plummeted in October, offsetting the slight gains in sales of existing homes. November’s new home sales data will be reported next week, along with this month’s consumer confidence figure from the Conference Board. The University of Michigan’s third and final look at consumer sentiment is due this week, but we’ll save this discussion until next week’s outlook.
Stock Market Index Analysis
From a momentum-following perspective, the trend is undeniably bullish. The rally is undeniably facing fresh challenges though, which — yes — adds to the risk already put in place by the sheer strength of the rally.
And not even the market-leading NASDAQ is immune to this reality. Despite its 0.33% advance last week, a new technical ceiling solidified during the five-day stretch. Take a look at the daily chart of the composite below. Although up for the week, the NASDAQ was only able to test the line (purple, dashed) that connects all the highs going back to September’s peak. As you can also see, this resistance line serves as the upper edge of a converging wedge that’s been in place since August’s low; the lower boundary is the yellow dashed lines connecting all the major lows since then.
NASDAQ Composite Daily Chart, with VXN and Volume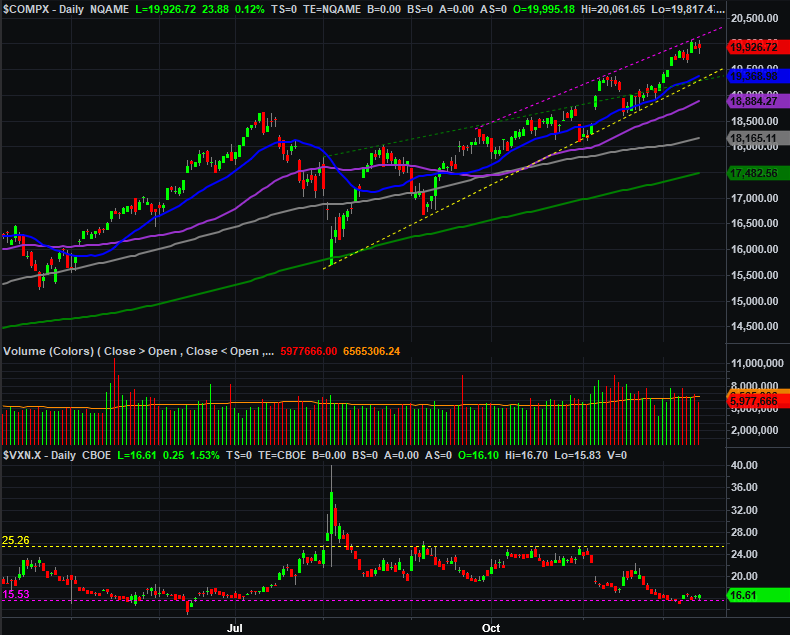
Source: TradeNavigator
Also notice the NASDAQ’s volatility index (the VXN, at the bottom of the chart) is indeed starting to push up and off of a floor around 15. This doesn’t necessarily guarantee a pullback is in the offing. But, it does suggest optimism has peaked and that traders are starting to entertain less-bullish, more-defensive thoughts.
That doesn’t inherently mean the market itself has peaked. As the weekly chart of the NASDAQ Composite below shows, there’s a little more room to travel before the index finally bumps into a long-term technical ceiling that extends all the way back to late-2022. The weekly chart of the composite also shows us, however, just how far the NASDAQ’s traveled since August’s low. It’s up 27% from that point, which — as the rest of the weekly chart makes clear – is a tough act to follow. The composite usually doesn’t, in fact.
NASDAQ Composite Weekly Chart, with VIX and MACD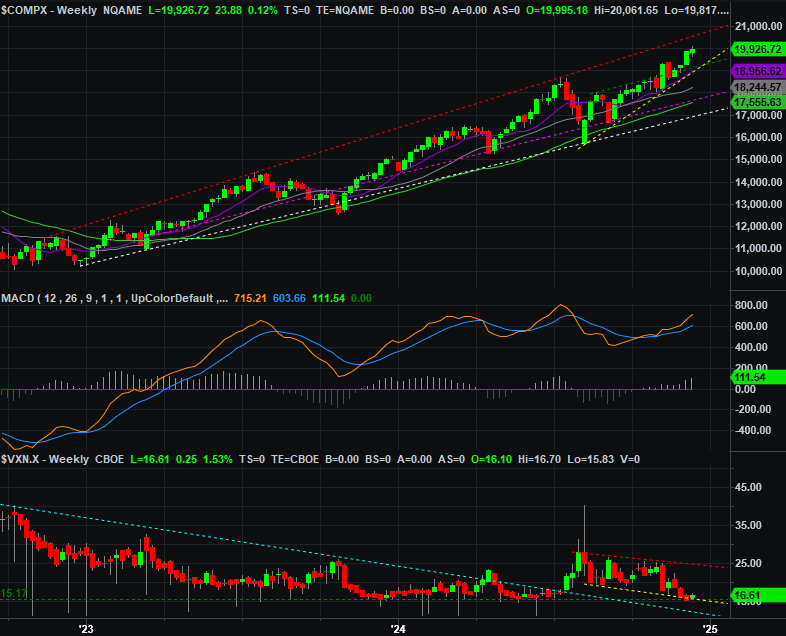
Source: TradeNavigator
The S&P 500 is also bumping into an equivalent technical ceiling, plotted in light blue (dashed) on the daily chart of the index below. Indeed, it bumped into this resistance line a week earlier and again early last week with near-perfection, but clearly wasn’t interested in pushing past that mark. And like the NASDAQ’s volatility index, the S&P 500’s volatility index (the VIX, at the bottom of the chart) is no longer moving lower. Traders are “maxed out” on bullish sentiment here, meaning they’re not likely to feel more bullish in a way that inspires meaningfully more buying.
S&P 500 Daily Chart, with VIX and Volume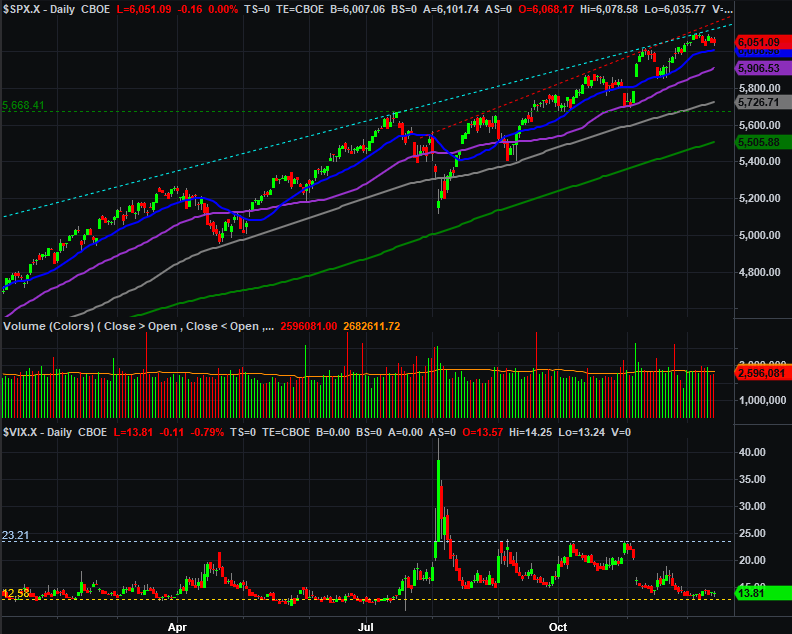
Source: TradeNavigator
The weekly chart of the S&P 500 puts things in a little more perspective. The technical ceiling in play right now is the real deal.
S&P 500 Weekly Chart, with VIX and MACD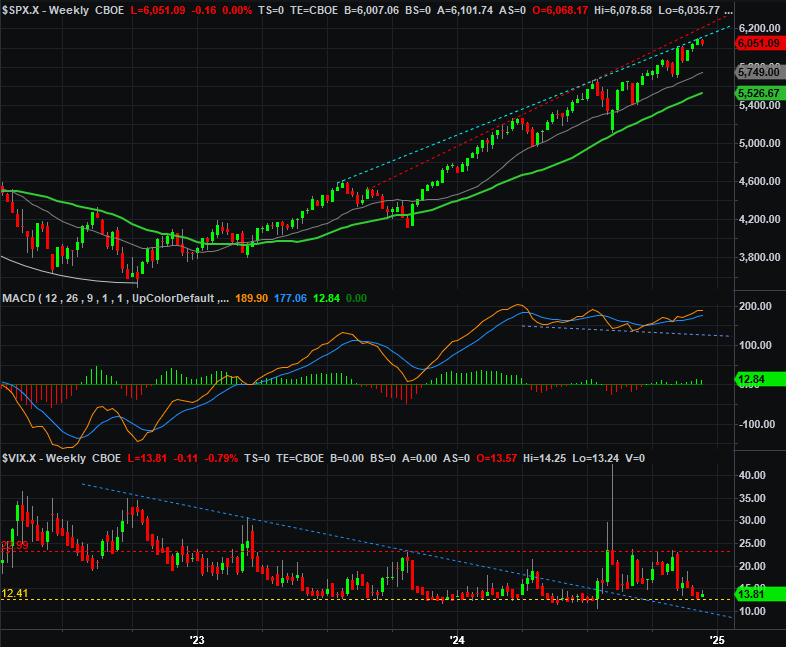
Source: TradeNavigator
So what now? The trend remains bullish, but there’s no denying the effort is running out of gas… the result of its huge rally over the course of the past five months. Just don’t panic too much if things seemingly start to unravel. Not only are we in a bullish time of year, but there’s a ton of technical support below current levels that could bring a quick end to any tumble… mostly moving average lines (although both indexes also still show the lower boundaries of their rising wedge patterns).
Just keep in mind that we are still due a sizeable correction. We haven’t been through a healthy “reset” for over a year now.