
 [1]Stocks mustered a couple instances of moderately bullish brilliance last week, but when all was said and done the buyers couldn't sustain the breakout from three weeks ago. The S&P 500 ended the week with a tiny gain , while the NASDAQ Composite booked a decline of just a little less than 1.0%.
And yet, in both cases the indices still ended above some major technical floors, keeping the rally on life support just enough for it to survive; we may sidestep a (much-needed) correction yet.
We'll look at how close the market is to cracking its technical floor below, right after a quick run-down of last week's economic news and previewing this week's economic announcements.
Economic Data
Last week was chock full of economic news, so let's just dig in and go through them in order of appearance.
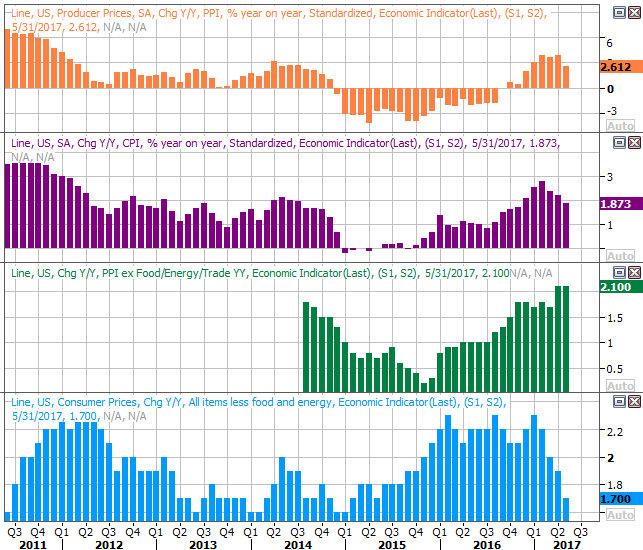
The first biggie was last month's inflation — there's wasn't much of it. Though on a core basis (ex-food and ex-energy) producers paid a little more, they didn't pay a lot more. And, on an overall basis, neither the nation's factories nor its consumers paid higher prices in May. The inflation surge from three months ago has been abated.
Consumer and Producer Inflation (Annualized) Charts
 [2]
[2]
Source: Thomson Reuters
That didn't stop the Federal Reserve from upping the Fed Funds rate by a quarter-point on Wednesday, as expected. But, what is surprising to some is how hawkish the Fed still sounds even after inflation and a few other economic data points cooled off.
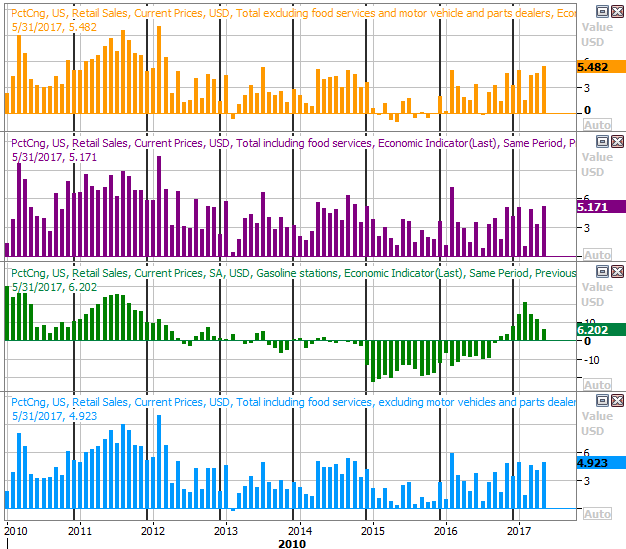
We also heard May's retail sales on Tuesday… a disappointment. Retail consumption was down 0.3% with or without automobiles thrown into the mix. As you can see, the pace of growth here seems to be slowing. The relative growth can slow even if the absolute growth stays steady. It's not clear, however, if even the absolute growth from one month to the next is holding up after a pretty good growth run.
Retail Sales YOY Growth Charts
 [3]
[3]
Source: Thomson Reuters
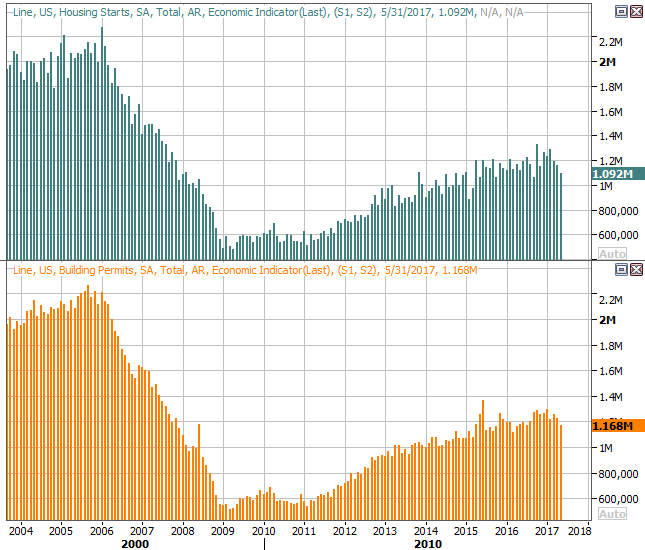
Finally, last month's housing starts and building permits were lackluster. That wouldn't be troubling in and of itself, but this was the third straight month both numbers fell, pointing to a slowdown for the overall real estate market.
Housing Starts and Building Permits Charts
 [4]
[4]
Source: Thomson Reuters
Everything else is on the grid.
Economic Calendar
 [5]
[5]
Source: Briefing.com
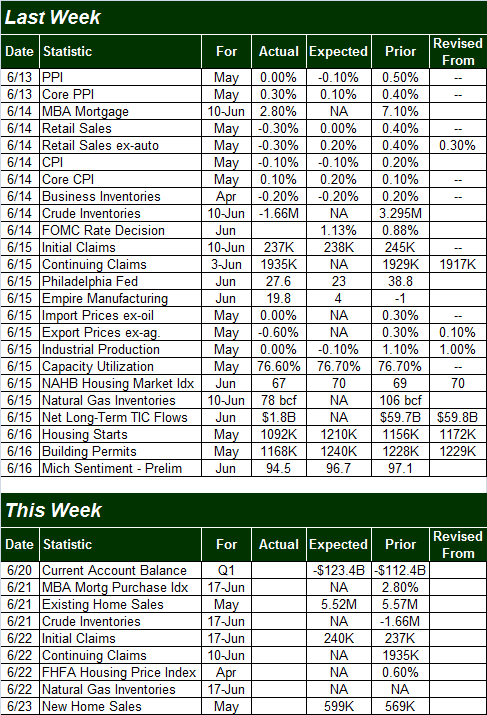
This week won't be nearly as busy, though it's going to be a huge week for real estate data. On the dance card are last month's new and existing home sales as well as a couple of different looks at home prices.
As for home sales, economists are looking for a slight pullback in Mat's sales of existing homes, but that lull should be more than offset by the uptick in new home sales. After an alarming weakness from April's home sales numbers, we could use some help on this front. If instead we see another tepid month, that could spell trouble not just for homebuilding and real estate names, but for all stocks.
New and Existing Home Sales Charts, with Inventory
 [6]
[6]
Source: Thomson Reuters
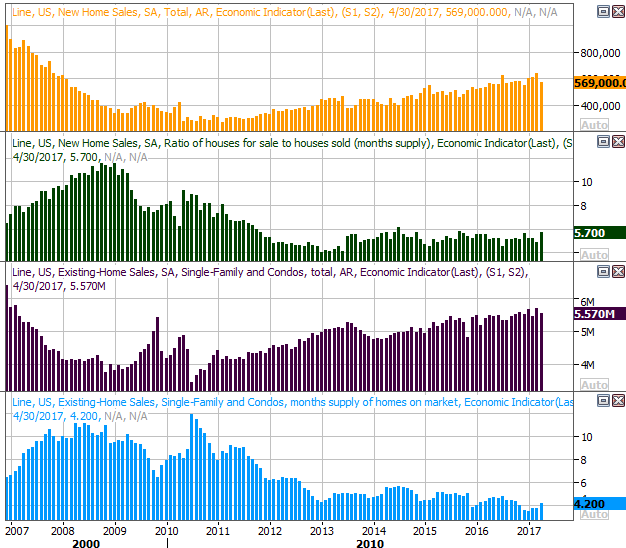
We're also going to hear the latest FHF Housing Prices Index data, though it will be for April rather than May. There's no outlook yet, but it's been trending higher for some time now and should edge higher again.
FHFA and Case-Shiller Home Price Index Charts
 [7]
[7]
Source: Thomson Reuters
The comparable Case-Shiller data for April won't be available for a couple of weeks, but like the FHFA data it's been trending higher as well. This is increasingly the only bright spot for real estate.
Index Analysis
The bears may have won last week, but they didn't deal a death blow to stocks. On the flipside, the indices are now within striking distance of some key support levels. We're on the verge of a make-or-break moment.
This is most evident on the daily chart of the NASDAQ Composite, so we'll start there this week. As you can see, the 50-day moving average line (purple) as well as the lower Bollinger band are both about to reach 6102, where the composite hit bottom a couple of days last week. At the same time, though the VXN peeled back from Monday's peak and back below a key level of 16.7, it's still within easy reach of popping back above 16.7 at the same time the NASDAQ itself is close to breaking under a key floor. If we see both happen around the same time — and if we see selling on high volume — be afraid.
NASDAQ Composite Daily Chart
 [8]
[8]
Chart created with TradeNavigator
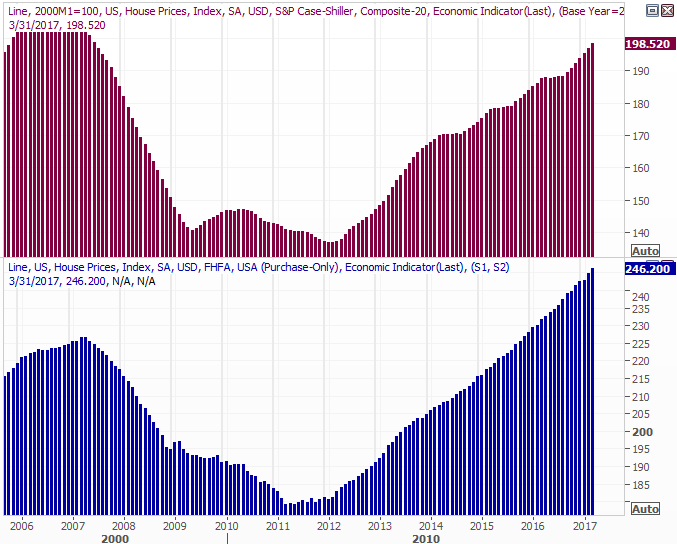
The S&P 500 doesn't look like it's in as much jeopardy….. mainly because it isn't dominated by the biggest tech names that have been so red hot of late. In fact, the S&P 500 index appears to be finding support at its 20-day moving average line, currently at 2421.
S&P 500 Daily Chart
 [9]
[9]
Chart created with TradeNavigator
That being said, the big floor to watch with the S&P 500 is 2373, though that support rises a little each day. That's the line that tags all the key lows going back to March (red).
You'll also see the VIX looks like it's testing its floors at 9.5 rather than testing its ceiling at 16.3. Again, this is a function of the fact that the index isn't overly-represented by the market's biggest tech names. It doesn't matter though. Until the VIX is above 16.3 and the S&P 500 itself has broken under its last possible floor currently around 2373, we can't assume a major pullback is ready to unfurl. One has been "supposed to" unfurl for a while now, and it hasn't happened yet.
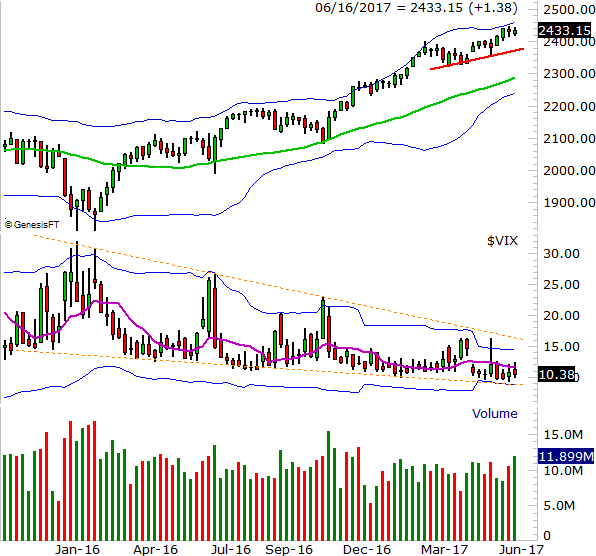
Zooming out to a weekly chart, however, gives us some perspective on just how overextended the market has become here, and why a corrective move feels so inevitable. The S&P 500 is now up 34% since its February-2016 low, and has gained 17% just since early November, with no major correction at any point in the past year and a half. That more than a little statistically unusual.
S&P 500 Weekly Chart
 [10]
[10]
Chart created with TradeNavigator
The weekly view also reminds us of just how oddly-low the VIX has gotten since 2015. Perhaps more important, the descending wedge patterns cautions us that the VIX is spring-loaded. If-and-when the upper edge of that triangle patter finally fails to hold the VIX down, it will likely coincide with a huge wave of profit-taking.
Again though, until the majority of traders are willing to make it happen, we can't count in it happening.
On the other hand, it would be naive to think some sort of corrective move isn't in the cards sooner than later. Just keep your eyes peeled, and keep a short least on any long trades. The market's running out of room here.