Thanks to Friday's 0.26% advance, the S&P 500 is now up 8.4% from its early October low… and deeper into record high territory. That makes for a rather bullish argument. Except, maybe it doesn't.
We've seen moves of this size and speed before end up topping out (and not that long ago). We also can't overlook the fact that the VIX is near levels often seen at major market peaks. In short, anybody who wants to be 'long' the market is pretty much already in the market. There may not be a ton of willing buyers waiting on the sidelines to push stocks up even more than that are now… at least not without a pullback first.
That's one possibility anyway. We'll explored this one and the alternative below, as always, after a rundown of last week's economic news and a preview of this week's announcements.
Economic Data Analysis
Not a terribly busy week last week, though a couple of items are worth a closer look.
Chief among them is the October update for the ISM Services Index. Contrary to some economic calendars (including our own), the ISM Manufacturing Index for November wasn't updated on Tuesday. That won't happen until a month from now. But, we do now have ISM data sets for last month. And, they're ok. The non-manufacturing measure not only remains above the critical 50 level, it grew, from 52.6 to 54.7. Meanwhile, the manufacturing measure for last month also grew, though not as much. It also remains below the 50 mark.
ISM Services and Manufacturing Charts
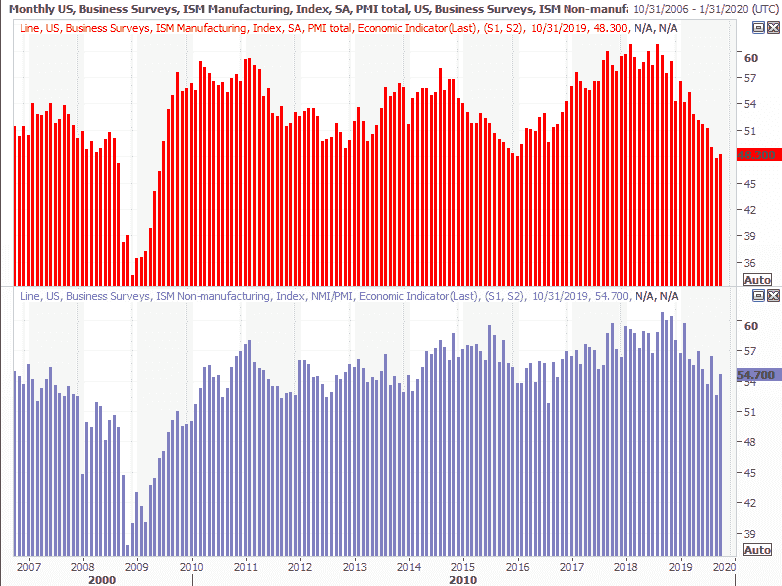 [1]
[1]
Source: Thomson Reuters Eikon
It's too soon to assume the worst, but do know that the nation's factories and production plants really are slowing… more on that below.
The only other item of real interest from last week is a piece of information we keep tabs on, even if we don't discuss it or disclose it every week. That's the amount of crude oil (and natural gas) the U.S. has stockpiled. It's a factor – although just one of several – that impacts the price of oil. In short, inventories are for some reason soaring again, defying disruptions in other parts of the world.
Crude Oil and Natural Gas Inventory Charts
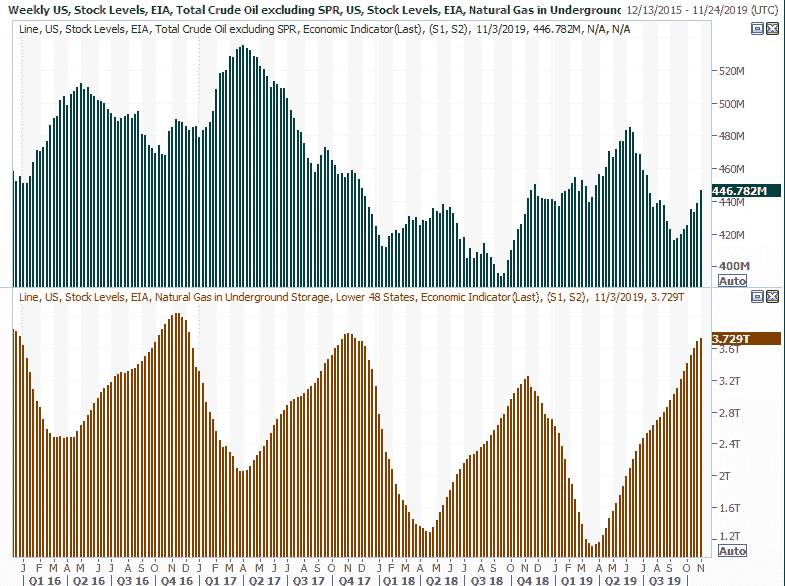 [2]
[2]
Source: Thomson Reuters Eikon
The trend puts downward pressure on crude prices, and generally speaking, once a trend takes shape, it tends to remain in motion for a while. Oil companies are slow to turn the spigots on, and then off.
Everything else is on the grid.
Economic Calendar
 [3]
[3]
Source: Briefing.com
This week will be considerably busier, with three (well…. four, technically) reports that are must-sees.
First though not foremost, look for last month's consumer inflation report on Wednesday, followed on Thursday by the producer inflation figures for October. Both have been tame, giving the Federal Reserve lots of room to lower rates and do other things to stimulate the economy. Analysts expect a little more pricing pressure this time around, though nothing that could be considered a potential threat to the economy.
Producer, Consumer Inflation Charts
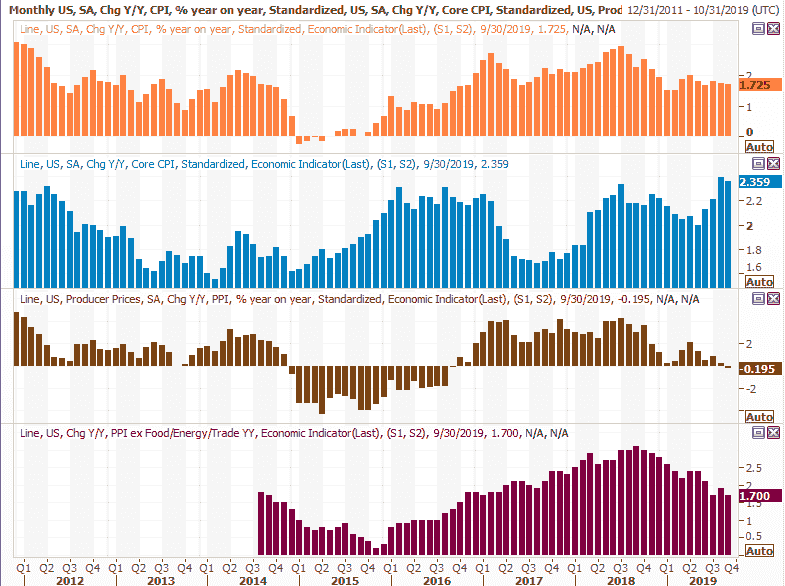 [4]
[4]
Source: Thomson Reuters Eikon
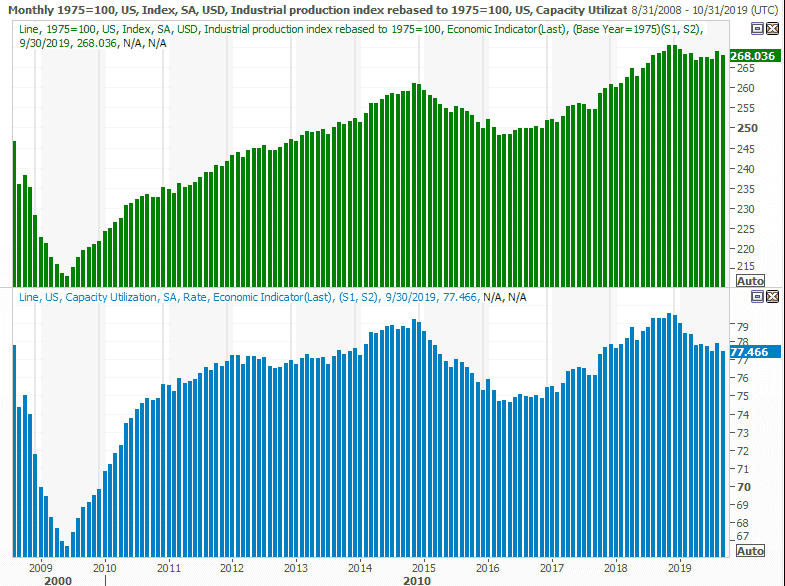
It will go mostly ignored, but it shouldn't be. That's Friday's look at last month's capacity utilization and industrial production.
It was mentioned above but merits more detail now – the industrial piece of the U.S. economy is struggling. That's not really the case any more for services-based businesses, and enough consumers are spending generously to keep the overall economy humming. But, that total pace can't persist without both elements firmly in place. To that end, economists believe utilization and well as total production fell again last month.
Industrial Production, Capacity Utilization Charts
 [5]
[5]
Source: Thomson Reuters Eikon
We could definitely use a pleasant surprise on this front. We got a surprise a month ago… just not a pleasant one. What looked like the beginning of a rebound in September was up-ended rather abruptly.
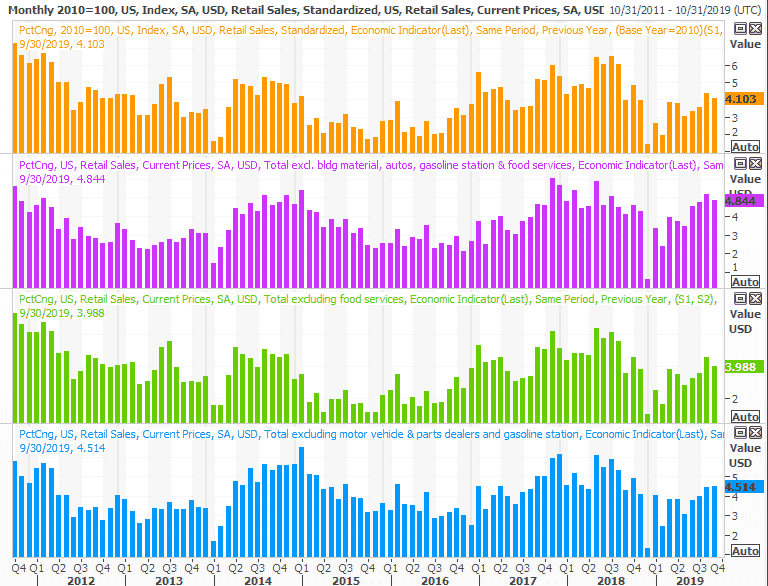
Finally, also on Friday look for last month's retail sales report – a bright spot. Year-over-year spending growth suggests people are enjoying much of their wage gain, and the pros are calling for an acceleration after September's slower pace.
Retail Sales Charts
 [6]
[6]
Source: Thomson Reuters Eikon
This will be a better-covered report than the Fed's production and capacity utilization figures, and has the ability to move the market more. That's fine for the near term, but retail consumption alone can't keep the economy moving at the pace we've become accustomed to.
Stock Market Index Analysis
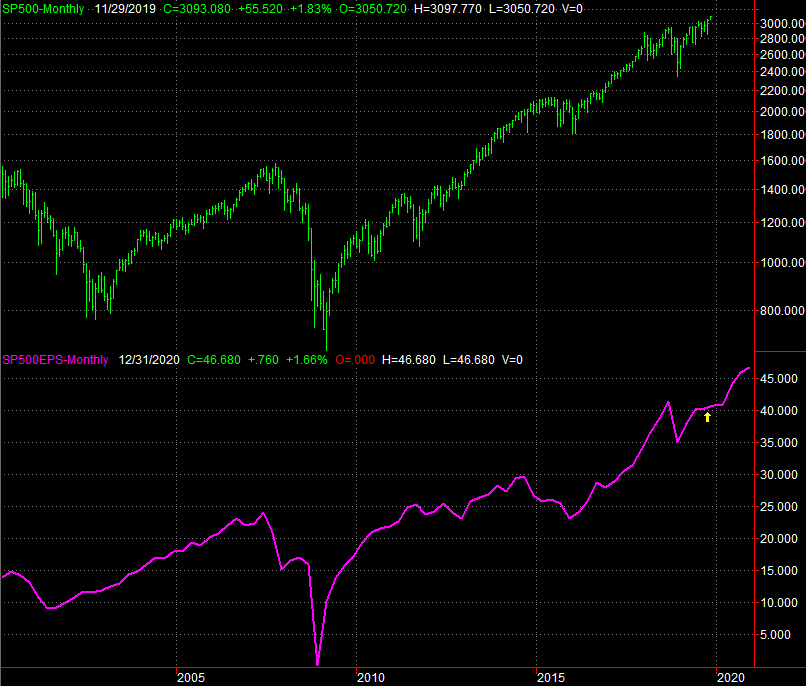
Were circumstances different, the past five weeks would be the foundation for a much bigger breakout. But, circumstances aren't different. The five-week, 6% gain means the S&P 500 is now up 32% since the December low. And, while that December low started with the advantage of taking shape after a pretty severe October-December drubbing, it's still an unusually big runup given the timeframe. It's also worth noting that earnings have actually stagnated of late. The gains are being made on an assumption that earnings growth will be rekindled. That's a pretty bold bet. The yellow arrow on the chart is where Q3's earnings stand, with nearly 90% of reports now in-hand.
S&P 500 Monthly Chart With Earnings, Past and Projected
 [7]
[7]
Source: TradeStation
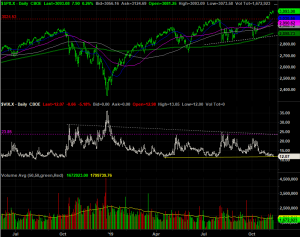
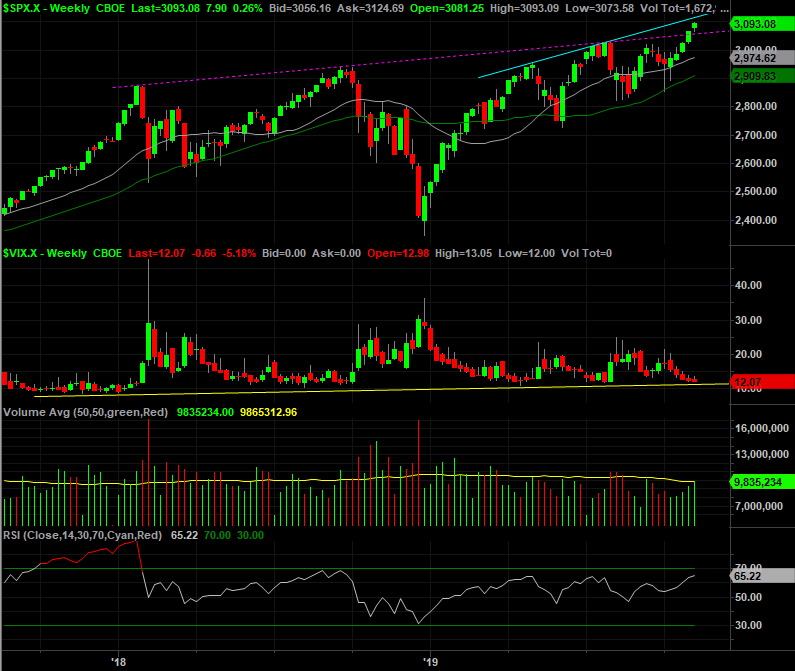
Either way, the weekly chart of the S&P 500 is now almost overbought (RSI). Also notice the weekly VIX is now bumping into a rather well established technical floor, plotted in yellow.
S&P 500 Weekly Chart, with VIX
 [8]
[8]
Source: TradeStation
Still, one has to appreciate the fact that the volume has been rising all the way up since early October. There's also a little more room for the index to keep rising before bumping into the ceiling that aligns the April and July peaks. All the same, there's not a whole lot more room for the market to keep on truckin'.
The same key nuances apply to the weekly chart of the NASDAQ Composite, save one key exception – the NASDAQ is already bumping into the technical ceiling that aligns the April and July highs.
NASDAQ Weekly Chart, with VXN and Volume
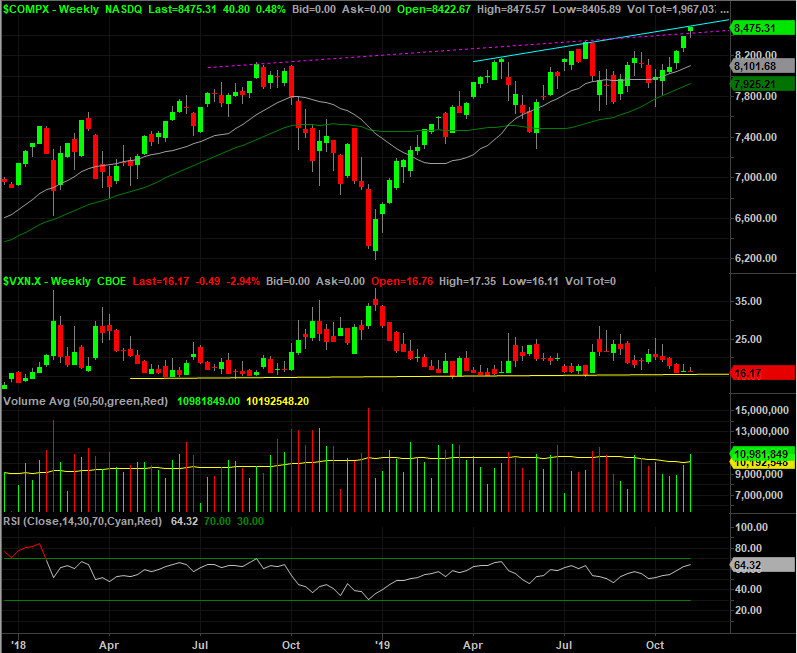 [9]
[9]
Source: TradeStation
Zooming into the daily charts doesn't change anything. But, it does show us where things are apt to stop and turn… in the event of a correction. For the S&P 500, there are two big lines in the sand. The first one is the same floor that prompted the lows in August and October, marked as a white dashed line. The other is the VIX's technical ceiling… ceilings, actually. One of them is the horizontal resistance at 23.85 plotted in purple. The other is the falling ceiling, marked as a gray dashed line, that tags most of the peaks since October of last year. Both are around 23.85 right now though.
S&P 500 Daily Chart, with VIX and Volume
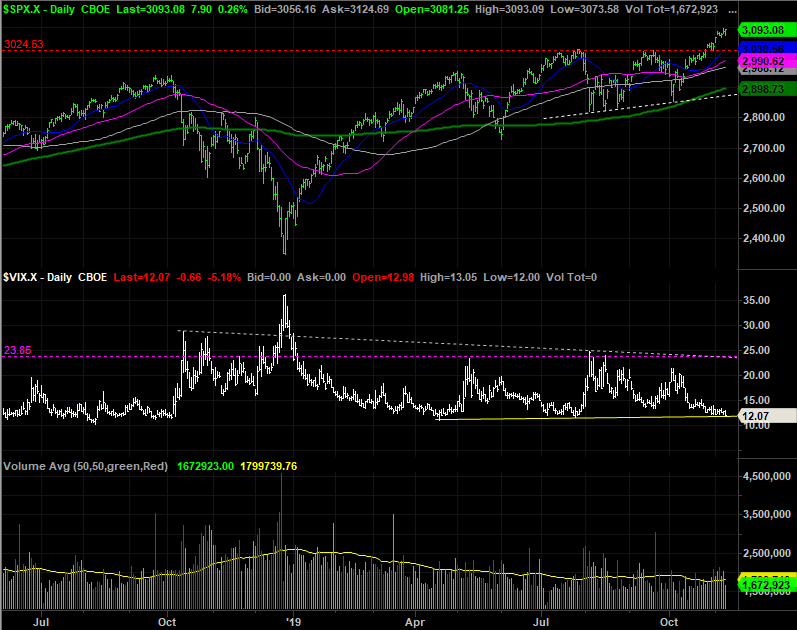 [10]
[10]
Source: TradeStation
For the NASDAQ, there are two potential landing points. One of them is the 200-day moving average line plotted in green, currently at 7893.8. The other is the line that connects most of the lows since late March, plotted as a white dashed line. It's currently at 7730, and rising a bit.
NASDAQ Daily Chart, with VXN and Volume
 [11]
[11]
Source: TradeStation
Of course, in the current environment, a technical read on the market doesn't mean a whole lot. It's all sentiment right now, and one headline or political development could change that sentiment at the drop of a hat. Exacerbating the headache here is the fact that we're now in a usually-bullish time of year. This time though, we're starting out with the disadvantage of being at the tail end of an oddly bullish ten-month stretch.
That being said, we can't rule out a meltup here either. It would only take a small break above the ceilings now being tested to incite that kind of enthusiasm again. Traders seem to want to make the usual year-end rally happen, even if it's not the healthy thing to do right now.