It was a choppy, inconsistent effort. When the bulls had to make their stand though, they did. The S&P 500 fought its way back above a key technical ceiling on Friday to end the week on a high note. It'll be much easier to start this week out on a bullish foot as a result, which may be just enough to kick-start the usual October pivot into a new uptrend.
Of course, the wrong headline could still up-end the effort.
We'll look at the matter in some detail below. First, let's review last week's biggest economic news and preview what's coming this week. While the market may be on the mend in the short run, real estate continues to be a sore spot. Let's hope it's not contagious.
Economic Data Analysis
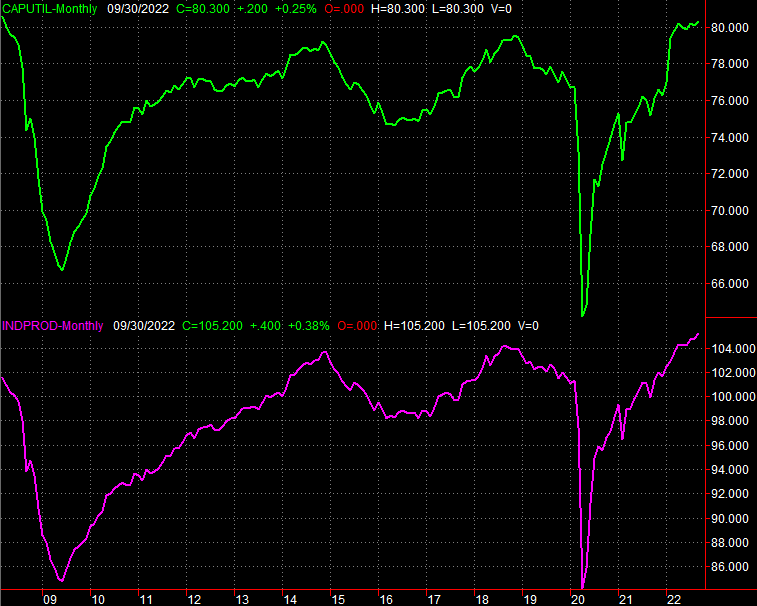
The overall economy is actually in decent shape. Utilization of the nation's factory capacity edged a little higher last month, to 80.3% versus expectations for a slight decline. And, actual production moved to another record in defiance of calls for a stall. Given the correlation between this data, corporate earnings, and the long-term market trend, this is generally encouraging.
Capacity Utilization and Industrial Production Charts
 [1]
[1]
Source: Federal Reserve, TradeStation
That respectable progress, however, is taking shape without any help from the housing market.
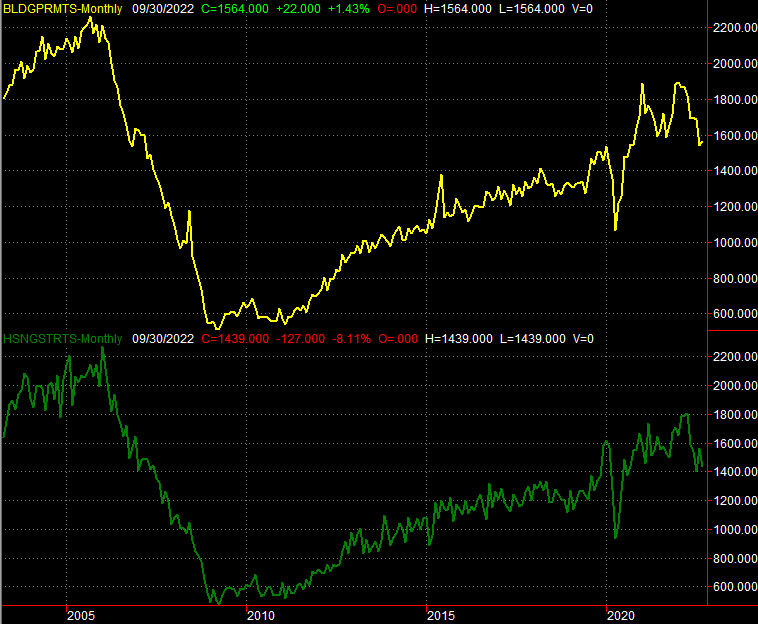
The first of these red flags came on Wednesday, from the Census Bureau. Building permits improved a little last month, coming in better than expected. Housing starts were about as bad as expected though, sliding from August's annualized pace of 1.56 million to 1.44 million. Both are still very near multi-month lows reached earlier this year, and that's a problem from any perspective.
Housing Starts and Building Permits Charts
 [2]
[2]
Source: Census Bureau, TradeStation
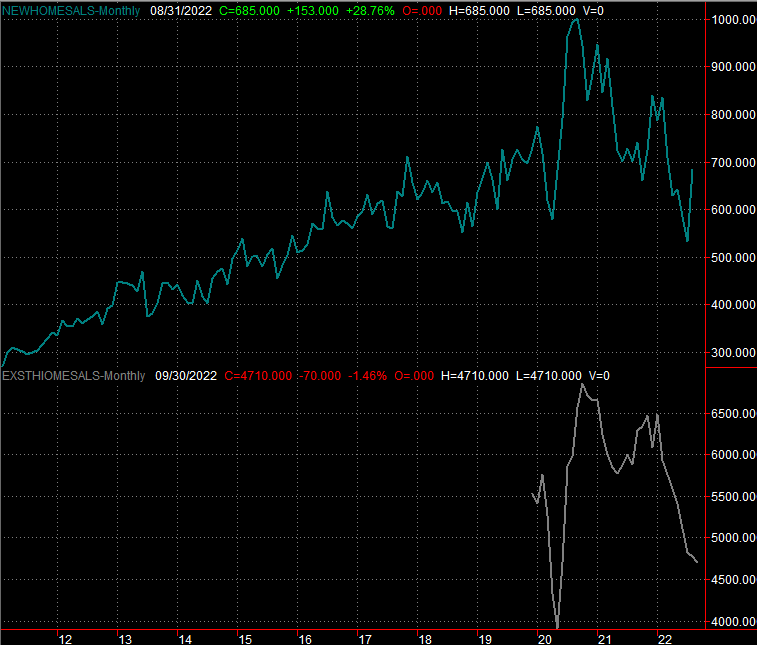
Home sales are looking even worse… at least so far. We won't hear about last month's sales of new homes until this week, but September's sales of existing home fell again to the lowest level since COVID's arrival in the United States stymied everything in early 2020. Not counting that temporary stumble, the existing home sales fell to a 10-year low.
New and Existing Home Sales Charts
 [3]
[3]
Source: National Association of Realtors, Census Bureau, TradeStation
The Census Bureau will post last month's new home sales numbers on Wednesday. Although they bounced in August, economists are calling for another sharp plunge to 550,000, near the multi-year low figure of 532,000 hit in July.
Everything else is on the grid.
Economic Calendar
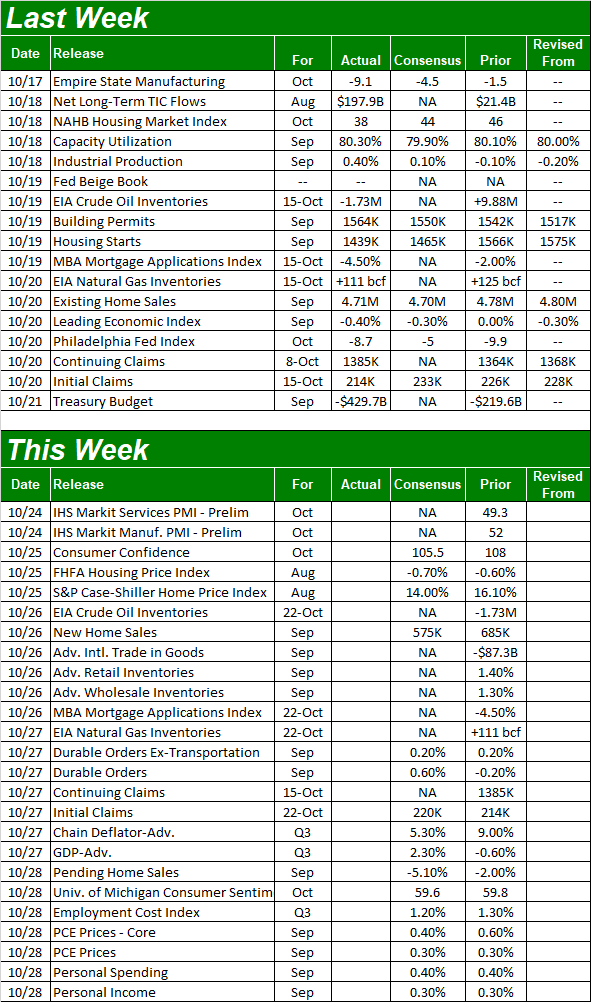 [4]
[4]
Source: Briefing.com
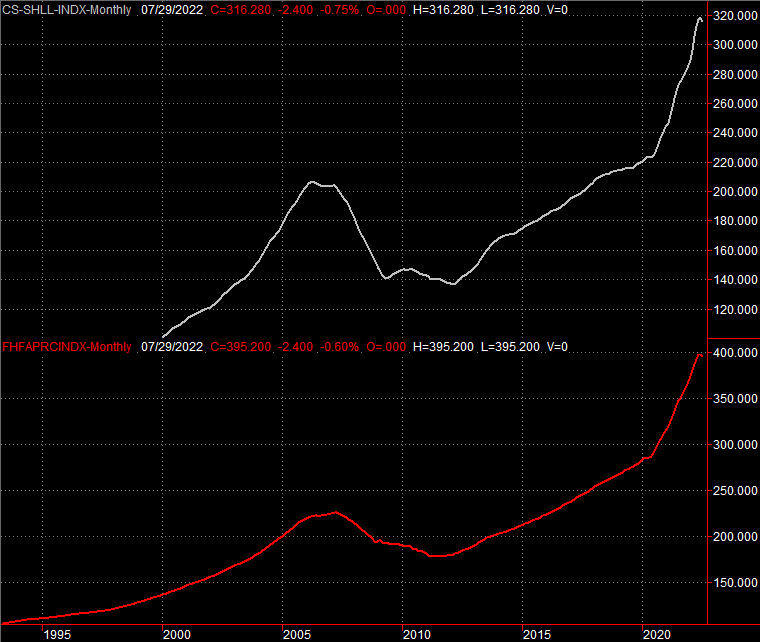
This week will round out the most recent snapshot of the housing market. Aside from new home sales figures due on Wednesday, the S&P Case-Shiller Home Price Index and the FHFA Housing Price Index will be out on Tuesday. Both fell for the first time since mid-2020 in July (both data sets are two months behind), and forecasters believe we're due for another decline. Given the starts and permits data along with the sales data, there's no reason to doubt the forecasts for another round of lower prices.
Home Price Charts
 [5]
[5]
Source: Standard & Poor's, FHFA, TradeStation
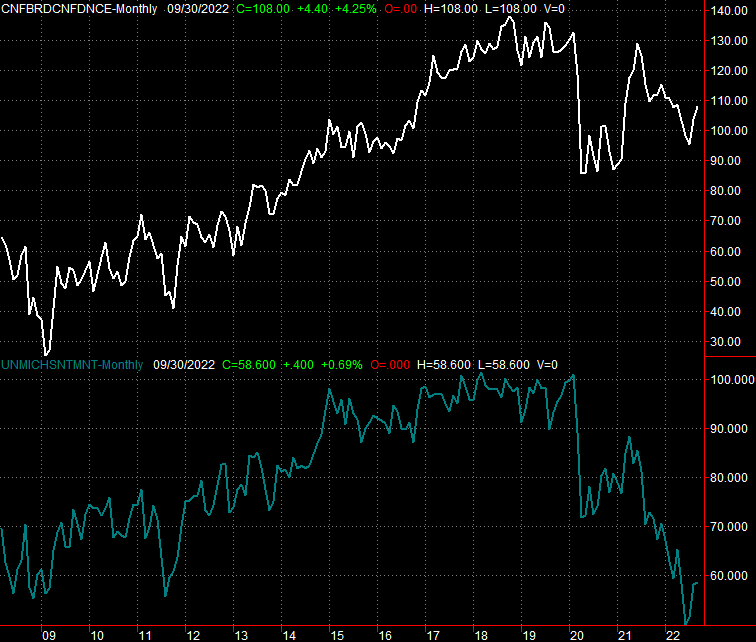
That's not the only noteworthy data coming this week though. While they can be somewhat connected to housing prices and home purchases, Tuesday's consumer confidence figure from The Conference Board and Friday's final look at October's consumer sentiment measure published by the University of Michigan will give us a good idea of how people are feeling about all the current headlines. The Conference Board's score is projected to fall just a bit, while the UM reading should edge a little higher from September's print. In both cases though, consumers still mostly seem more worried than not.
Consumer Sentiment Charts
 [6]
[6]
Source: Conference Board, University of Michigan, TradeStation
Stock Market Index Analysis
We'll cut straight to the chase. Stocks punched through a key technical ceiling last week, and in so doing at least opened the door to continued bullishness.
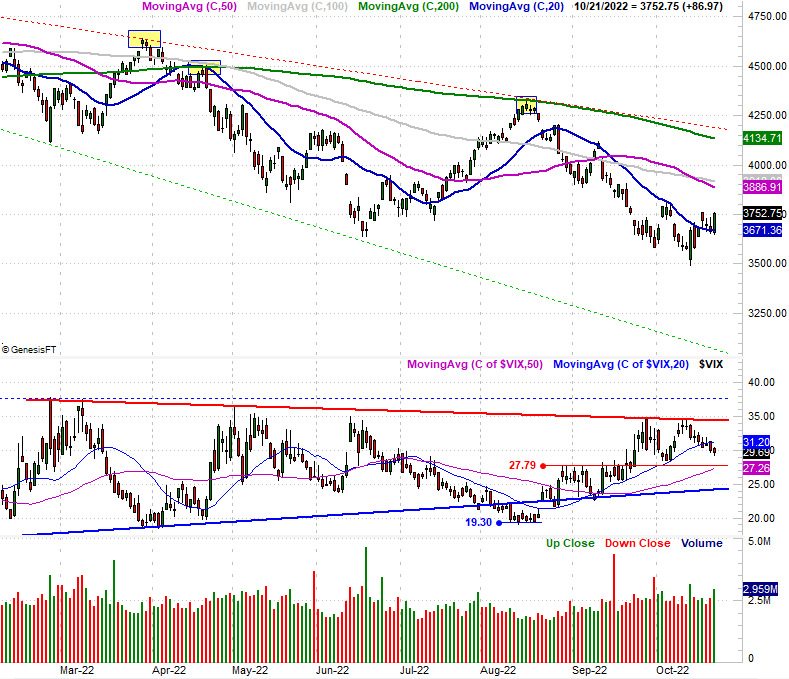
Take a look at the daily chart of the S&P 500 below. The index had been unable to move above the 20-day moving average line (blue) at 3671 despite several attempts over the course of the past few weeks. It popped back above that resistance level early last week though, and while stocks faltered later in the week, Friday's bullishness pushed the market back above this critical level to end the week on a bullish foot.
S&P 500 Daily Chart, with VIX and Volume
 [7]
[7]
Source: TradeNavigator
It's still too soon to call it an ironclad reversal. The bears will still get their chance to up-end this effort. If the market is going to make a meaningful recovery though, this is the best time of year to take the shot.
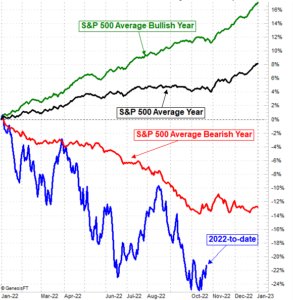
The graphic below illustrates the idea. Although most years are bullish ones, bearish ones tend to stop being bearish in October. That's why October is often referred to as a "bear killer."
S&P 500 Average Cumulative Annual Performance
 [8]
[8]  [9]
[9]
Source: TradeNavigator
The last quarter of the year isn't wildly bullish following a bear market. The usual year-end rallies tend to take shape only in bullish years. Stopping the selling is at least a first step to turning things around though, and while the average bearish year's year-end isn't bullish, that doesn't mean this time won't be. After all, this year's been particularly bad, setting the stage for a big rebound.
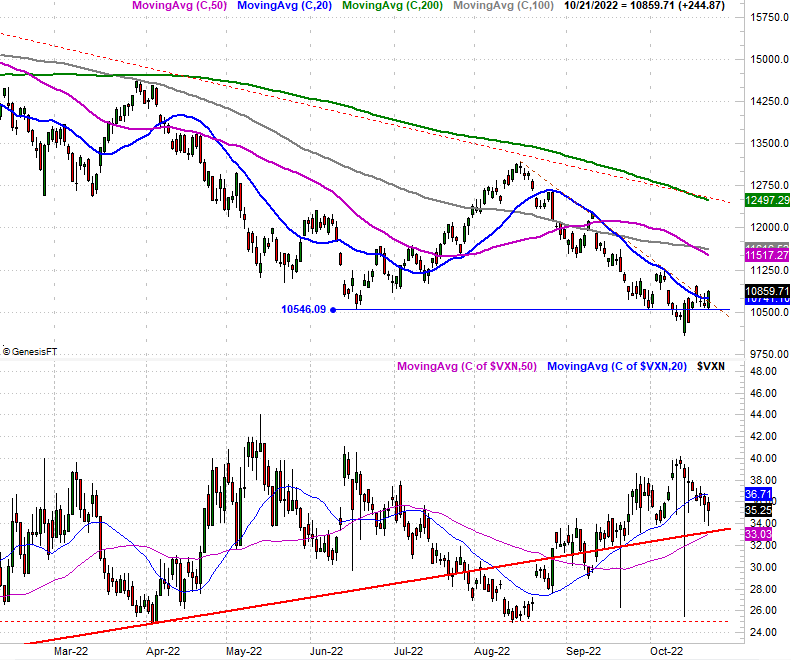
And the NASDAQ Composite is dropping the same hint. That is, though it was back-and-forth for the better part of last week, the NASDAQ ended last week by pushing its way back above its 20-day moving average line (blue) at 10,741 on Friday. There are still several ways the rebound effort could falter, this is a respectable start.
NASDAQ Composite Daily Chart, with VXN
 [10]
[10]
Source: TradeNavigator
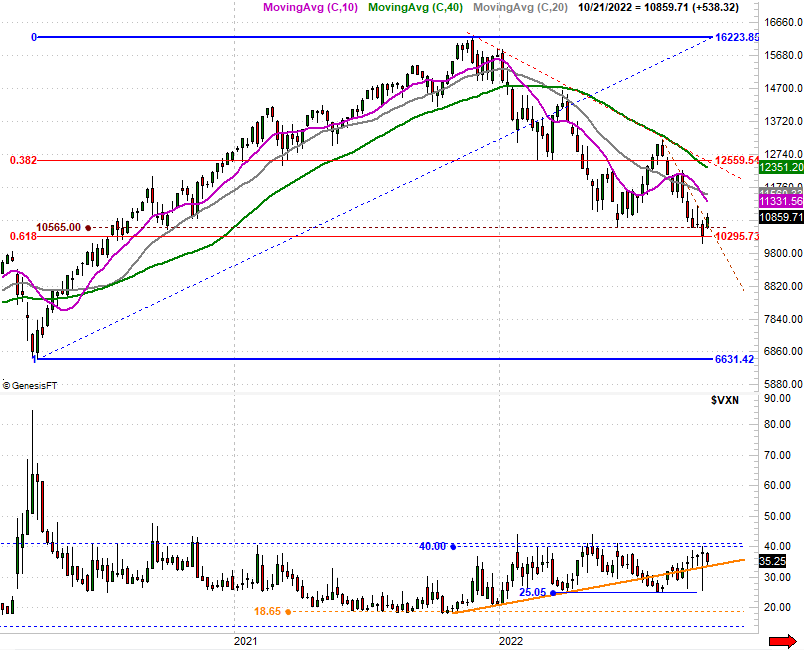
Here's the weekly chart of the NASDAQ Composite for a little more perspective, which shows us something that wasn't clear on the daily chart. Although the index briefly broke below this floor two weeks ago, there seems to be something about the 10,565 level…. the composite has found support there more than once. More than that though, notice how the low from two weeks ago only had to kiss the 61.8% Fibonacci retracement line at 10,296 to start a rebound move. If there was any "best" level the index was going to make a recovery effort, this is where it would be.
NASDAQ Composite Weekly Chart, with VXN
[8]
Source: TradeNavigator
This still isn't the ideal reversal effort though, for a couple of reasons. Chief among them is the way the NASDAQ's Volatility Index (VXN) hasn't yet made a sharp, pointed thrust that typically indicates a capitulation. On the other hand, the VXN did bump into a ceiling around 40 that has coincided with at least some minor market bottoms this year.
Translation: Friday's bounce may well be the very beginning of the new bullish swing it looks like. Nevertheless, we're only cautiously bullish. This market has dished out plenty of headfakes in just the past few months. The indices will need to move back above their respective 200-day moving average lines to really convince us the bear market is over. They're marked in green on the charts above.