 [1]A week ago the overbought market was on the verge of a decided, even if most devastating, breakdown. Once again though, investors found just the inspiration they were looking for. The S&P 500 rallied 1.65% over the course of the prior five trading days to end the week at a new record-high close of 3025.86.
The market's still overbought, and as such, is still ripe for a correction. It's especially ripe for a correction given the time of year. But, as long as traders carry on with their 'buy today on bullish headlines' mindset, traders aren't going to let that happen…. until they do.
It will all be weighed and measured below, as always, after looking at last week's major economic news and previewing what's in the cards this week.
Economic Data Analysis
It wasn't an overly busy week, but most of the data we got was hard-hitting.
Case in point? We got a major look at the state of the housing and real estate market. More mediocrity. The FHFA Housing Price Index indicated home values only improved by 0.1% month-to-month, missing estimates for a 0.4% improvement in May. You'll recall from two weeks ago that the Case-Shiller Index also appears to say home value growth is slowing. May's Case-Shiller Index update, by the way, will be reported this week.
Home Price Index Charts
 [2]
[2]
Source: Thomson Reuters
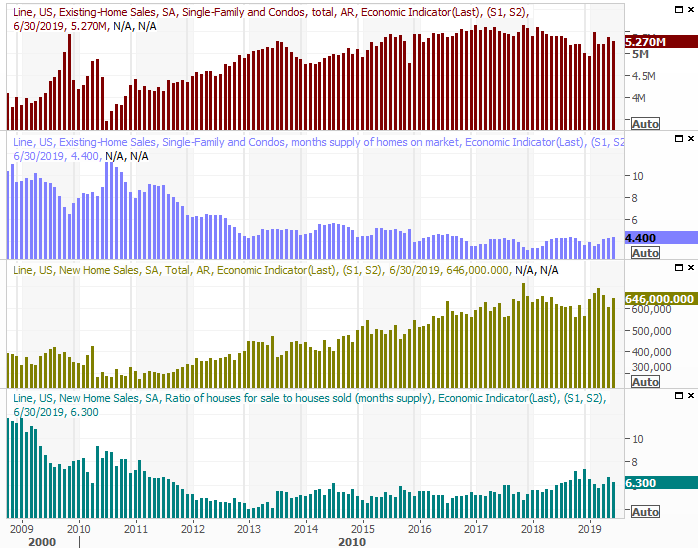
Sales of existing homes fell last month, though only just a bit. New-home sales picked up, though fell a bit short of estimates. Still, the bigger-picture trend seems to be one of improvement. Also note that purchases are growing in step with more inventory; inventories aren't growing due to a lack of buying.
New, Existing Home Sales Charts
 [3]
[3]
Source: Thomson Reuters
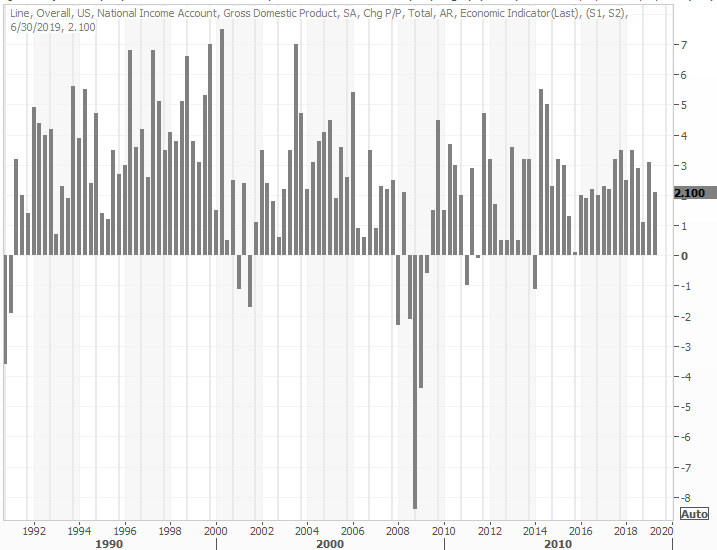
The big news of course was also a bit of a jaw-dropper. The initial calculation of the second quarter's GDP growth rate was a reasonably healthy 2.1%, versus expectations of only 1.8%. It's a sign that the impact of the tariffs isn't as tremendous as it's been assumed to be.
GDP Growth Rate Charts
 [4]
[4]
Source: Thomson Reuters
It can still be altered, though it's unlikely any future adjustments will be dramatic ones.
Everything else is on the grid.
Economic Calendar
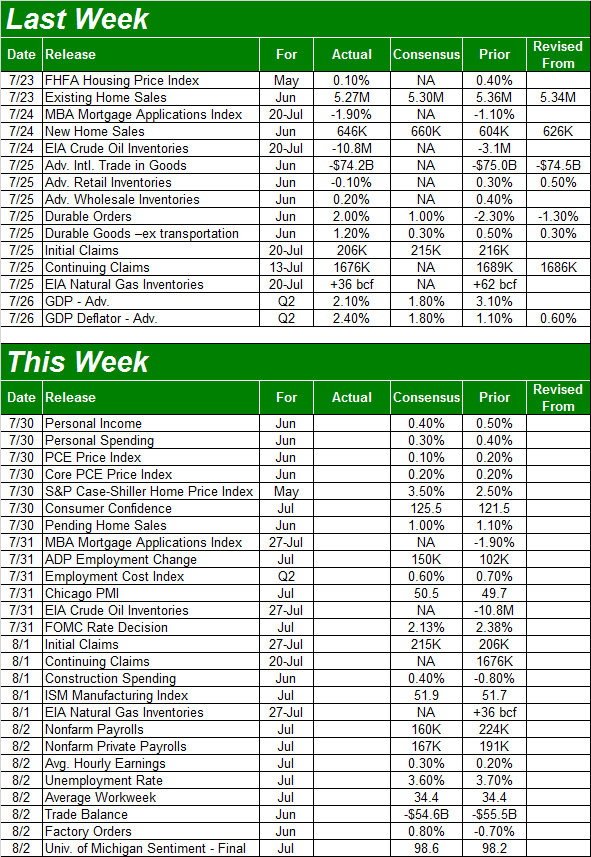 [5]
[5]
Source: Briefing.com
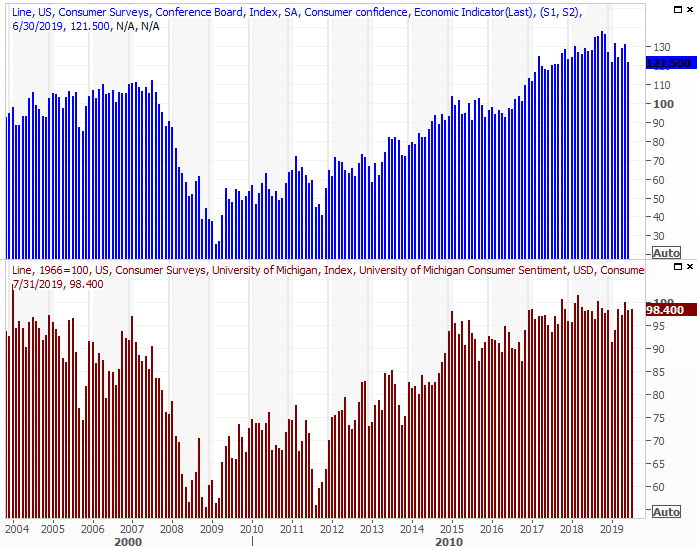
This week is going to be busier, culminating in a look at the jobs report for July. There are several noteworthy announcements scheduled in the meantime though, beginning with the Conference Board's look at consumer confidence on Tuesday. The pros are looking for a sizeable improvement on June's reading, which extending a spat of weakness seen since late last year. That's a win the wobbly economy needs right now.
Consumer Sentiment Charts
 [6]
[6]
Source: Thomson Reuters
We'll get the third and final look at the Michigan sentiment index on Friday, which should only be slightly higher than June's level. The Michigan sentiment measure has been stagnant for months, and could use a revival. Tepidness slowly grinds against the economy.
On Wednesday, we'll hear the Fed's decision on interest rate. The odds are strongly suggesting a quarter-point decrease is in the cards, though last week's GDP growth casts a shadow of doubt on the need for a rate cut. Also bear in mind that June's inflation reading were up, not frighteningly so, but enough that should prompt the FOMC to be concerned that cheaper money could nudge inflation decidedly higher when we don't want that to happen. Whatever the case, the CME's FedWatch data says there's a near-100% chance of a rate cut of some degree, with most futures-based bets saying a quarter-point cut is what we'll get.
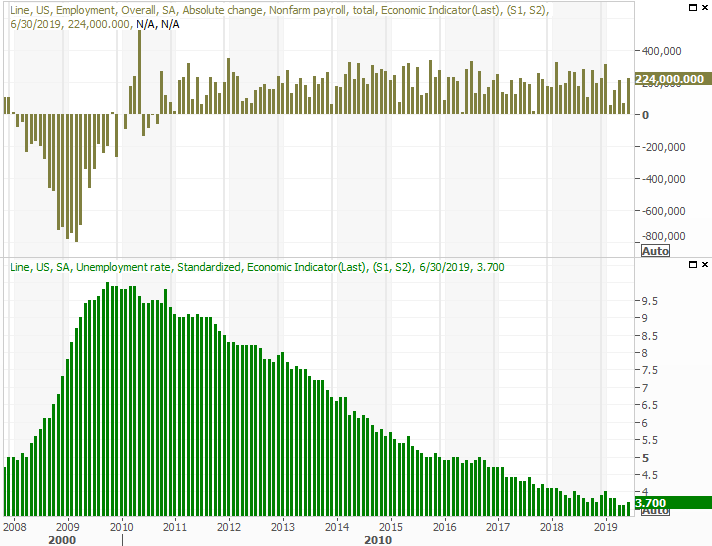
Finally, on Friday the Department of Labor will give us a look at June's job growth. Economists think the 160,000 new jobs likely created last month will drive the unemployment rate down from 3.7% to 3.6%. But, those best-guesses are difficult to make simply because the economy has been so good.
Unemployment Rate, Payroll Growth Charts
 [7]
[7]
Source: Thomson Reuters
Whatever's in the cards, it's sure to be a well-watched report that moves the market. As usual, we'll have a deeper look at all the data posted later that day at the website.
Stock Market Index Analysis
It's amazing, but the market find a way to sidestep what looked to be an inevitable correction a week ago to push its way to another record high. Last week's 1.65% advance translates into a 10% gain in just the past eight weeks, and the S&P 500 is now up nearly 29% from its late-2018 low. Granted, it started that run out deep in the hole, but still…. an amazingly big advance in just seven months' time.
Like last week, the move leaves the broad market overbought and quite ripe for a pullback, particularly at a time of year when stocks don't perform all that well. Investors have remained in a buying mood for as long as they've been strung along by the Fed's "we'll do something soon" message in addition the "the tariff war will end soon" backdrop. Neither has happened yet, but that's not impeded any buying.
Now, both events are actually within reach. The market's betting on a quarter-point rate cut later this week that the FOMC has all but assured us it will be dishing out.
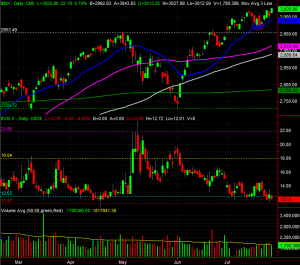
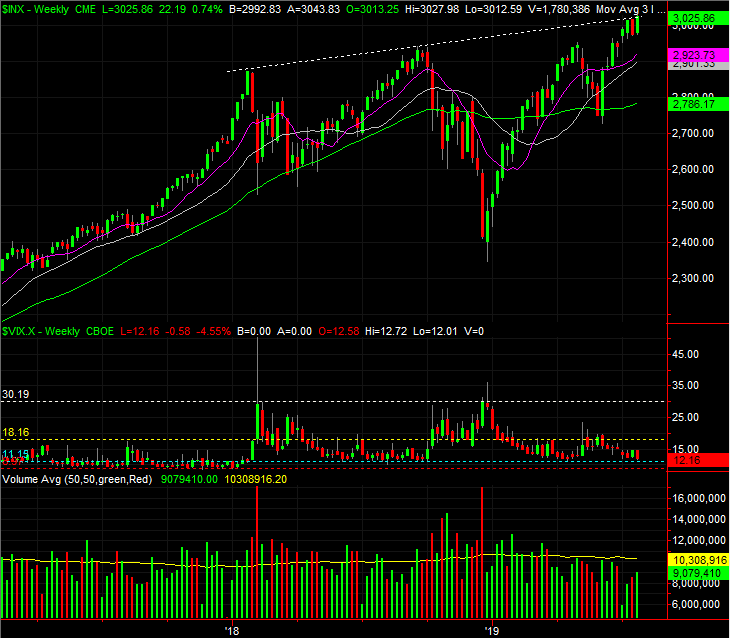
The weekly chart of the S&P 500 puts it all in perspective.
S&P 500 Weekly Chart
 [8]
[8]
Source: TradeStation
The weekly chart, however, also highlights a problem for the rally we mentioned earlier in the month – even with the recent strength, the S&P 500 is struggling with a technical resistance line that extends all the way back to the early-2018 peak. The same weekly chart also shows the VIX is hovering near absolute lows, which often occurs at major market highs.
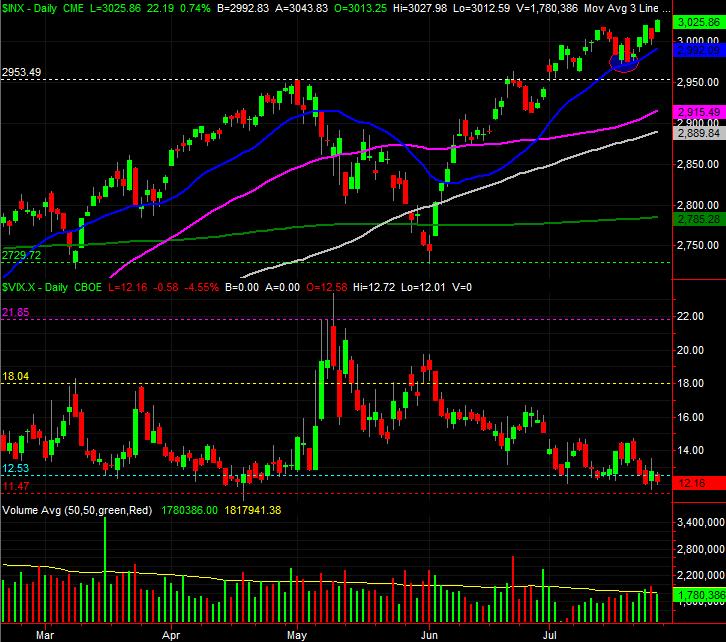
Zooming into a daily chart we can see the simplest of explanations for last week's surprise reversal. All it took was a kiss of the 20-day moving average line (blue) to rekindle the rally that's been in place since early June.
S&P 500 Daily Chart, with VIX, Volume
 [9]
[9]
Source: TradeStation
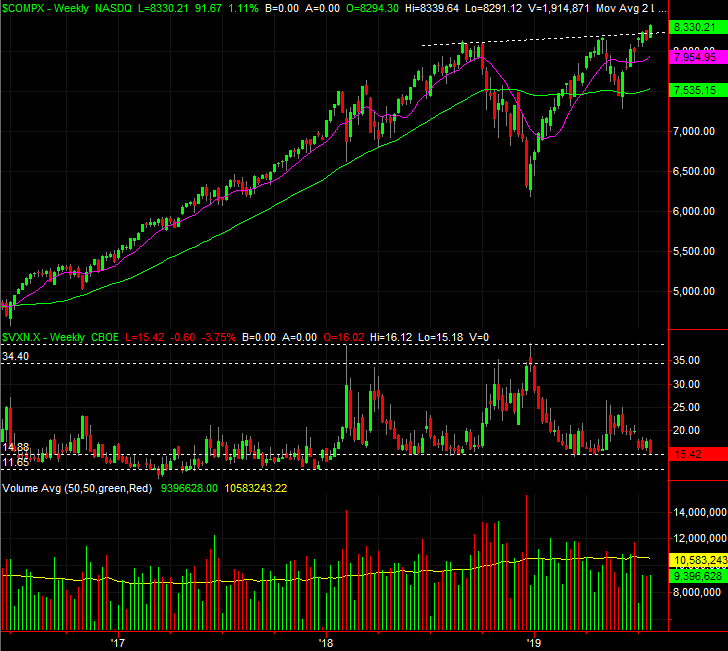
The same basic facts apply to the NASDAQ Composite's chart, though with one key exception. As the weekly chart of the composite shows, it was able to push through the resistance line the S&P 500 couldn't. Also note that the NASDAQ's volatility index, the VXN, is pressing into an even-better established horizontal floor just under 15.0. There's not a whole lot of room left for more upside, even if stocks manage to squeeze out a little more bullishness.
NASDAQ Composite Weekly Chart, with VXN, Volume
 [10]
[10]
Source: TradeStation
Or, perhaps there is. Though traders have already priced in the impact of a rate cut, they may well price one in again once (or if) they actually get it.
And for the record, the S&P 500 is now 8.6% above its 200-day moving average line. That's above the average maximum divergence we've historically seen between the index and its long-term moving average.
The momentum is admittedly impressive, but difficult to trust here. It's rare that it last this long. One can't also help but wonder is the widely-expected rate cut will turn into a 'sell the news' situation.
Whatever's in the cards, any pullback will have to break under the 20-day moving average line at 2992 is it's to have any credibility. It will have to fall under the 2900 area, where a couple of other key moving averages currently lie, to say it could even have a shot at turning into a full-blown correction. That situation would also have to include the VIX breaking above a ceiling around 18.0 before any new bearish assumptions can even start to be entertained.