
If you think the bears swipe at the rally has run its course because of Friday's partial intraday bounceback, think again. The sheer scope and depth of Thursday's and Friday's plunge set up some buying, as there are still plenty of traders out there that seriously think stocks can never fell in earnest again [there’s always that crowd out there]. They're the drivers of the reversal effort, but it remains to be seen if they've got anything left for a follow-through effort this week.
The good and bad news is, it shouldn't take much to figure out if the bears are serious about causing the usual September setback. Friday's low are right in line with all the key lows since April's bottom, and with Friday's modest turnaround later in the day, that technical floor is still easily within reach.
We'll take a closer look that matter below, as always. First though, let's recap last week's big economic announcements and preview what's in store for this week. Last month's employment report was the biggie.
Economic Data Analysis
The overall economy may be recovering faster and better than expected. The ISM data (though not just the ISM data) from last month suggests as much. The manufacturing version of the index grew more than expected, reaching a multi-month high of 56.0. The services index actually fell a little, but at 56.9 is still stands well above the pivotal 50 level that delineates strength and weakness.
ISM Manufacturing, Services Index Charts
 [1]
[1]
Source: Institute for Supply Management, TradeStation
Automobile sales also continue to improve, hitting an annualized pace of 15.58 million in August. Logistics – the difficulty of getting out to car lots as well as a somewhat limited supply – remains the bottleneck, to the extent there is one. Regardless, it's encouraging to see that consumers are willing and able to make these purchases, even if low interest rates are the big driver.
Auto Sales Chart
 [2]
[2]
Source: St. Louis Federal Reserve, TradeStation
Of course, last week's big Kahuna was the Department of Labor's jobs report. The DOL reported payroll growth of 1.37 million jobs, falling short of expectations and slipping from the prior month's growth of 1.734 million jobs. But, the unemployment rate fell to 8.4%, down from 10.2% and well below expectations of 9.8%. The disparity may be partially rooted in changes to how this data is calculated, though it could also reflect the fact that things are to such extremes and moving so quickly now that it's difficult to measure any of it. Whatever the case, not nearly as many people are unhappily unemployed as have been presumed.
Unemployment Rate, Payroll Growth Charts
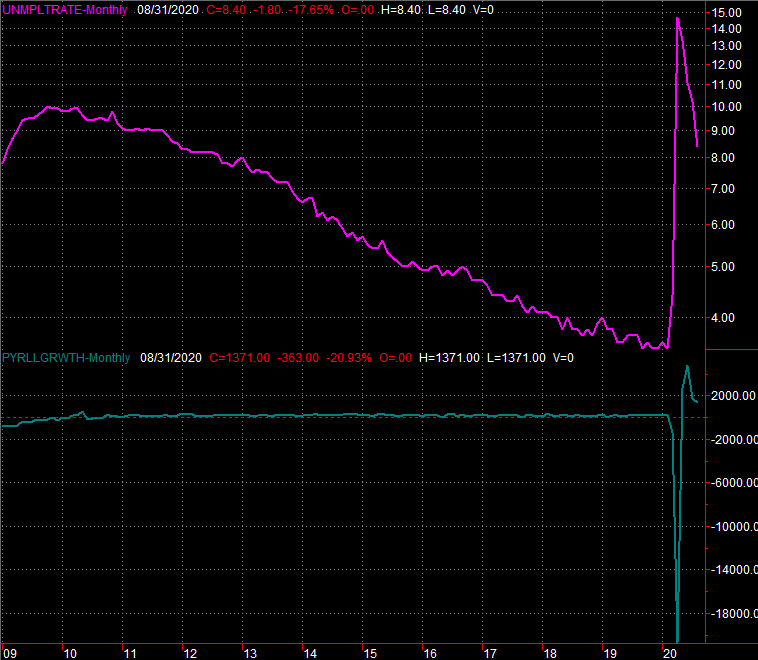 [3]
[3]
Source: Department of Labor, TradeStation
Everything else is on the grid.
Economic Calendar
 [4]
[4]
Source: Briefing.com
This week won't be nearly as busy. In fact, the only items of interest will be the inflation reports. Producer inflation is due on Thursday, with consumer inflation figures due on Friday. In short, look for tepid inflation to be further tamed… on both fronts. July's firm (though metered) price increases will slow somewhat in August, and for the best. A little inflation shows solid consumerism. A lot of inflation shows an economy that's spiraling out of control.
Inflation Charts (Consumer Core and Non-Core, Producer Non-Core, Annualized)
 [5]
[5]
Source: Bureau of Labor Statistics, TradeStation
As is stands right now, the annualized consumer inflation rate stands at 1.0%, or 1.6% when not counting food and fuel prices.
Stock Market Index Analysis
It should come as no surprise the market ended last week on the fence, so to speak. That's what the market is designed to do… to confuse as many people as much of the time as possible (to "keep them honest").
This is readily evident with just a quick glance at the daily chart of the S&P 500. It tumbled below a key support line (orange) on Friday, but thanks to a partial recovery the index closed right at the 20-day moving average line (blue). That's a pivotal make-or-break line, and the S&P 500 closed neither above it or below it.
S&P 500 Daily Chart, with VIX and Volume
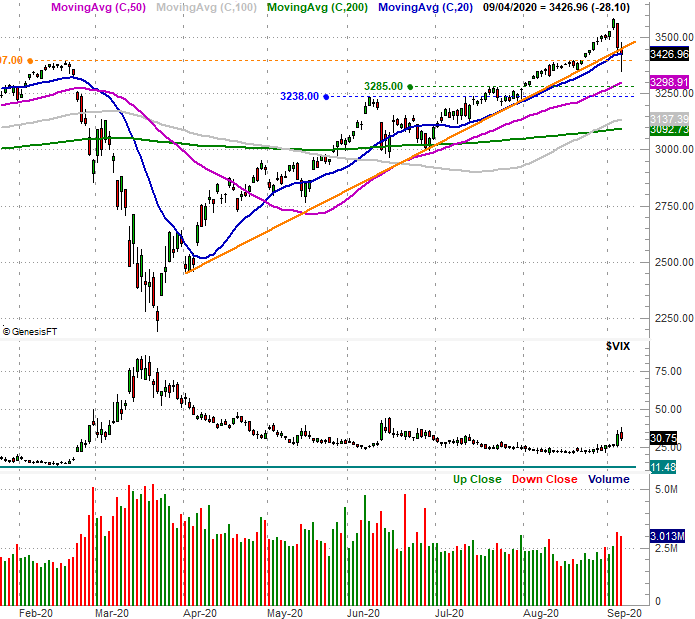 [6]
[6]
Source: TradeNavigator
This stuck-on-the-fence theme isn't unique to the S&P 500 though. The NASDAQ is showing us the same indecision. It's just showing it to us in a different way. In the case of the composite, it only had to touch the 50-day moving average line (purple) to begin its recovery effort. It briefly fell under the lower edge of a rising bullish channel that's been establishes since April (orange), but it didn't close below it.
NASDAQ Composite Daily Chart, with VXN, Up and Down Volume
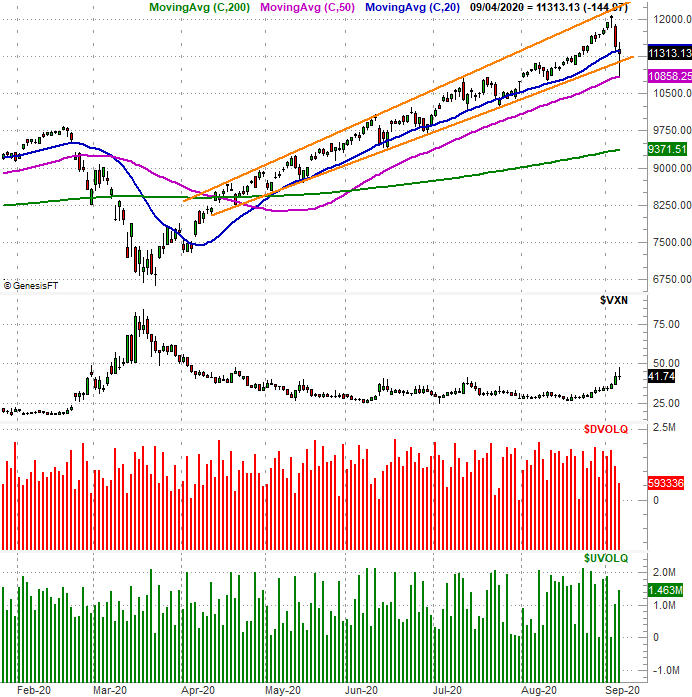 [7]
[7]
Source: TradeNavigator
This is encouraging for the bulls, even if not wildly convincing. When push came to shove right in front of the weekend – the most important point of the week (in front of a three-day weekend no less) – the buyers were trickling back in. It's not cause for a big celebration just yet, though, for a couple of nuanced reasons.
One of these reasons is a lack of volume behind Friday's plunge and subsequent rebound. It would have been better to see a volume surge behind the hammer-shaped buyer, as that would have suggested a washout of all the potential sellers followed by a sudden and sharp flood of new (and renewed) buyers. This suggests a "reset" of sorts for the bigger rally. We didn't get that. Maybe we don't need it, but if we did need it, we didn't get it.
The other nuanced red flag only becomes clear with a look at the weekly chart. We'll use the NASDAQ Composite's, although know that the S&P 500's weekly chart serves up the same warning. That is, last week's bar is an "outside day," although in this case it's technically an "outside week." By that, we just mean last week's open was (almost) above the prior week's high, and last week's close was below the previous week's low… and moving in the opposite direction. It's a huge reversal clue, showing a sweeping change of heart on behalf of traders. The fact that this has happened after a 70% rebound from March's low makes this red flag all the more telling.
NASDAQ Composite Weekly Chart, with VXN, RSI, and MACD
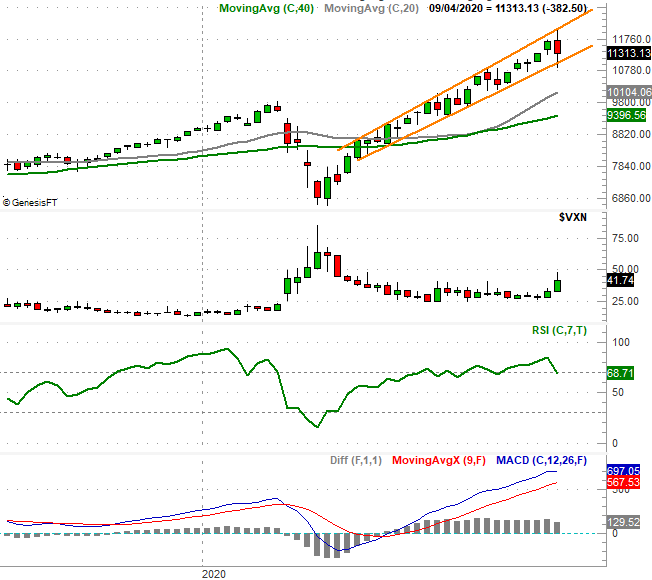 [8]
[8]
Source: TradeNavigator
Of course, the weekly chart of the NASDAQ Composite is also a reminder that while the index may be testing the entire span of its rising trading range (orange) that's been in place since April, those boundaries are still completely intact.
There's no need to add the chart here, but the Dow Jones Industrial is in the same shape as the NASDAQ and the S&P 500… on the fence, and finding support where it absolutely had to find support. Only this week will tell us if those floors are built to last. But, between the month we're in (September is historically the worst month of the year for stocks) and the fact that we've come so far so fast since March, it would be unwise to assume last week's corrective move was enough to set the stage for more of the same bullishness we've seen through August.
This week's key assignment is simply keeping an eye on the aforementioned technical floors. There's still a good chance they'll snap, opening the selling floodgates.