
A week ago we expressed concern that the market had rallied too far, too fast following the election of pro-business Donald Trump. Never even mind the fact that the S&P 500 also bumped into long-established straight-line resistance. Sure enough, the bears pushed back. The S&P 500 fell 3.6% last week, while the NASDAQ Composite lost 3.1% of its value.
And yet, the market’s anything but in trouble. Both of the indexes remain above the vast majority of their most important technical support lines. So, don’t panic yet. You may even want to plan on a little more profit-taking, in fact.
We’ll show you all of it in a moment. Let’s first explore last week’s top economic reports and take a look at what’s coming this week.
Economic Data Analysis
Last week’s big news was of course October’s inflation figures. There’s still plenty of it. In fact, there’s just as much of it now as there has been for the past few months. In fact, although it’s still more or less in line with the Federal Reserve’s long-term targets, producer as well as consumer inflation both edged a little higher last month.
Consumer, Producer Inflation Rate (Annualized) Charts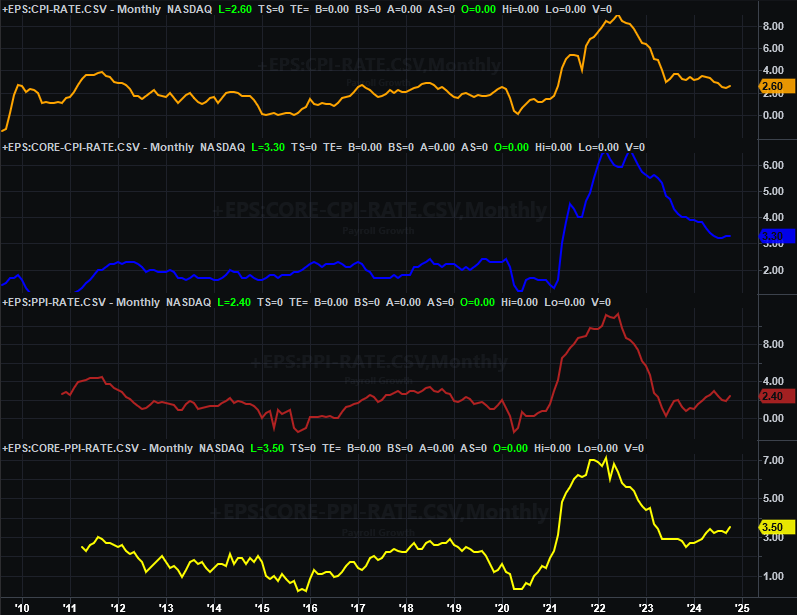
Source: Bureau of Labor Statistics, TradeStation
The market was counting on the FOMC sticking to its plans to inch rates lower from here for a couple of years. Jerome Powell suggested last week, however, that the Fed isn’t necessarily in a hurry to do so. That makes sense given the modest inflationary hint we saw materialize last month. The FOMC doesn’t have much wiggle room here.
Despite modest inflation growth, consumers aren’t deterred… or maybe they’re just being forced to spend more on goods and services they have to have. Last month’s retail sales also ticked a little higher (all stratifications).
Retail Sales Charts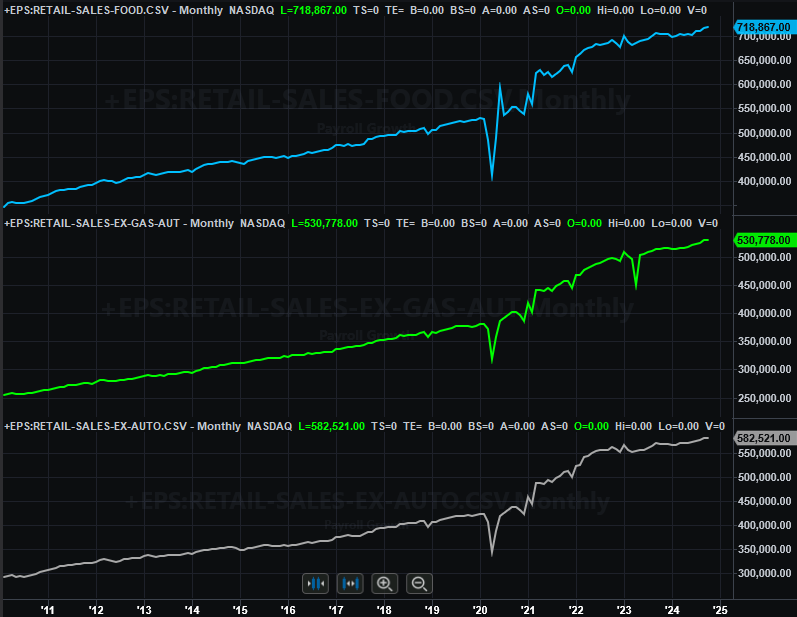
Source: Census Bureau, TradeStation
Sales growth did slow down a bit, but it’s encouraging to see at least a little resilience on the consumerism front. (Also remember that consumer confidence edged measurably higher last month, so consumers are indeed feeling and sensing some strength here.)
Finally, as most other manufacturing data has suggested, the Federal Reserve’s manufacturing barometer along with its capacity utilization score both slumped last month, with actual capacity usage sliding to a multi-month low. As the chart below shows, the nation’s factories are indeed slowing down.
Capacity Utilization and Industrial Productivity Charts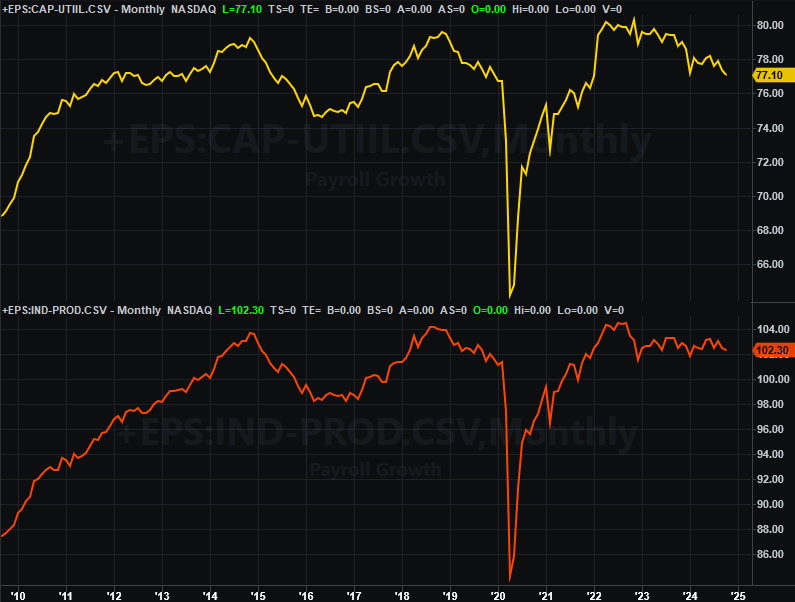
Source: Federal Reserve, TradeStation
This is problematic simply because there’s such a strong correlation between this data and corporate earnings and — ultimately — the long-term stock market itself.
Everything else is on the grid.
Economic Calendar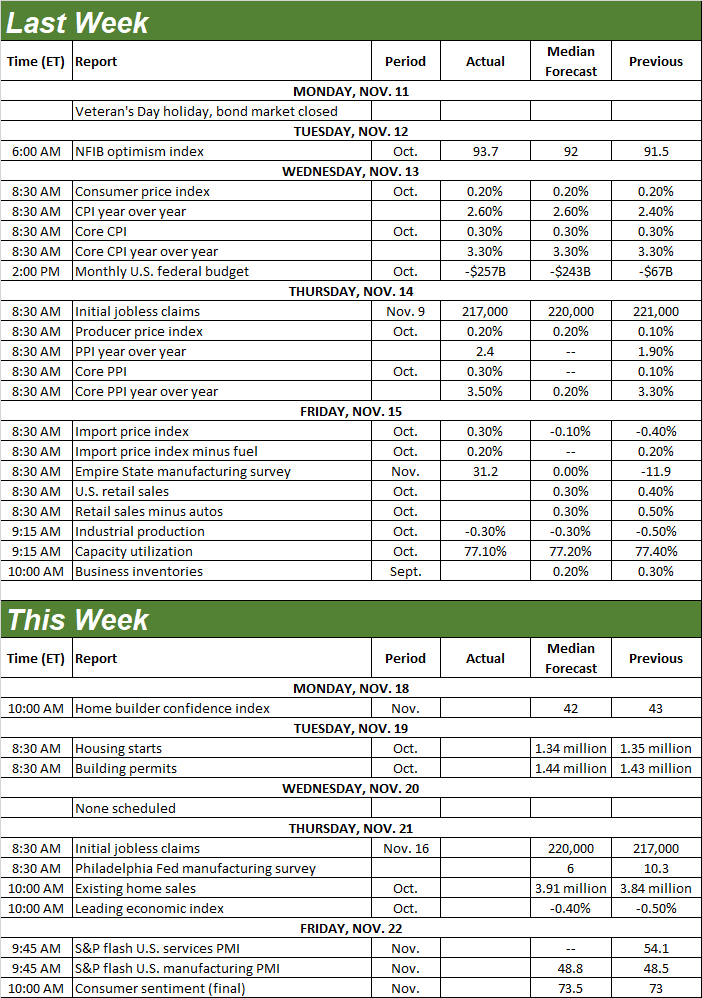
Source: Briefing.com
This week’s got a few items worth watching, particularly on the real estate front. For instance, on Monday we’ll hear about homebuilder’s confidence. The real estate information we’re really interested in, however, is Tuesday’s housing starts and building permits. You might recall the market’s struggled to shrug off 2022’s setback, weighed down by high housing (and materials) costs. Don’t look for any measurable or meaningful progress this time around.
Housing Starts and Building Permits Charts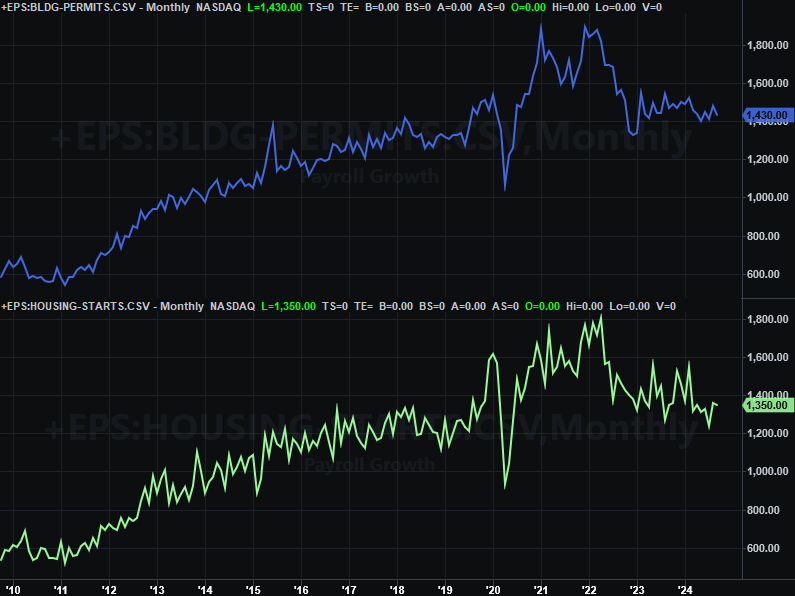
Source: Census Bureau, TradeStation
Existing home sales for October will be posted on Thursday. As the chart below shows, they’ve been falling as current homeowners have opted to stick with their low-interest loans.
New, Existing Home Sales Charts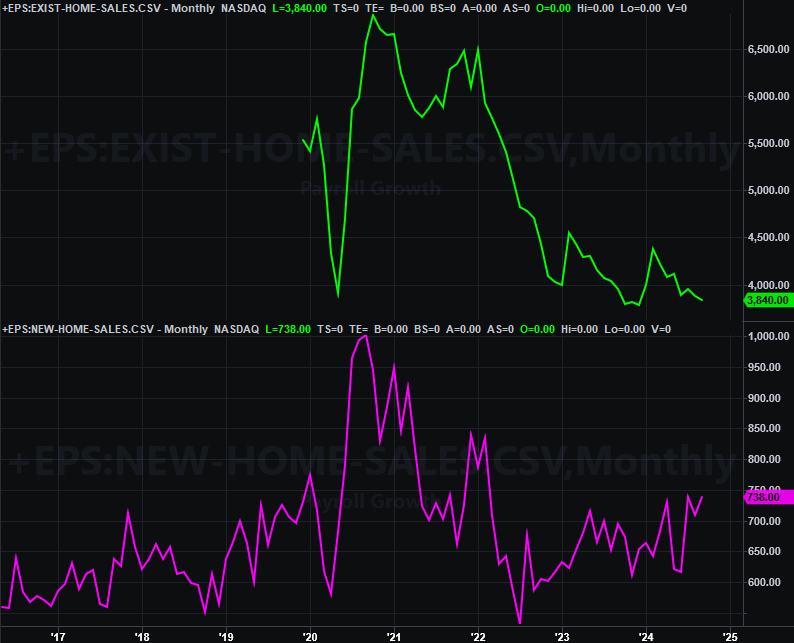
Source: Census Bureau, TradeStation
Last month’s sales of newly-built houses will be posted in the coming week. As you see above, while sales of existing homes are fading, this weakness is at being at least partially offset by growing sales of new homes (despite their inordinately high costs).
Note that we’ll be getting October’s third and final look at the University of Michigan’s sentiment index on Friday. We’ll wait until next week to dig into — and chart — this data though, as the Conference Board’s consumer confidence score will be posted the following week.
Stock Market Index Analysis
No real surprises… the market jumped two weeks ago, inviting a bit of profit-taking pressure. Indeed, the pullback was more likely than not.
Take a look at the weekly chart of the S&P 500 below. The post-election rally two weeks back was halted right at the line (light blue, dashed) connecting several key highs going back to last August’s peak. The bulls tested that resistance line one more time early last week before giving up 3.6% of its value.
S&P 500 Weekly Chart, with VIX and MACD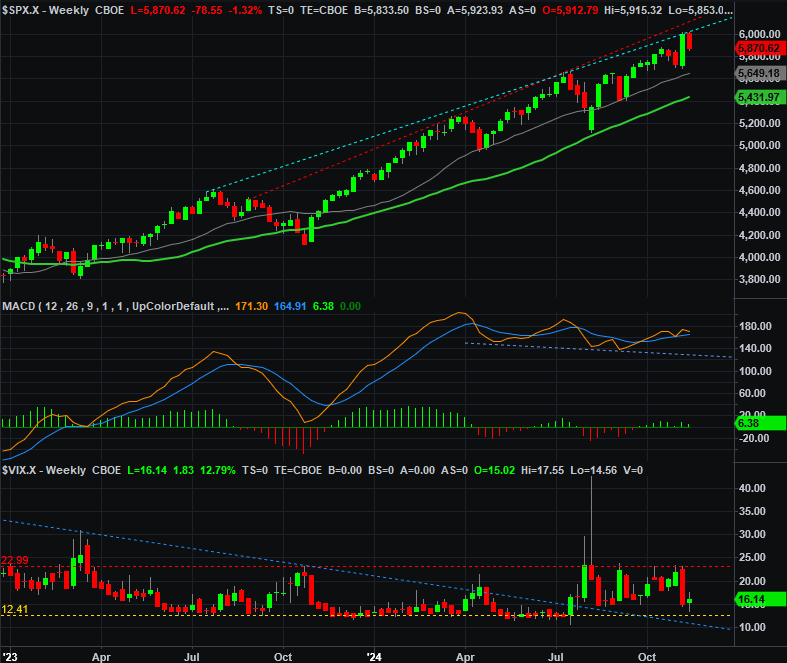
Source: TradeNavigator
The weekly chart above also makes another clear point… there’s still plenty of room for the index to lose more ground before any serious damage is done. The 100-day moving average line (gray) at 5,639 is the first of these prospective floors, although the 200-day line (green) at 5,411 is an ultimate support level. A trip all the way back to that mark would only be a 9% correction, which is a completely-normal (and not-problematic) correction.
Here’s the daily chart of the S&P 500 for a little more detail. Note that the index even found some support at the 20-day moving average line (blue) on Friday. On the flipside, also note that the volatility index (VIX) seems to have found straight-line support at 14 (yellow, dashed), and finally pushed up and off that support a little bit on Friday. Even so, it’s not like the VIX is super-telling just yet.
S&P 500 Daily Chart, with VIX and Volume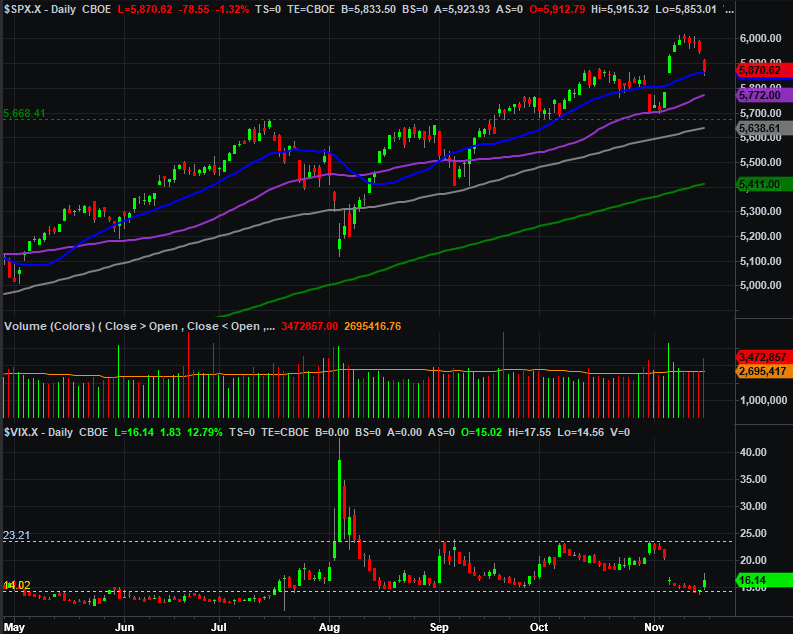
Source: TradeNavigator
Here’s the weekly chart of the NASDAQ Composite, which only fell 3.1% last week (although it did reach a new record high of its own). There’s nothing particularly new or different here, but do take note of the fact that the composite is well framed by several rising support and resistance lines creating a bullish “zone” of sorts going all the way back to early last year.
NASDAQ Composite Weekly Chart, with VIX and MACD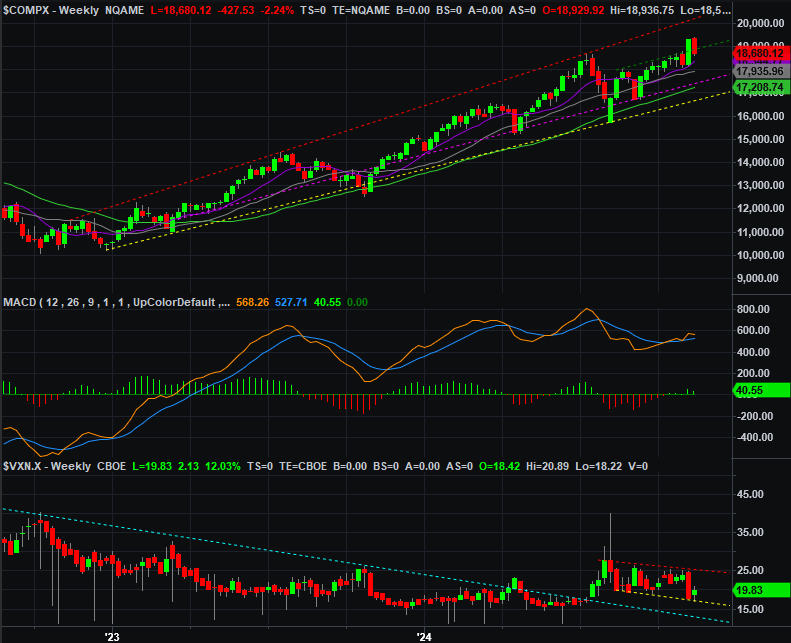
Source: TradeNavigator
There’s no need or benefit in showing you the daily chart of the NASDAQ Composite this week. It launched last week, and settled this week, wrecking most chart-based analysis. We’re mostly just guessing from here, trying to figure out when and where the dust will settle and traders will regroup.
To the extent one can get a read on what’s next from here, however, we’re looking for a bit more downside before the selling finally cools off. There’s still some bullish euphoria that needs to be burned off. A slide back to the 100-day moving average lines should do the trick. It’s still anyone’s guess what happens after that. So, don’t force anything just yet.