Last week was a loser — a big one, in fact. But, in some ways the depth of the intraweek loss just might have served as a capitulation. Stocks are still ultimately beholden to coronavirus rhetoric, which could turn any number of directions from here. But, the strong rebound after President Trump's unsurprising decision on Friday makes clear there's still a good-sized crowd that's ready and willing to dish out rallies. The question is, will they stay in the fight when they going gets tough.
We'll look at last week's reversal-oriented clues below. First, however, let's recap last week's biggest economic reports and preview what's in the cards this week… including a key decision regarding interest rates.
Economic Data Analysis
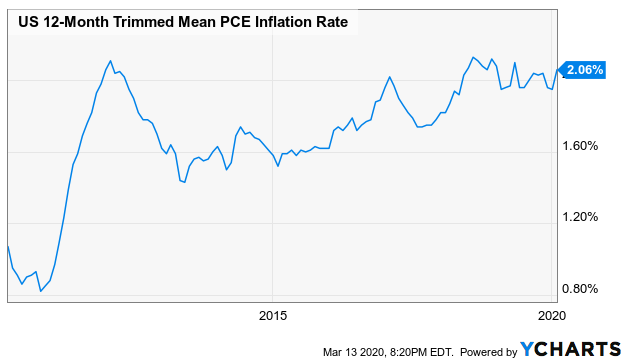
If there was any concern about inflation racing out of control, it was quelled last week. Consumer inflation came in about as tepidly as expected, and the annualized CPI rate now stands at a very palatable 2.06%. Meanwhile, producer inflation fell even more dramatically than expected following January's surprising surge. In fact, factories and assembly plants saw prices outright drop last month. It's difficult to say if that was in the cards, or purely the result of coronavirus worries, but it was likely a mix of both.
Consumer Inflation Rate Chart
 [1]
[1]
Source: YCharts
Speaking of coronavirus, it took a bite out of consumer sentiment early this month. The first (of three) readings of consumer confidence from the University of Michigan last week showed a sizeable drop, from 101.0 to 95.9. That's still a strong reading, but a step in the direction investors would prefer to avoid.
Michigan Sentiment Index Chart
 [2]
[2]
Source: YCharts
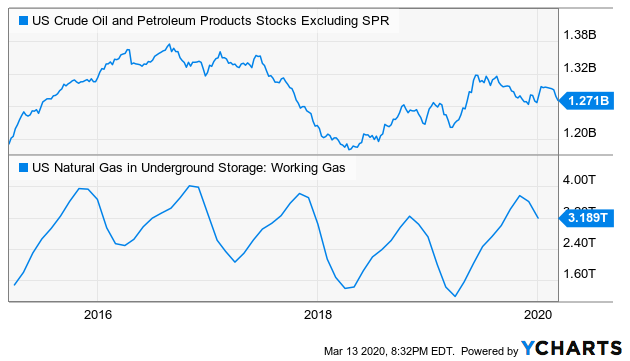
Finally, it's been a while since we looked at the data, just because there wasn't much point. There's a point now though, given the rout crude oil prices have suffered in just the past three weeks. U.S. stockpiles have renewed their downtrend, accelerating it starting to weeks ago. That will help buoy prices, though it won't do so quickly enough to suit some.
Crude Oil, Natural Gas Inventory Charts
 [3]
[3]
Source: YCharts
Everything else is on the grid.
Economic Calendar
 [4]
[4]
Source: Briefing.com
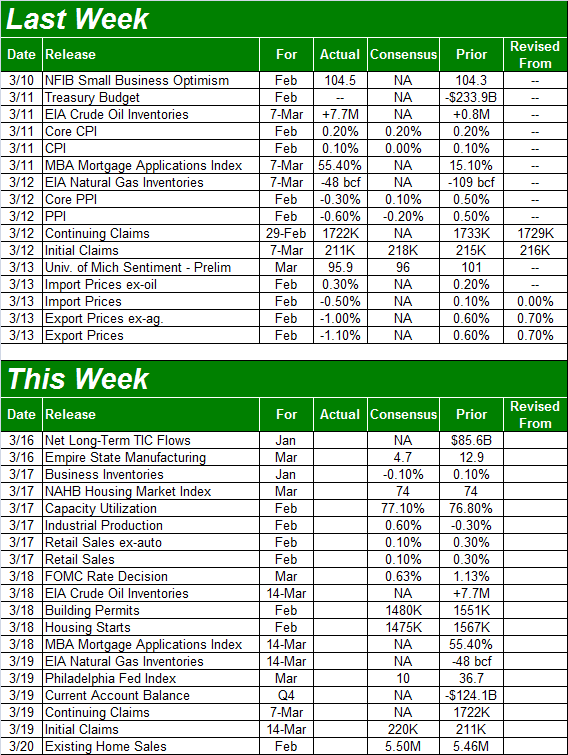
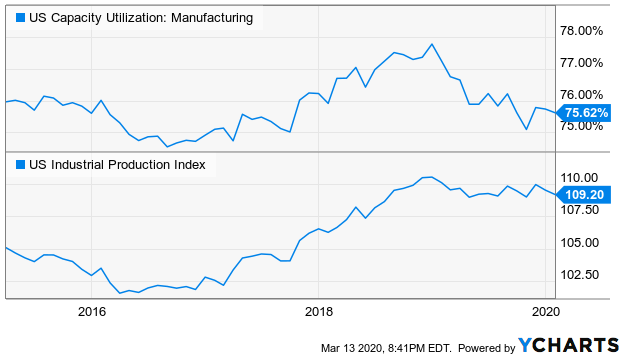
This week is going to be a fairly busy one, with a couple of key real estate reports in the pipeline. Before we get to either of them though, we're going to get last month's capacity utilization and industrial productivity figures on Wednesday. It will be interesting to see if the coronavirus contagion took a toll, but analysts don't think it did. They're calling for sizeable improvements after January's letdown. On the other hand, the COVID-19 headache didn't really start until this month.
Capacity Utilization, Industrial Production Charts
 [5]
[5]
Source: YCharts
One thing is clear. That is, if last month's capacity utilization and productivity were lower than January and we're headed into the coronavirus slowdown already losing ground, that is a concern… particularly for industrial names.
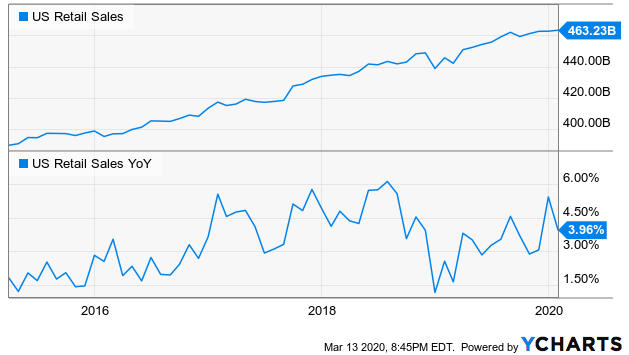
Also on Wednesday we'll hear about last month's retail sales. Same story. That is, analysts are looking for a little growth, but if we don't get any, it could spook investors.
Retail Sales, Retail Sales Growth Charts
 [6]
[6]
Source: YCharts
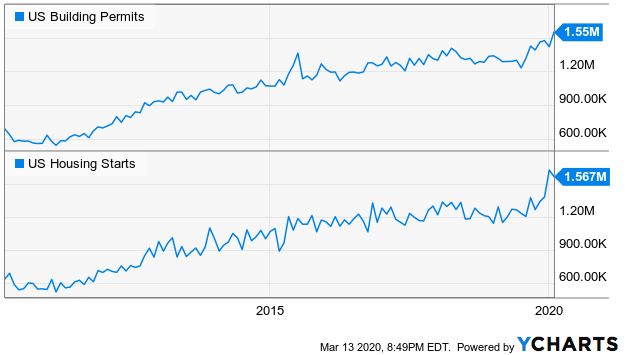
On Thursday look for February's building permits and housing starts reports. Economists are calling for a contraction, but that's a contraction from unusually strong numbers. Interest rates have actually edged a little higher over the past few days, but that wouldn't have slowed down last month's construction planning.
Building Permits, Housing Starts Charts
 [7]
[7]
Source: YCharts
Just bear in mind that we're also getting word on interest rates from the Fed on Thursday… a regularly scheduled meeting to change the Fed Funds Rate, if necessary. The FOMC just cut rates by 50 basis points a few days ago, with an unscheduled, emergency move. There may be little purpose or room to do so again. As always though, the rhetoric and wording can be as important as the number.
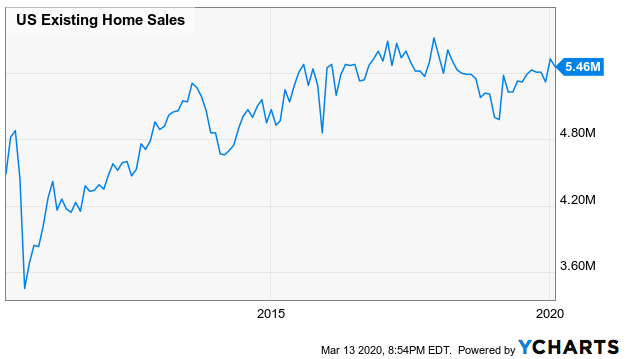
Finally (and as if traders won't be exhausted by this point), we'll get February's existing home sales figure on Friday. The pros are looking for a slight increase, sustaining what's been the economy's one reliable bright spot.
New Home Sales Chart
 [8]
[8]
Source: YCharts
Stock Market Index Analysis
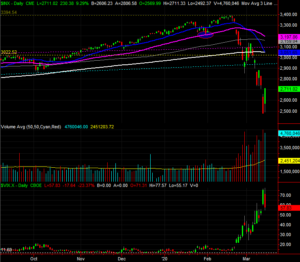
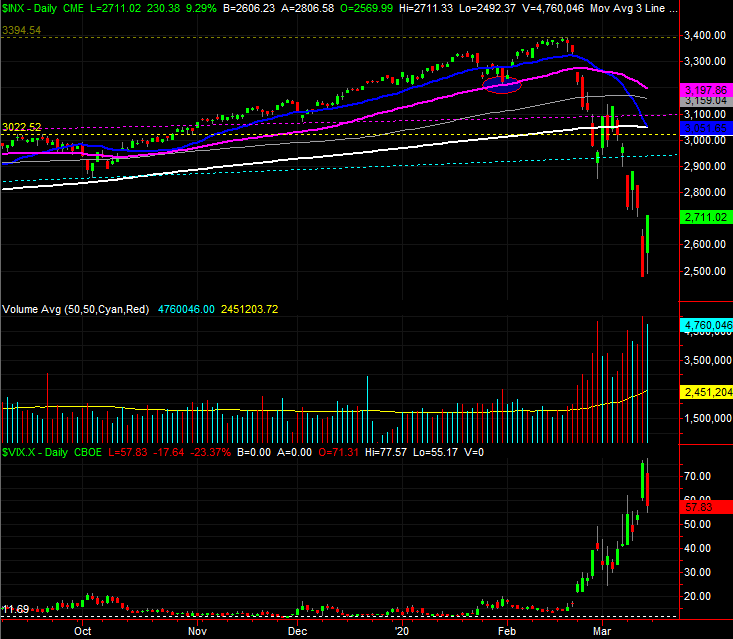
Exhausted yet? It would be surprising if you weren't. The S&P 500 lost another 8.8% last week, but it was hardly a straight line move. At one point on Thursday the index was off to the tune of 16.5%, translating into a pullback of almost 27% from February's peak. That's a bear market, and then some. The daily chart of the S&P 500 puts it all in perspective. Wow.
S&P 500 Daily Chart, with VIX and Volume
 [9]
[9]
Source: TradeStation
The coronavirus craze has taken the market completely off the rails, so to speak, for better or worse. The 'better' is arguably the fact that stocks needed a good correction, and got one… the hard way. The 'worse' is, the market's correction could convince consumers that a recession is inevitably, forcing them to (proverbially) hunker down, causing the very recession they fear. That, of course, will put stocks into another leg of downward spiral.
That's hardly a foregone conclusion though. The sheer severity of the selling suffered over the past three weeks may have jolted the market, the economy, and even society into action. The Fed opened the spigots two weeks ago, and last week the President declared an emergency. Not only does that release funds to combat the coronavirus, it starts the process of bringing the outbreak to a quick close. Thursday's and Friday's huge swing reflects the jolt.
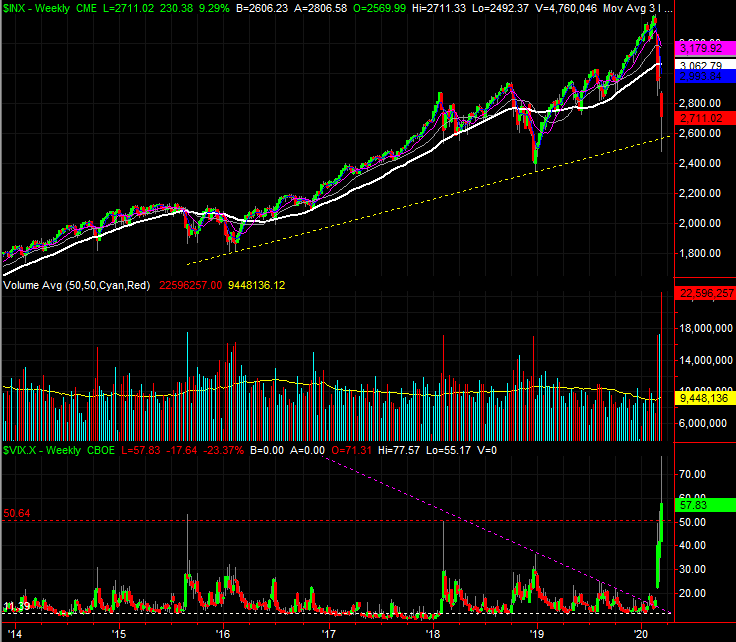
Zooming out to a weekly chart bolsters the argument that last week's jolt was indeed a capitulation of sorts, for a couple of reasons.
One of them is, the selloff dragged the S&P 500 back down to a technical support line (yellow, dashed) that connects the lows from 2015 and late-2018. Within the confines of that technical channel, the correction thus far may serve as an adequate "reset" of the longer-term rally. The other big clue is, the VIX popped to levels not seen in years, suggesting fear has peaked… peaked as in anybody who wanted to play defense and get out of the market has already done so. There aren't many/any willing sellers left behind.
S&P 500 Weekly Chart, with VIX and Volume
 [10]
[10]
Source: TradeStation
Underscoring the theory that the last of the prospective sellers have been flushed out is last week's volume surge. Those volume spikes are also often seen at major pivot points for the market.
Zooming out to an even longer-term weekly chart helps, and hurts, the bullish argument. It helps to see that — with the exception of 2008's subprime mortgage meltdown — the VIX has indeed moved about as high as it can before a bottom is made. It's also noteworthy that last week's low that touched a major support line touched the support line that's guided the bull market since its inception back in 2009.
S&P 500 Long-Term Weekly Chart, with VIX
 [11]
[11]
Source: TradeStation
The recent action hurts, however, in the sense that the selloff happened so fast and the backdrop is so scary, investors don't know what to think. Most bear market's start slow and are surprisingly gradual meltdowns. Most also start unexpectedly. None of those characteristics apply here, which may well be the reason we shouldn't count on a recession here. That, and the facts that earnings are still growing and inflation rates are well in check.
This week is going to be an interesting one. Ironically, the one thing we don't want to see is massive, sweeping bullishness that only leads to another wave of profit-taking. A slower recovery effort that's kept tempered by a healthy degree of doubt would actually be better for traders counting on the possibility that last week was the capitulation.
The one thing we know for sure is, it's still all about the coronavirus outbreak. A bunch of analysts fear its effects will linger and cause a recession, meaning stocks have yet to hit their ultimate bottom.