Record unemployment? Let's celebrate! That was the response to Friday's jobs numbers, with the S&P 500 rallying nearly 1.6% to cap off a week that looked — in retrospect — predestined to log a big gain no matter what. Traders were just looking for justification. Friday's headlines somehow were enough.
It's not quite ideal. In some ways the indices blew past technical ceilings that had been holding them back. In other ways they failed to do so. Things could still go either. On balance though, the bulls have proven themselves more convicted than the bears have. You may not want to fight the tape, so to speak.
We'll look at what's right and what's wrong with the market below. First, let's recap last week's major economic announcements and preview what's in store for this week.
Economic Data Analysis
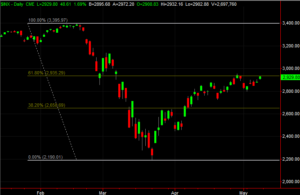
There's no sense in ignoring or even waiting on the 800 pound gorilla in the room. Last month's employment figures were horrible. The nation's unemployment rate now stands at 14.7%…. a record move. That was better than expected (as in lower than forecasted), though bear in mind there's no accurate measure of joblessness right now. The market didn't rally so much on the number as it did on the continued realization that the COVID contagion is being tamed, and we'll be back to normal relatively soon. All told, the nation lost 19.5 million jobs last month. Don't get too rattled by it, as it's all changing very rapidly.
Unemployment Rate and Payroll Growth Charts
 [1]
[1]
Source: YCharts
There were other economic reports posted last week too. For instance, the ISM Services Index came in at 41.8 for April, which was a little better than expected. Still, both it and the manufacturing version of the index are now in disaster territory. For how long as anyone's guess.
ISM Index Charts
 [2]
[2]
Source: YCharts
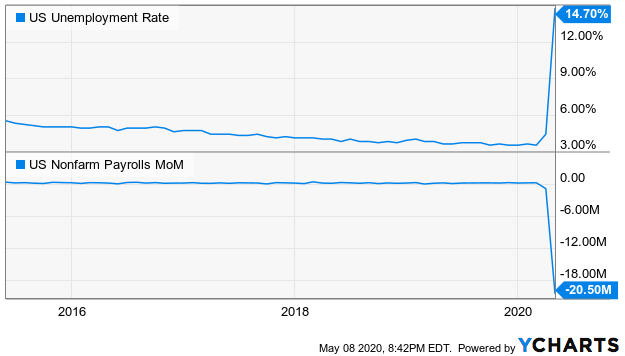
Also note that April's auto sales tumbled in a big way again from March's levels, which were also down. This might be one measure of economic strength that doesn't snap back very clearly, as automobile sales were hanging by a thread even before the coronavirus outbreak took hold.
Automobile Sales Charts
 [3]
[3]
Source: YCharts
Everything else is on the grid.
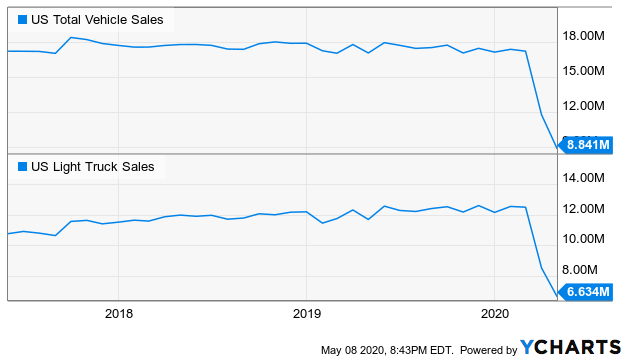
Economic Calendar
 [4]
[4]
Source: Briefing.com
This week is going to be a pretty busy one, but again we'll remind you to not read too much into the numbers, good or bad. We're in an unprecedented situation.
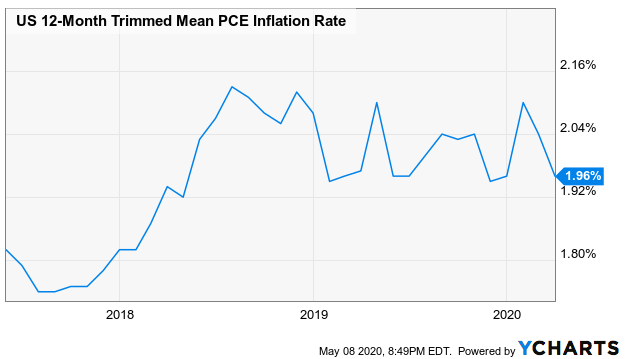
The party gets going on Tuesday with consumer inflation figures, followed on Wednesday with producer prices. Economists are reasonably sure we'll see sizeable declines from March's prices. We might end up seeing negative annualized inflation.
Inflation Chart
 [5]
[5]
Source: YCharts
On Friday we'll hear about last month's industrial production and capacity utilization, which is one of the more important measure of economic activity we can use to gauge what's going on. Analysts are calling for a sharp contraction in utilization, from 71.7% to 64.0%. That's expected to be mirrored by a 12.1% decline in production. Figures that are better or worse than expectations could move the market in good or bad ways.
Capacity Utilization and Industrial Production Charts
 [6]
[6]
Source: YCharts
Also on Friday look for last month's retail sales. The pros are expecting more than an 8% tumble not counting cars, and nearly a 12% slide when factoring cars into the mix. Again, just keep in mind it's not so much a lack of willingness as it is a lack of physical capability. The looming end of lockdowns will provide some relief on this front pretty quickly.
Retail Sales Growth Charts
 [7]
[7]
Source: YCharts
Stock Market Index Analysis
Two weeks ago we were wondering if the S&P 500's 20-day moving average line would hold up as a floor, if tested. We got that test last week. It did. All it took was a kiss of that prospective technical support level — then at 2809.44 — on Monday to rekindle the rally effort that first took hold on March 24th. There are still some technical ceilings to push through, but the lull after April's bullish storm may have been just enough rest for the bulls to keep chugging forward now.
S&P 500 Daily Chart, with VIX and Volume
 [8]
[8]
Source: TradeStation
There's still much work to be done, however, and there are some concerning nuances… at least for the S&P 500.
The biggest hurdle still in the way is the now-converged 100-day (gray) and 200-day (white) moving average lines, both at 3000. Converged, the two augment one another as technical ceilings. You can also see that the bullish volume behind Friday's advance was thin. In fact, the bullish volume has been pretty weak all the way up thus far.
The good news? The VIX has restarted a concerted downtrend, but there's still plenty of room for it to keep trending lower.
These mixed messages aren't exactly a surprise, or even a problem. This is the sort of indecision one would expect to see after a steep selloff spurred by fear that was always going to be short-lived. It SHOULD take two or three tries for a rally to push past resistance. The key will be seeing persistent buying on higher volume if-and-when the index clears 3000. If that doesn't happen, keep a close eye on the big floors. That's the 20-day moving average line (blue) now at 2842.7, and the 50-day moving average line (purple) at 2730.2.
Those aren't the only lines in the sand traders will want to watch closely, however.
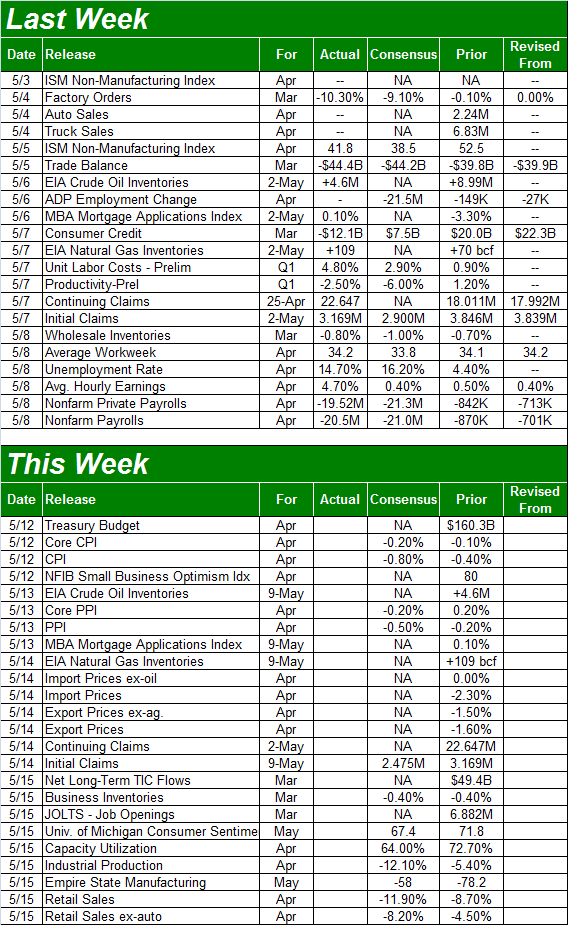
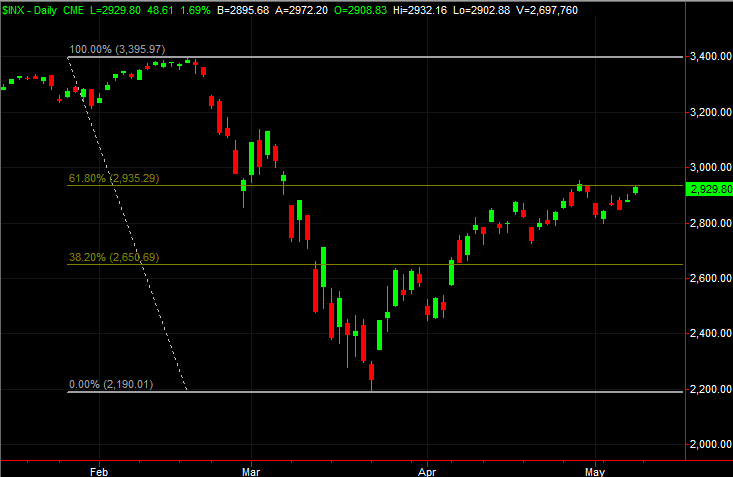
We looked at them a couple of weeks ago, but they merit a refreshed look now because they came back into play on Friday. That's the key Fibonacci retracement lines at 3/8 and 5/8 of the entire span of the February-March selloff. The S&P 500 broke above the 3/8 (38.2%) retracement a month ago, but it retesting the 5/8 (61.8%) retracement level of 2935 right now. It's not likely to be a pure coincidence this level is a factor, as it was late last month.
S&P 500 Daily Chart, with Fibonacci Retracement Lines
 [9]
[9]
Source: TradeStation
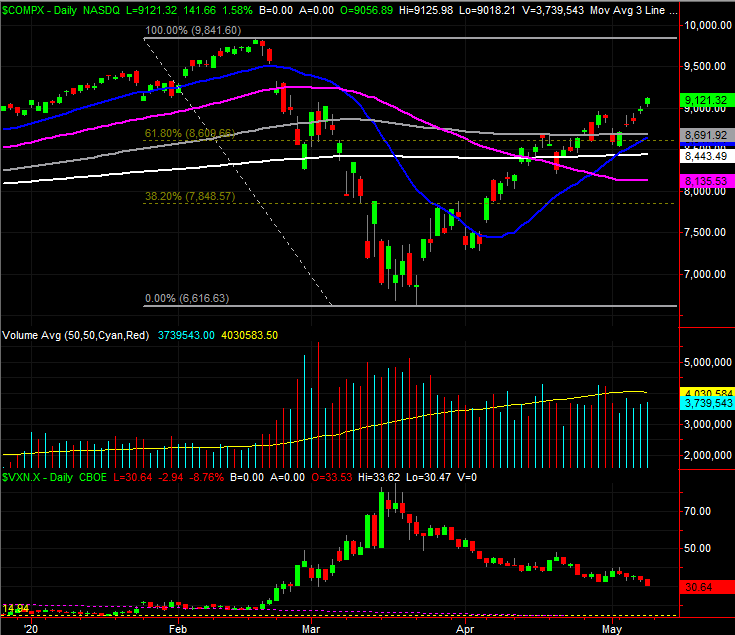
Interestingly (in a bullish/good way), the daily chart of the NASDAQ Composite has blown past all of the technical ceilings that have proven problematic for the S&P 500.
NASDAQ Composite Daily Chart, with VXN
 [10]
[10]
Source: TradeStation
Even that bullishness is somewhat flawed, however, in that it's entirely relied on the FANG stocks to do the heavy lifting. Take them out of the mix and the NASDAQ's names are collectively struggling to get over major humps too.
All of this combined makes this week a pivotal week for the market, which by extension makes it a pivotal week for the war on the coronavirus outbreak. Most stocks are on the fence, so to speak. They may be able to shrug off one more blow, but not two. The thing is, another blow followed by a quick recovery effort is actually the best thing for the bulls, as it would prove the rally's strength.
Watch how bearish days end, if we see some this week. The bulls might drop a few hints about what they're really thinking at that point of the session.