It was touch-and-go for the better part of last week, but when push came to shove as Friday's closing bell approached, it was the bulls doing most of the shoving. What was going to be the second weekly loss in a row turned back into a gain (for most indices anyway), and the market's most important technical floors remained intact.
Some things are still a bit problematic. Namely, most stocks remain uncomfortably overbought, and ripe for profit-taking. There are a couple of other clues that the market's used up all of its potential bullishness here as well. Before we flesh out those details though, let's recap last week's big economic news and preview what's coming this week.
Spoiler alert: The grand finale is a critically important jobs report for March. But, first things first.
Economic Data Analysis
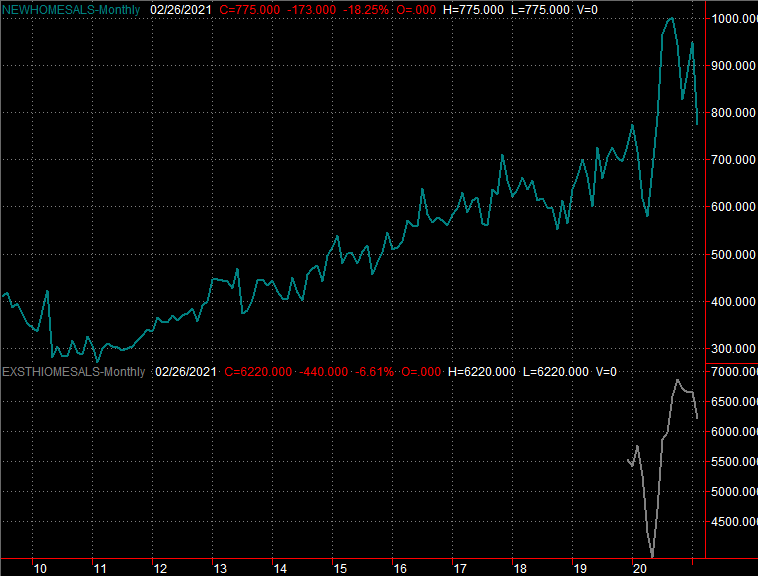
Last week was a relatively light one in terms of economic news, but we rounded out the real estate picture in a big way with new and existing home sales figures for February. Both not only fell, but fell more than expected. They're still fairly high, but the froth is gone.
New, Existing Home Sales Charts
 [1]
[1]
Source: Census Bureau, National Board of Realtors, TradeStation
You may recall (in the same vein) that starts and permits fell quite a bit last month too. Home prices have remained firm through the last part of the data sets we have. Just bear in mind that the Case-Shiller and the FHFA home pricing indices are only current through December. They were accelerating into record territory through then, but odds are good they're positioned to cool off as well. [More on these data measures below.]
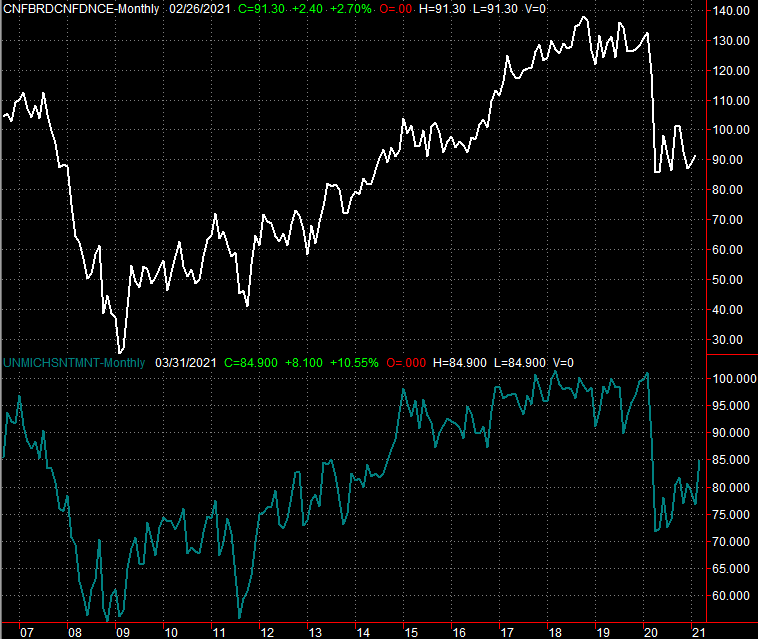
Not all hope is lost. While home purchase demand is cooling, consumer sentiment is firming up. The University of Michigan Sentiment Index jumped to its highest level since March of last year, reaching 84.9.
Consumer Sentiment Charts
 [2]
[2]
Source: University of Michigan, Conference Board, TradeStation
We'll confirm or question this uptick in sentiment on Tuesday when we get the Conference Board's report on consumer sentiment. Economists are looking for strong progress for this measure too.
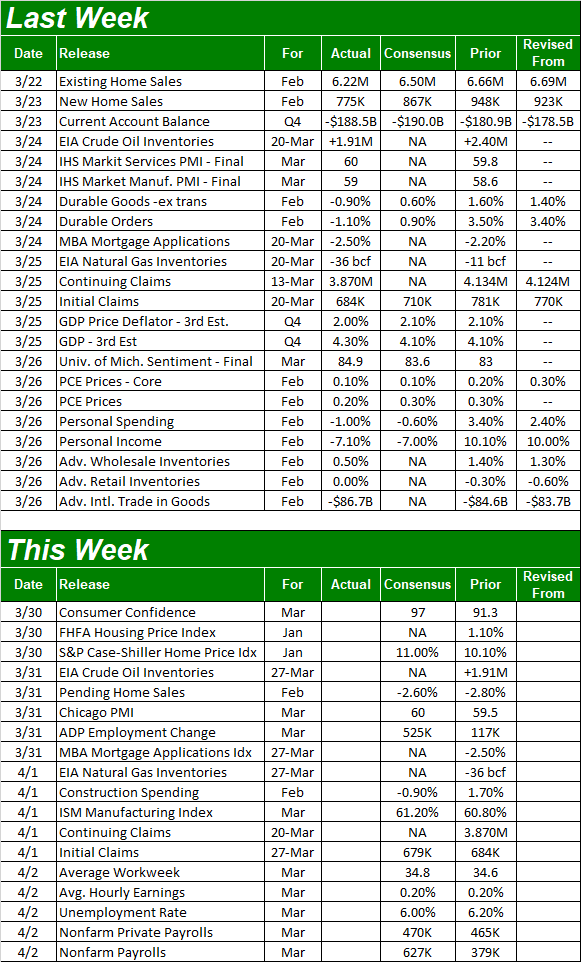
Everything else is on the grid. Notice last quarter's (Q4's) GDP growth rate ended up being a bit better than anticipated, revised upward from 4.1% to 4.3% with the third calculation.
Economic Report Calendar
 [3]
[3]
Source: Briefing.com
We mentioned above that home prices were still growing through December. Forecasters think they'll continue to show progress through January. Tuesday's S&P Case-Shiller Home Price Index is projected to indicate an 11% year over year rise, and while there's no consensus for the FHFA Housing Price Index, it's apt to show a January rise too. Both improvements would extend long-established trends.
Home Price Index Charts
 [4]
[4]
Source: Standard & Poor's, FHFA, TradeStation
Yes, the home value data is at least one month behind other real estate data. Take a closer look at purchases and construction data though. Starts as well as buying peaked between two and five months back. More progress on the pricing front would be an outlier.
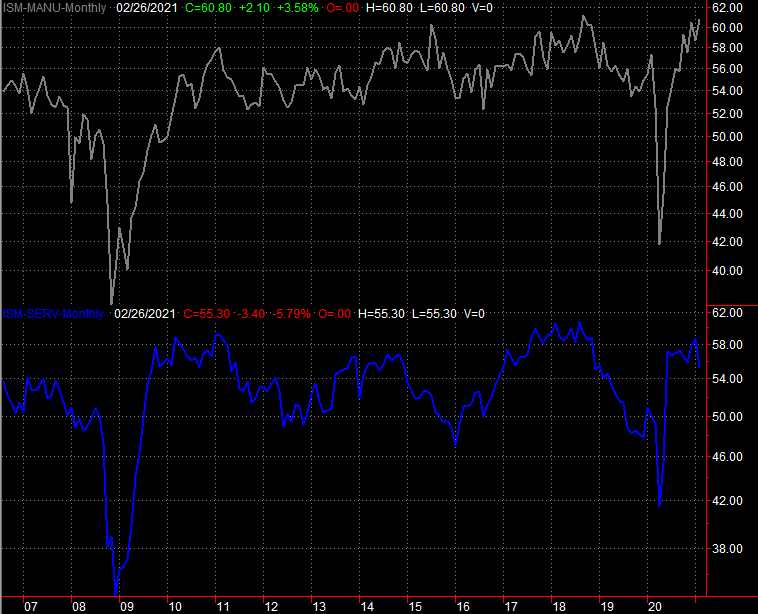
We'll also start the look at March's ISM numbers this week, with Thursday's ISM Manufacturing Index update. It's been firmly on the rise since last April's deep low, but if it moves higher to the expected print of 61.2% for March, that will be a tie for the highest level since September of 2018.
ISM Index Charts
 [5]
[5]
Source: Institute of Supply Management, TradeStation
Look for March's ISM Services data next week.
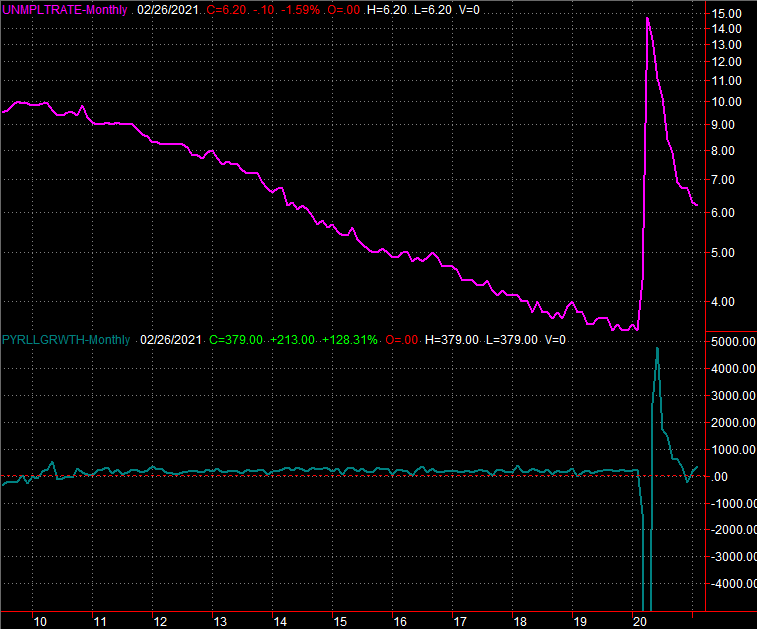
The biggie this week is of course Friday's jobs report for March. Economists are calling for more, and better, progress. Estimates for 627,000 new jobs (with 470,000 of them being new private payrolls) should be enough to pull the unemployment rate down from 6.2% to 6.0%. That's within sight of the multi-decade low of 3.5% seen in 2019. That sort of healthy report could move the market.
Payroll Growth and Unemployment Rate Charts
 [6]
[6]
Source: Department of Labor, TradeStation
Stock Market Index Analysis
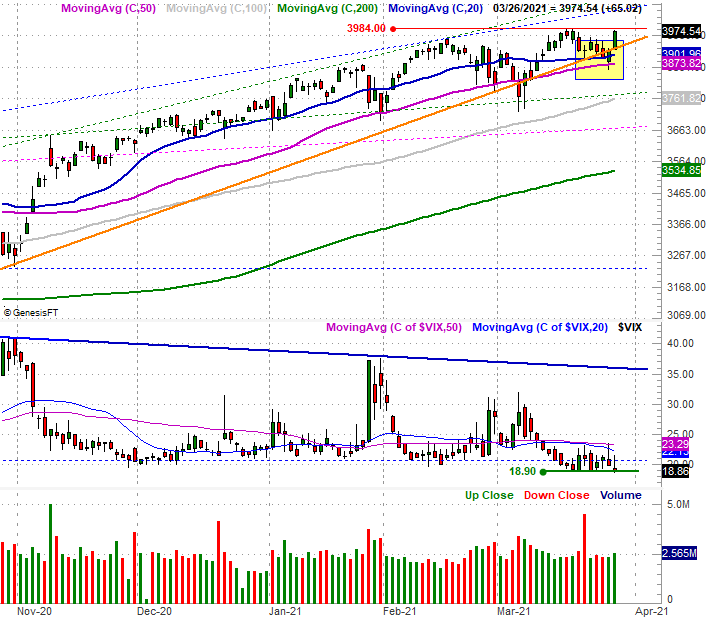
We'll kick this week's analysis off with a close-up look at the daily chart of the S&P 500. But, know that we're only doing so to put the past few days in the most meaningful context. Take a look. Early in the session on Thursday the 50-day moving average line (purple) was being tested as a floor. It passed that test, following through with that recovery on Friday to drive the S&P 500 almost to its mid-March all-time peak near 3984. Also notice the VIX has broken below a previous floor at 20.1 to develop a new floor around 18.9.
S&P 500 Daily Chart, with VIX and Volume
 [7]
[7]
Source: TradeNavigator
The support at the 50-day moving average line and the VIX's move to a lower level are both bullish. But, in both cases new limits are being imposed. The VIX now seems unable to move under 18.9, and the S&P 500 remains capped at 3984 after several weeks of slowing down. The weekly chart of the index better illustrates this slowdown.
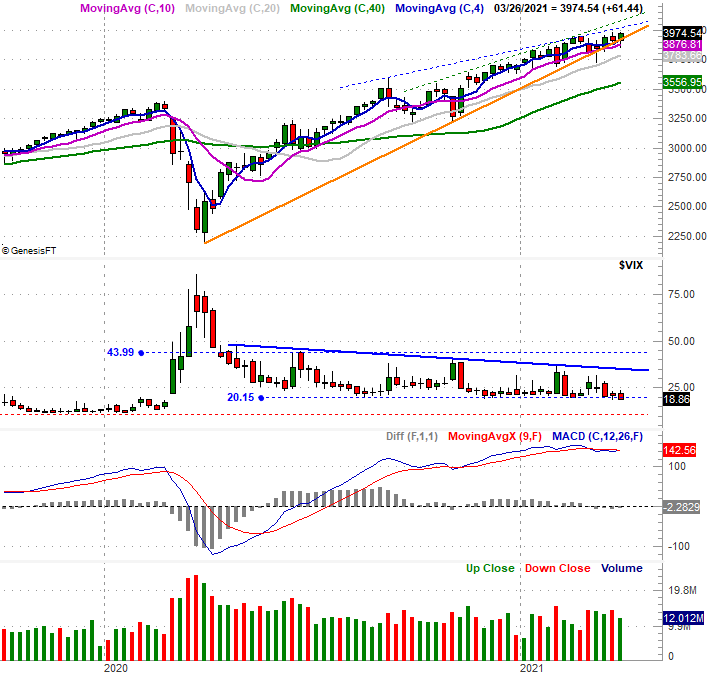
S&P 500 Weekly Chart, with VIX, MACD, and Volume
 [8]
[8]
Source: TradeNavigator
The real take-away with the weekly chart, however, is how the slowdown – as evidenced by falling MACD lines – is manifesting to the degree of persistent pressure it's not putting on the S&P 500 now. Not only has the aforementioned 50-day moving average line been tested more in the past nine weeks than it had been in the previous nine months, the support line that connects all the key lows since last March's low (orange) is under repeated attack. Indeed, it's failing.
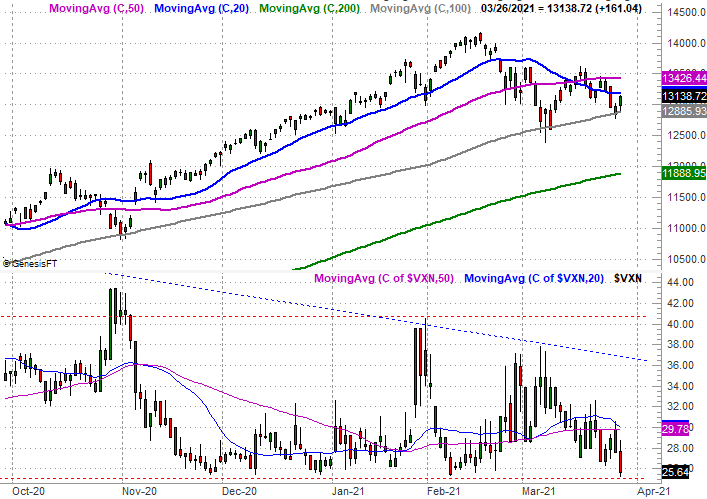
It's not completely failed yet… at least not for the S&P 500. The NASDAQ Composite is a different story though. Simply put, the composite's 50-day moving average line failed to hold it up late last month and early this month. That duty has since been delegated to the 100-day moving average line (gray), though it's doing that duty well. Also notice the NASDAQ's Volatility Index, the VXN, did stop falling at its established support level near 25 on Friday.
NASDAQ Daily Chart, with VXN
 [9]
[9]
Source: TradeNavigator
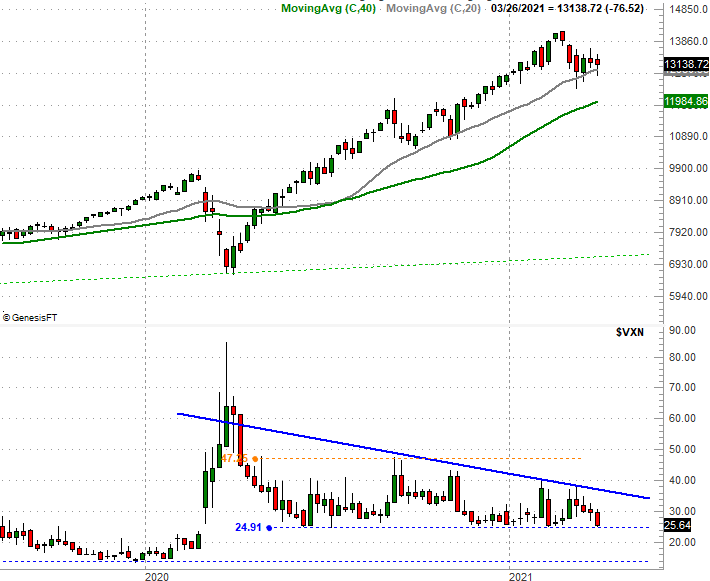
This more dramatic breakdown from the NASDAQ may purely be a function of the NASDAQ's meteoric rise through February; it fared far better than the S&P 500. To this end, the current support at the 100-day moving average line not only makes sense, but is idea. The 100-day moving average line (gray, on the weekly chart below) is what prompted the rebound in November that drove that meteoric gain.
NASDAQ Weekly Chart, with VXN
 [10]
[10]
Source: TradeNavigator
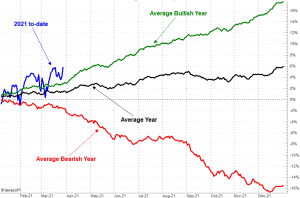
Simply put, the market is overbought no matter which index you're looking at, and both indices are finding technical support at one key moving average line. The rally is still intact. Also know that while the market is ahead of where it would normally be at this point in the year, April is typically a bullish one for stocks. The calendar may help keep the rally going for at least a little while longer.
S&P 500 Annual Day-by-Day Performance
 [11]
[11]
Source: TradeNavigator
Even then, however, the market's decided bullishness has left it dangerously ahead-of-schedule for the year so far. That's also applying selling pressure now.
Nevertheless, enough of the right technical support levels are holding up. Until they break, the rally remains intact. Until the VIX and VXN break above their technical ceilings, any such market weakness is still not a fatal blow.