
It could have been worse. Though the market didn't log any meaningful gain last week, it didn't lose ground either. Nevertheless, stocks ended last week on a low note, pointed lower and beneath some key lines in the sand. And, there was certainly no lack of volume behind the selling – a LOT of people are starting to have second thoughts about how much they really want to be exposed to stocks.
It's not an invalid concern, though it would also be wrong to suggest that any further downside from here would be the beginning of a bear market. It would just be a normal, garden variety correction (but a correction nonetheless).
Even then, however, this erratic market may find a way of sidestepping that selloff in front of the usual bullishness we see during the last couple months of the year.
We'll weight it all, right after a recap of last week's economic news and a preview of this week's economic announcements.
Economic Data
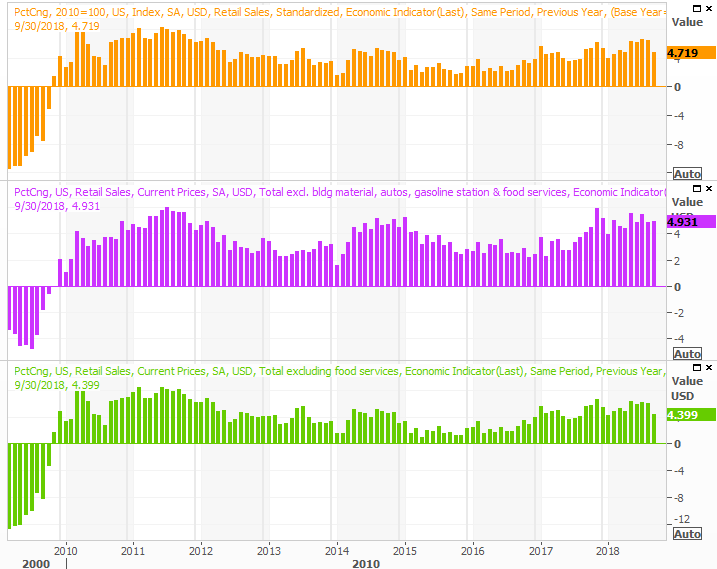
If a score had to be assigned to last week's economic reports, it wouldn't be a good one. Although we've seen worse, the overarching message was that consumerism growth is slowing down.
The week kicked off with a look at last month's retail sales, though a footnote needs to be added before looking at the data. The touted number fell, when stripping automobile sales out of the equation, but that was a month-to-month figure. On the far-more-meaningful year-over-year front, spending continues to rise. It's not rising as fast as it was, but the comparables are getting much tougher now in that they're up against the earliest part of a spending revival.
Retail Sales Growth (Annualized) Charts
 [1]
[1]
Source: Thomson Reuters
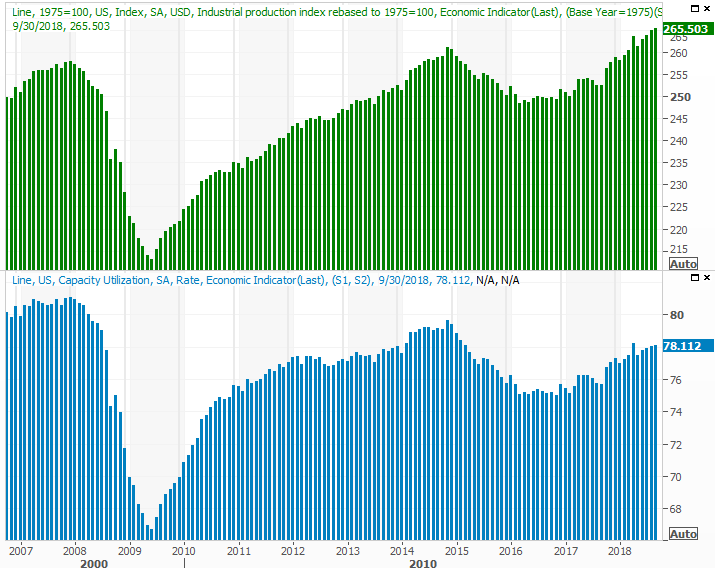
The good news is, the nation's factories are as busy as ever. The Federal Reserve's capacity utilization and industrial production were just as high (if not higher) in September than they were in August.
Industrial Production and Capacity Utilization Charts
 [2]
[2]
Source: Thomson Reuters
This is significant. Broadly speaking, corporate earnings tend to move in tandem with industrial activity. If the latter is rising, so is the former. More than that though, the long-term market trend coincides quite well with the Fed's industrial data. It can't stave off a short-term setback, but the trend here bodes well for future economic growth.
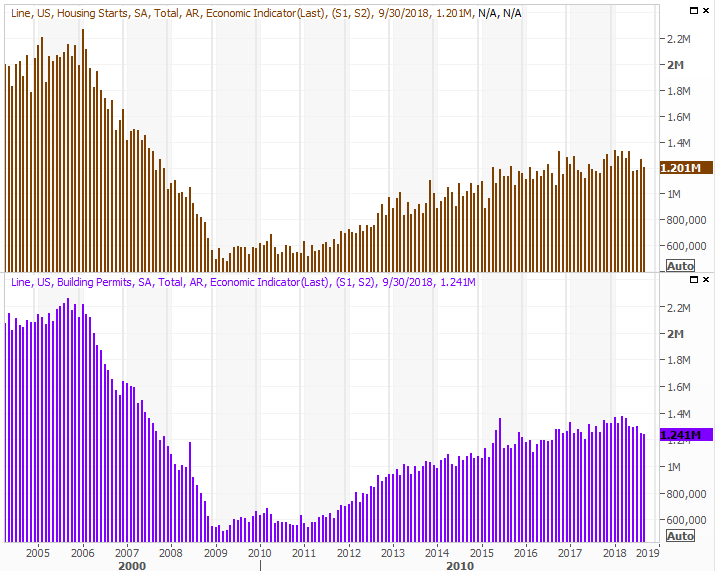
Still, there are sore spots. Namely, real estate remains suppressed. Housing starts and building permits both slumped last month, extending what's turning into an uncomfortably long trend.
Housing Starts and Building Permits Charts
 [3]
[3]
Source: Thomson Reuters
And, existing home sales fell again last month too.
New and Existing Home Sales (Annualized) Charts
 [4]
[4]
Source: Thomson Reuters
We don't yet have last month's new-home sales figures; they'll be revealed this week. Though they ticked higher in August the bigger trend on that front is still pointed lower.
Everything else is on the grid.
Economic Calendar
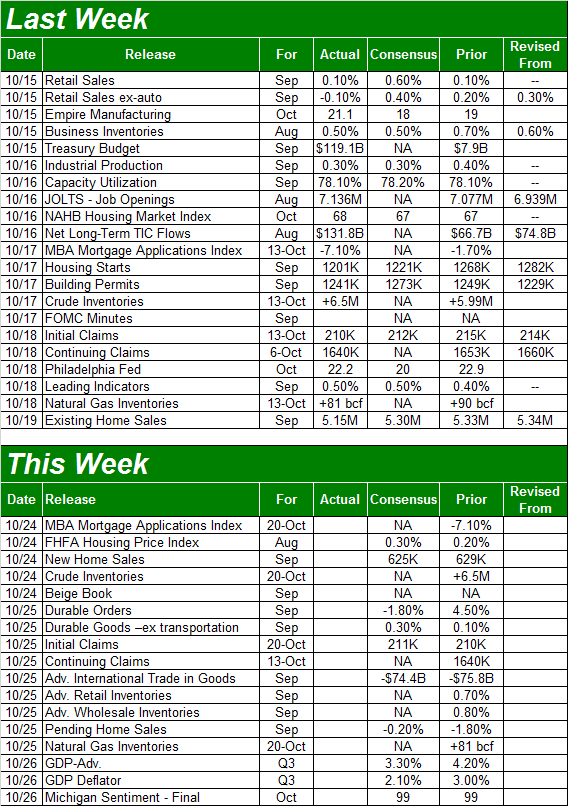 [5]
[5]
Source: Briefing.com
Aside from September's look at new home sales, there's very little of interest in the queue for this week. The only other item we'll be watching closely is Friday's first look at the third quarter's GDP growth rate. The final Q2 pace was 4.2%, so the bar is set high. But, as of the most recent consensus is 3.9%. That's still a rock-solid figure in light of how brisk things were becoming a year ago, though there's also a risk that investors will see the glass as half-empty rather than half-full.
GDP Growth Rate (Annualized) Charts
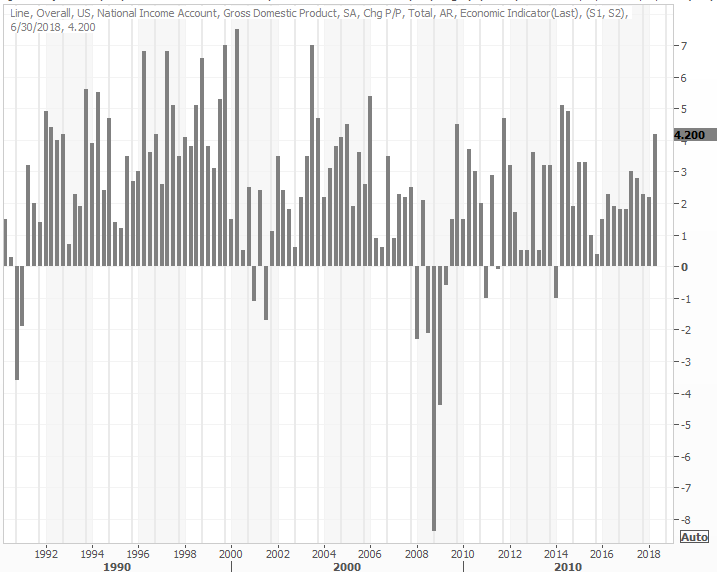 [6]
[6]
Source: Thomson Reuters
Also of minor interest will be last month's durable goods orders, though that's not a hard-hitting report. It will mean even less considering we're now headed into the heart of earnings season. Nevertheless, if you remember it and have time to review it on Thursday, it would at least make for an interesting footnote to add to the overall equation.
Index Analysis
At the beginning of last week, it looked as if the market was going to be able to shrug off the previous week's setback and rekindle the bigger-picture uptrend. By the time Friday's closing bell rang though, that effort had failed. Both the NASDAQ and the S&P 500 ended last week on a bearish foot, and below some critical support levels.
The NASDAQ Composite was the biggest offender. It closed back below the 200-day moving average lone on Thursday, and closed at an even lower close on Friday.
NASDAQ Composite Daily Chart, with Volume
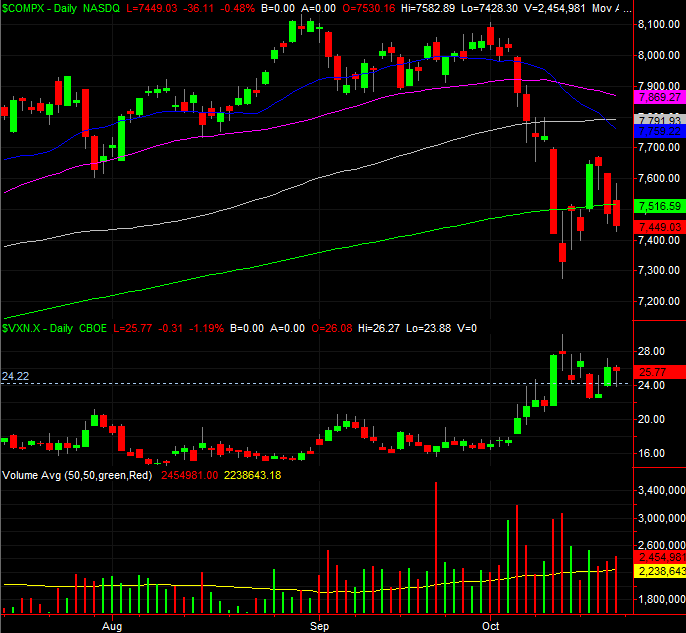 [7]
[7]
Source: TradeStation
The S&P 500 actually did the same, though just barely. But, a win is a win (or a loss is a loss, in the case) no matter how minor. The key factor in both daily charts is that the rebound effort has petered out and the bears are digging in again.
S&P 500 Daily Chart, with Volume
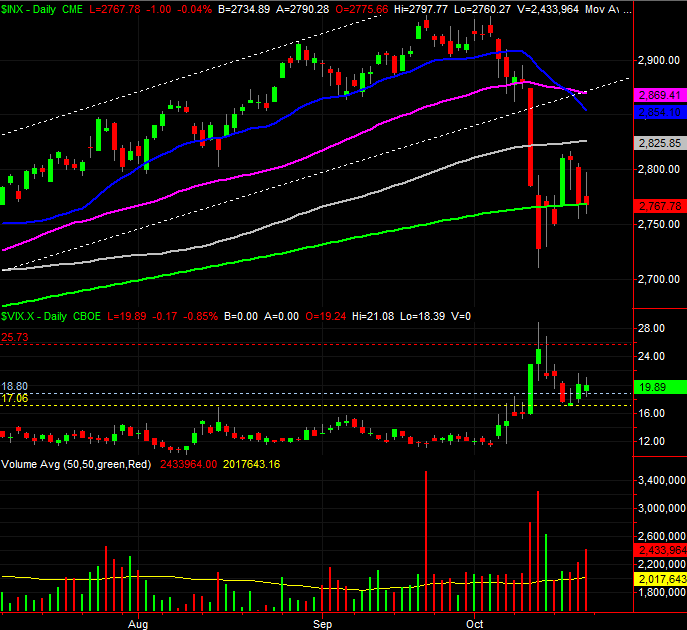 [8]
[8]
Source: TradeStation
The cross below the 200-day moving average lines isn't even the most concerning aspect of either chart though. Take a close look at the volume bars on each daily chart. It's rising the worse things get. And, we can now see that the rebound days on both charts unfurled on fairly low volume. The sellers are starting to come out of the wood work.
The other, scary part of both charts: The volatility indices – the VIX and the VXN – didn't surge the last couple of days of last week when stocks were falling. It's a problem simply because the VIX and VXN are "supposed to peak" at major market bottoms. We may have not yet seen the bottom.
Zooming out to a weekly chart of the S&P 500 may or may not lead you to that same conclusion. Two weeks ago the VIX peaked at 28.84, which is something of a major high even if not a true 'peak' by most people's standards.
S&P 500 Weekly Chart, with Volume
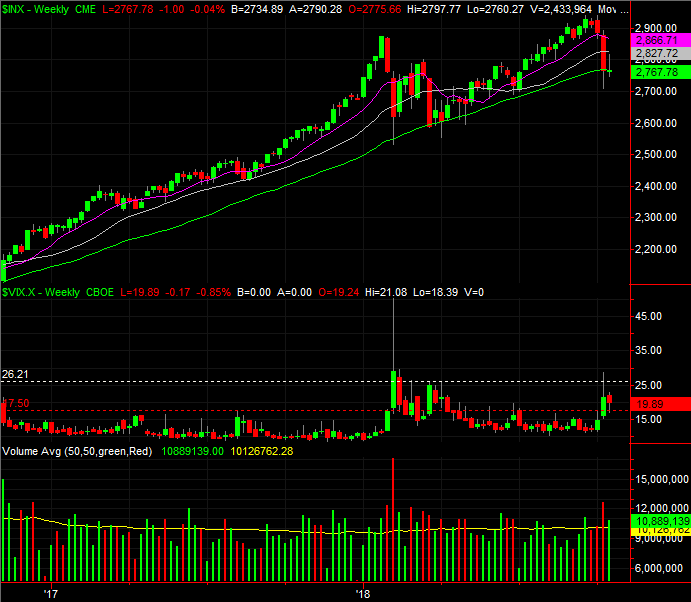 [9]
[9]
Source: TradeStation
But, most clues still suggest the ultimate bottom has yet to be made. Namely, there are decidedly more falling stocks than rising stocks right now, and there is far more bearish volume than bullish volume. If we were near a bottom yet, the bearish breadth and depth would be falling, and the bullish breadth and depth would be on the rise.
Or, who knows? This crazy pre-election market could do anything, should the right politician say the right thing or a new trade deal arrives in the right way at the right time. Assume nothing, and prepare for everything.
On that note…
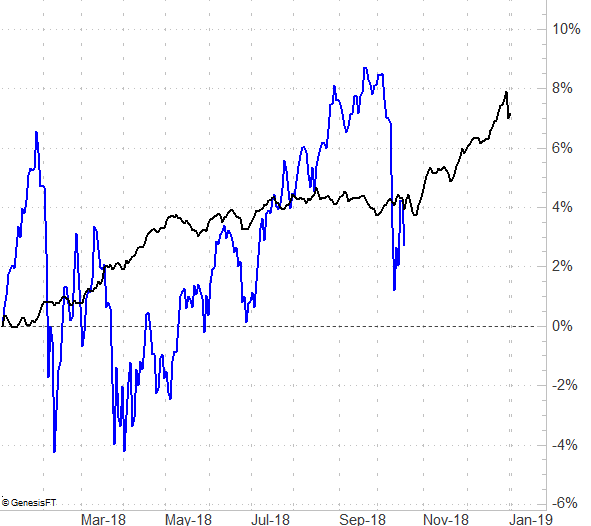
It would be short-sighted to pretend the calendar isn't in play here. The market usually makes a major low in late October, setting up the usual bullishness seen in the last two months of the year. There's room and reason for the market to keep falling and hit that capitulatory bottom just a few days from now. It would be a rough ride, but should be a nice buying opportunity. The graphic below plots the average day-by-day market results, compared to where the S&P 500 has been so far this year.
S&P 500 YTD Performance vs. Avg. Day-by-Day YTD Performance
 [10]
[10]
Source: TradeStation
The catch: Stepping in will feel anything but comfortable at the time.
Again though, anything could happen from here. Before counting on the unfurling of a full-blown correction, the market needs to start this week on a bearish foot to quell any thoughts that a bounce is already forming. We'll dissect any bottom-making clues a week from now, if they take shape.