Despite the rough, bearish start to the week, stocks ended the five-day stretch on a high note. The S&P 500's 1.9$ advance to a close of 3863.16 on Friday wasn't quite enough to lead it out of the red, but it did take a huge bite out of the index's intraweek loss. Perhaps more important, the move left the market within striking distance — again — of a breakout thrust. Only this time, it got some bullish help it didn't quite get the last time it took this swing. Ditto for the NASDAQ.
We'll take a closer look at the effort below, and detail exactly what has to happen next if the bulls really want to kick-start a rebound effort. First though, let's run down last week's economic reports and see what's on the calendar for this week. Spoiler alert: It's a huge week for the now-well-watched real estate market.
Economic Data Analysis
There's no sense in mincing words: Inflation is still rampant. Consumers are (on average) paying 9.1% more for goods than they were a year ago, while factories and manufacturers are paying 11.3% more for ingredients, materials, and supplies. Those numbers aren't quite as bad when you take ever-volatile food and fuel prices out of the mix, sliding to 5.9% and 6.4%, respectively. Even so, given that we're now more than a year into the inflation surge, prices are now on the order of 20% higher than they were prior to the pandemic.
Consumer and Producer Inflation (Rate) Charts
 [1]
[1]
Source: Bureau of Labor Statistics, TradeStation
People are still buying whatever manufacturers are making though, despite their higher prices. Retail sales were up in June — and by more than expected — reversing May's unexpected (albeit slight) lull.
Retail Sales Charts
 [2]
[2]
Source: Census Bureau, TradeStation
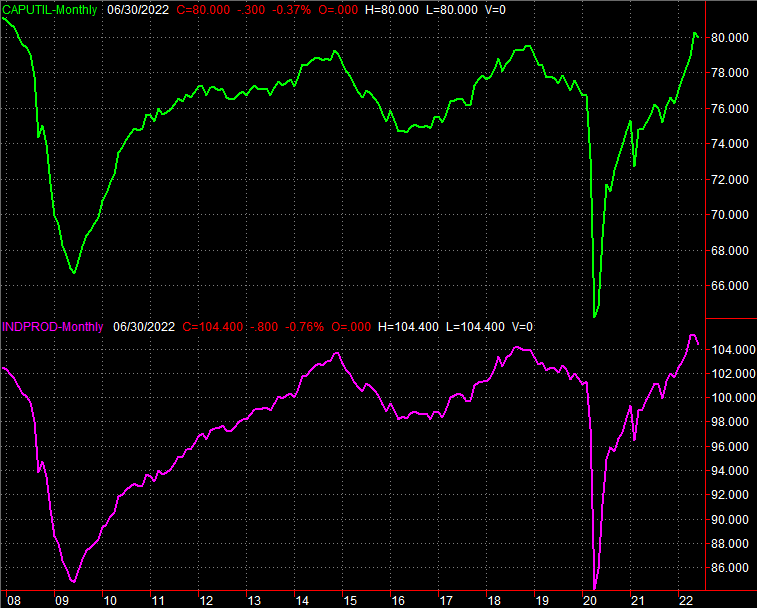
And, therefore, the nation's factories are still busy. The Federal Reserve reports that usage of the United States' production capacity is holding at a relatively high 80%, and though actual production/output fell 0.2% last month, it's still rather firm as well.
Capacity Utilization and Industrial Productivity Charts
 [3]
[3]
Source: Federal Reserve, TradeStation
Everything else is on the grid.
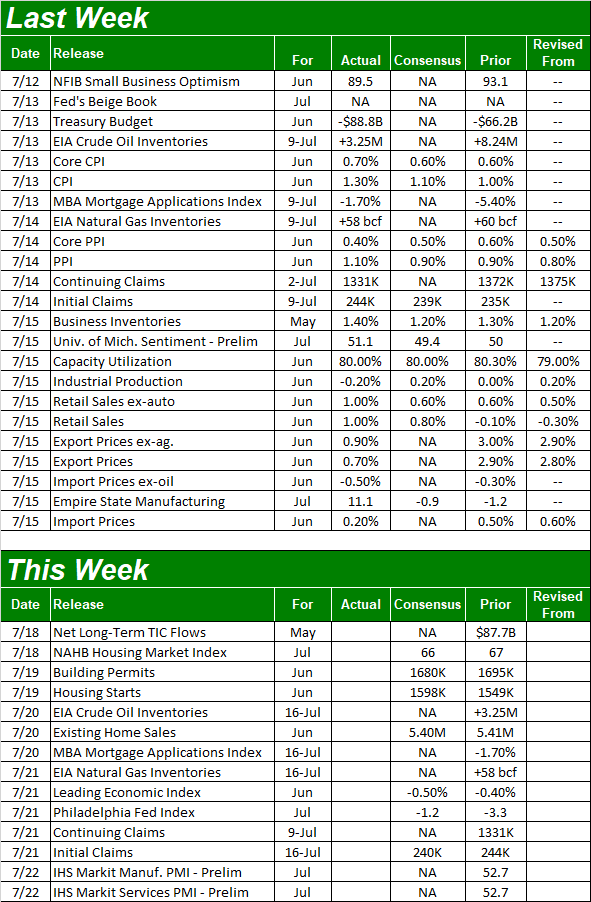
Economic Calendar
 [4]
[4]
Source: Briefing.com
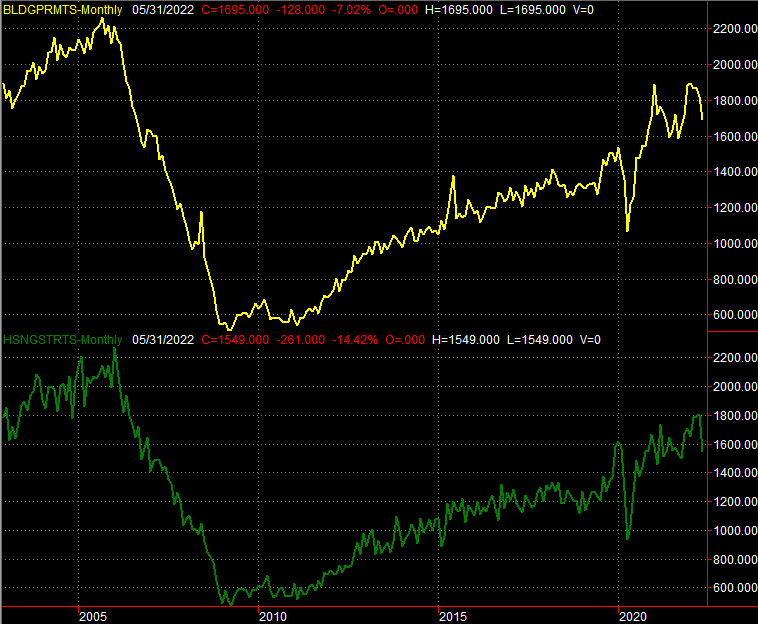
This week won't be quite as busy, but we do kick off a wave of real estate reports this week beginning with last month's housing starts and building permits. Both are likely to come in slightly better than May's levels. Just bear in mind that both fell quite a bit in May.
Housing Starts and Building Permits Charts
 [5]
[5]
Source: Census Bureau, TradeStation
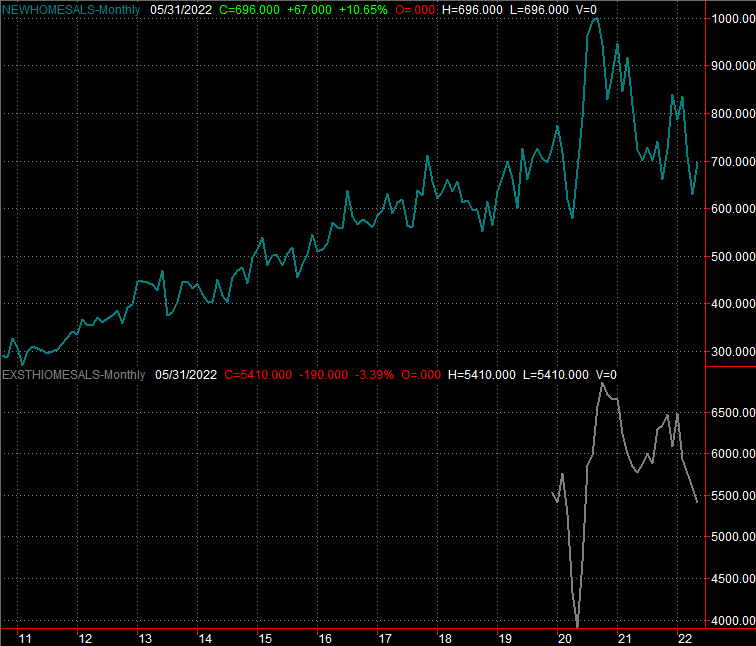
Then, on Wednesday we'll hear June's sales of existing homes. Forecasters are calling for an annualized pace of 5.4 million, essentially repeating May's figure, but as was the case with starts and permits, May's figure wasn't all that great. In fact, it was still near the lowest we've seen during the pandemic, and within sight of the sharp drop-off we saw right when COVID-19 was detected in the U.S. and halted… well, everything.
New and Existing Home Sales Charts
 [6]
[6]
Source: Census Bureau, National Association of Realtors, TradeStation
Stock Market Index Analysis
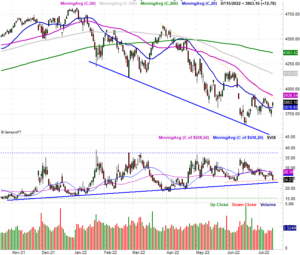
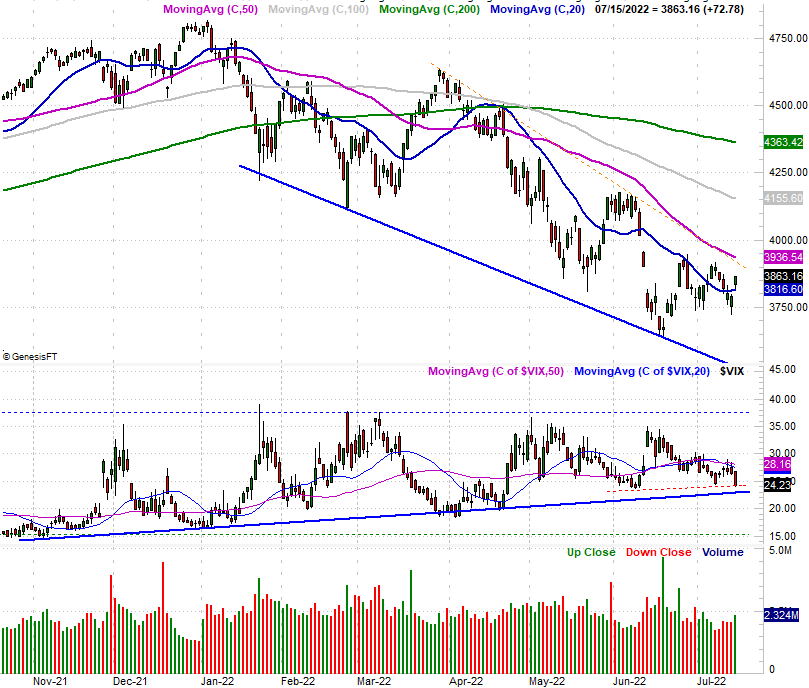
It coulda been worse. The market could have kept its loss suffered through Thursday of last week without Friday's rebound. With Friday's bounce though, the indices managed to move back above some critical technical ceilings. For the S&P 500, that line is the 50-day moving average line plotted in blue on the daily chart below.
S&P 500 Daily Chart, with VIX and Volume
 [7]
[7]
Source: TradeNavigator
Notice, however, the index didn't clear a much bigger and more important resistance level. That's the falling resistance line (orange, dashed) that's kept any rally efforts made since March from going anywhere. This line is being bolstered by the 50-day moving average line (purple) now at 3936. Until that zone of resistance is cleared, any bullishness remains in question.
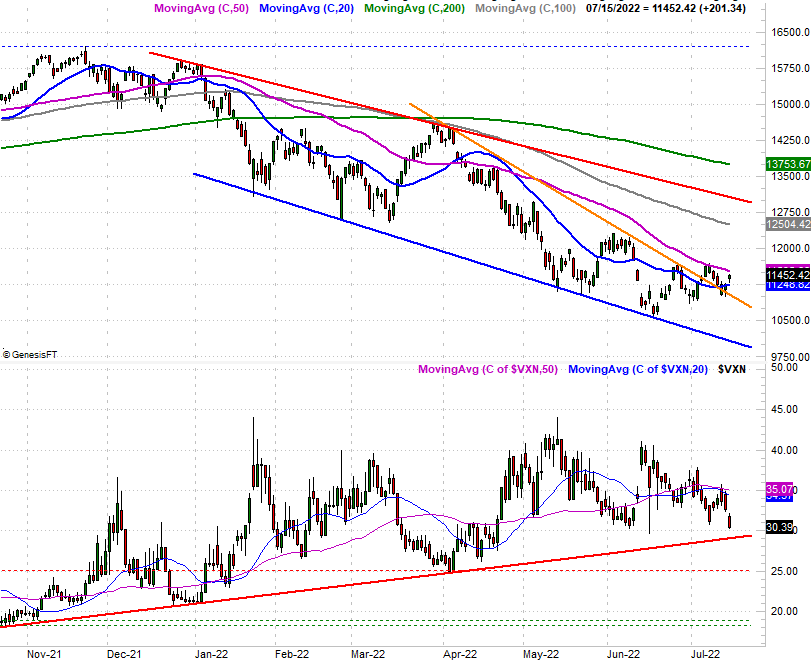
The NASDAQ Composite fared a little better. Although it failed to clear its 50-day moving average line at 11,535, it did manage to poke above its 20-day line as well as hurdle the falling resistance line (orange) that had been steering it lower since late March.
NASDAQ Composite Daily Chart, with VXN
 [8]
[8]
Source: TradeNavigator
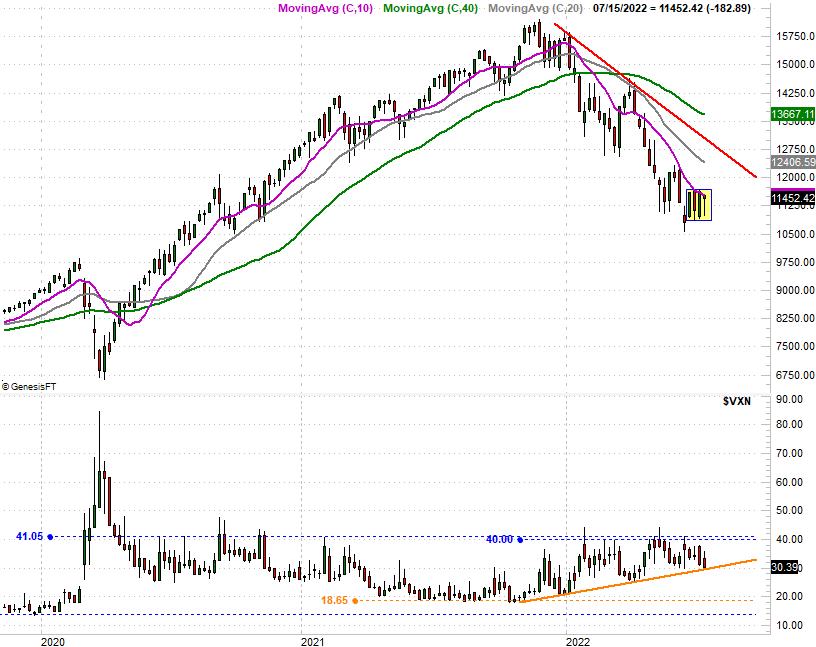
Broadly speaking, it's more encouraging than not… until you zoon out to the weekly charts of both indices and start noticing some things that aren't readily evident on the daily chart.
For the NASDAQ, that's the fact that the index has formed a "box" it's now trapped in over the course of the past four weeks. The ceiling's pretty well defined at 11,680, while the floor's steady at 10,900. Also notice on the weekly chart that the volatility index, or VXN, is just now testing the floor that's kept it moving higher (orange) since the market itself started to slump in January.
NASDAQ Composite Weekly Chart, with VXN
 [9]
[9]
Source: TradeNavigator
The S&P 500's Volatility Index (VIX) is testing a similar floor, while the S&P 500 has also painted itself into a box over the past four trading weeks. As is the case with the NASDAQ, this horizontal containment may mean more than it seems to mean on the surface.
S&P 500 Weekly Chart, with VIX and Volume
 [10]
[10]
Source: TradeNavigator
This recent history make it nearly impossible to draw any meaningful conclusions about the near future. Stocks haven't significantly cleared enough major hurdles to turn decidedly bullish, but the bulls have at least held their ground when they could have easily thrown in the towel following the drubbing suffered in early June. The smart-money move here is doing nothing, rather than trying to force anything. Traders are waiting on the sidelines for a little more clarity, and odds are good that earnings season will force the issue sooner than later. Just sit tight. We should see enough sustained movement worth worrying about soon enough.