
Stocks bounced back from the prior week’s lull, finding support at a major technical support level. But, it wasn’t exactly a convincing move. None of the key indexes actually made a meaningfully higher high. So far we can chalk up this failure to follow through on its fall to indecision.
Still, not melting down is still something of a victory for the bulls. The longer it can hold above its big floor, the more comfortable the would-be bulls will get with the notion that the market is above its floor to stay. Indeed, a healthy cooling-off of the rally from the early-April low may actually be exactly what was needed for the effort’s longevity.
We’ll show you what we mean in a moment. Let’s first discuss last week’s big economic news and preview what’s coming this week.
Economic Data Analysis
Lots of mixed messages last week. Take, for instance, home prices. The S&P Case-Shiller Home Price Index moved higher again, reaching record territory as a result. The FHFA Home Price Index, however, continues to flatten out.
Home Price Index Charts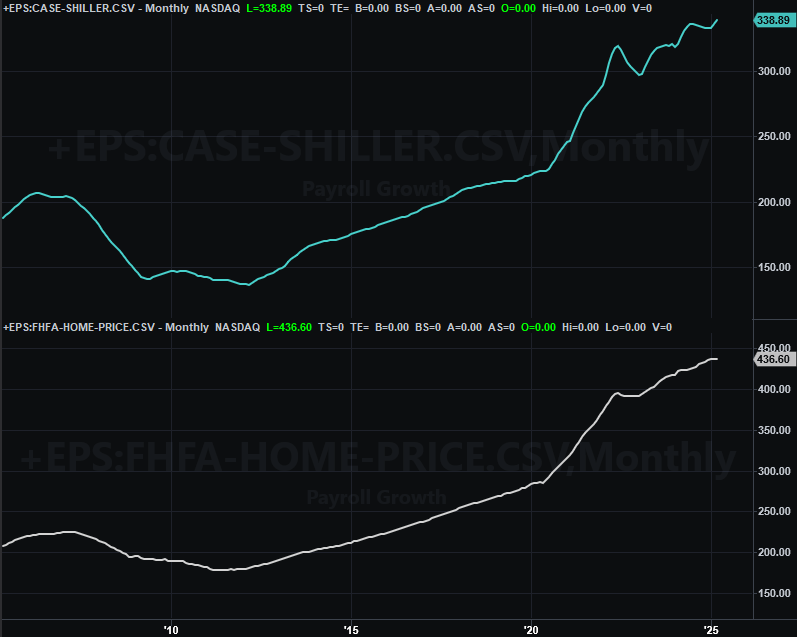
Source: Standard & Poor’s, FHFA, TradeStation
This home-sales price data is for March. Nevertheless, these numbers point to a bigger trend. In this case it may indicate that higher-end real estate is recovering while the lower-priced home market is weakening. Just remember that these are only measures of homes that are sold. They don’t indicate how many houses sold or didn’t sell, which of course is also part of the equation.
Sentiment also turned a little less clear. Whereas the Conference Board’s consumer confidence score bounced back a little from April’s plunge, the University of Michigan’s consumer sentiment reading remained right at its multiyear low of 52.2.
Consumer Sentiment Charts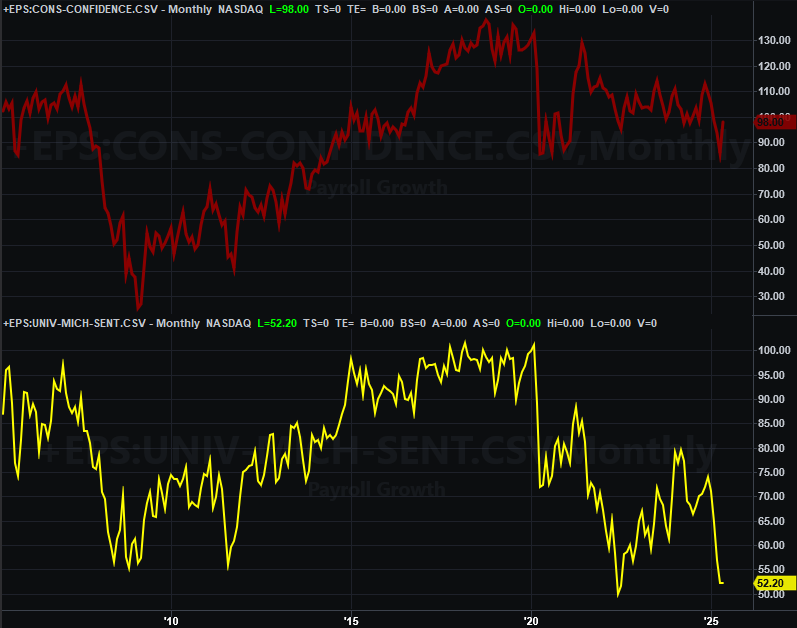
Source: Conference Board, University of Michigan, TradeStation
The only other major report worth highlighting from last week is the look at personal income, and consumer spending… which is ultimately a measure of inflation. To this end, price increases continue to cool off, falling to an annualized rate of 2.1%. This given the Federal Reserve a bit more leeway to cut interest rates, which the market is now betting will start happening in September.
Everything else is on the grid.
Economic Data Report Calendar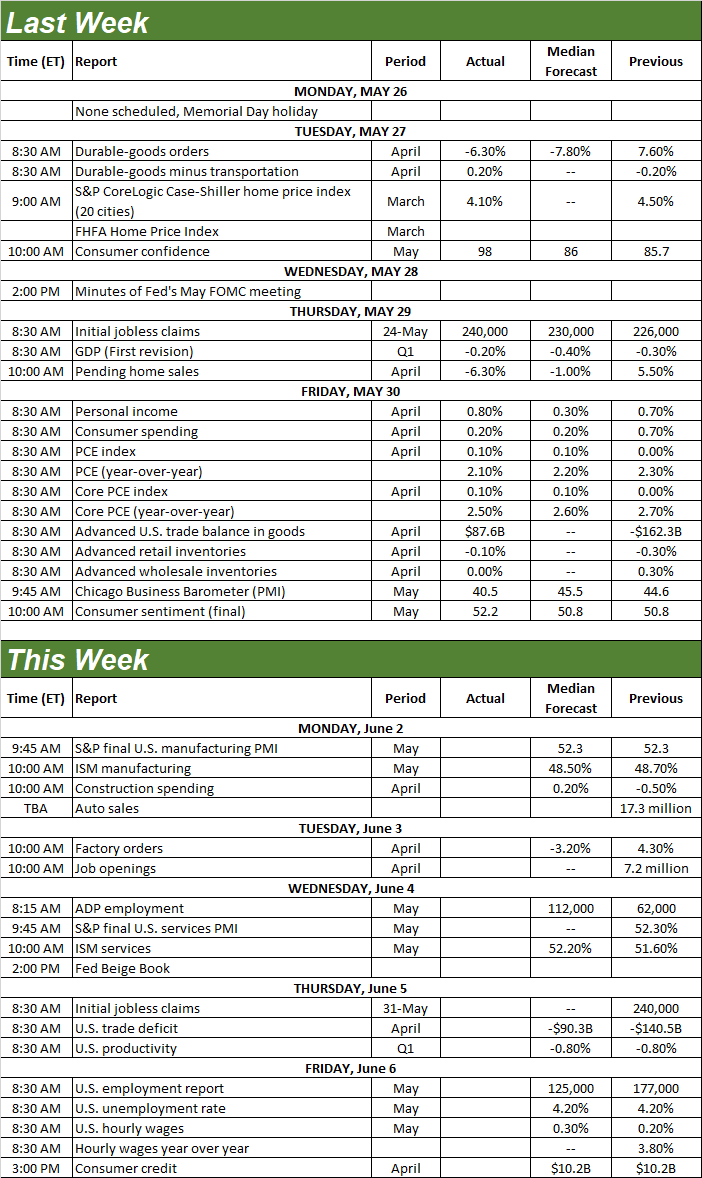
Source: Briefing.com, TradeStation
One of this week’s biggies will be Monday’s look at last month’s manufacturing index from the ISM, while the services index is due on Wednesday. Both should be more or less in line with April’s readings, but neither of these data sets’ trends are particularly encouraging right now.
ISM Services, Manufacturing Charts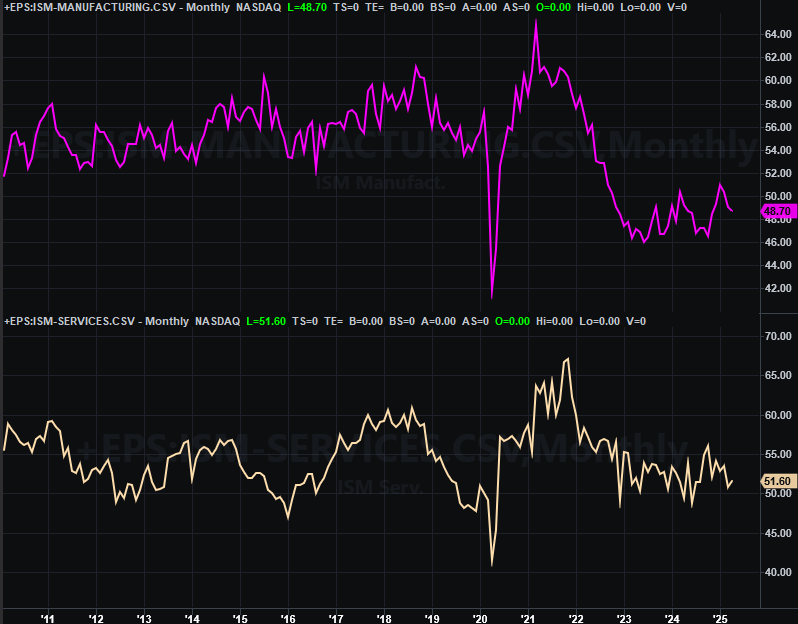
Source: Institute of Supply Management, TradeStation
On Friday look for last month’s jobs report. Economists expect payroll growth to slow to only 125,000 jobs, which should keep the unemployment rate at a reasonably healthy 4.2%.
Unemployment Rate, Payroll Growth Charts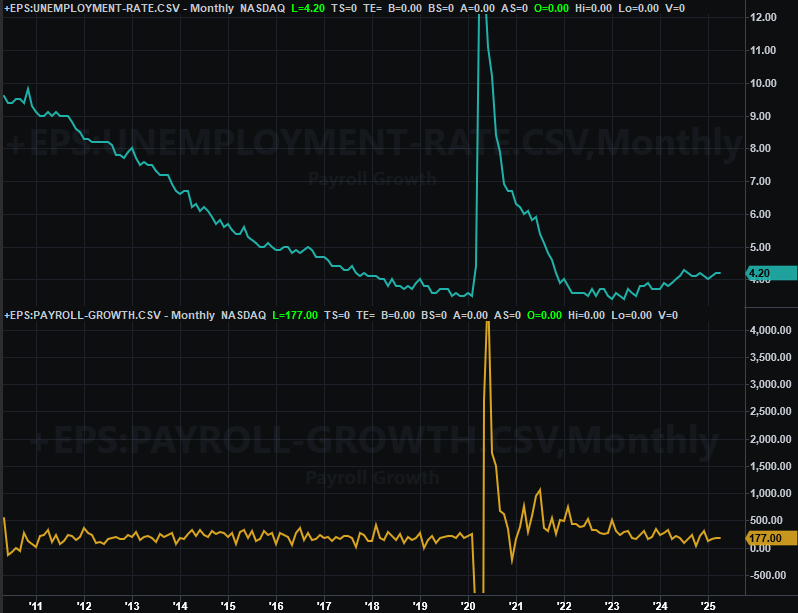
Source: Bureau of Labor Statistics, TradeStation
These aren’t “bad” levels per se. For an economy that needs help achieving escape velocity though, we’d like to see a little more strength on the employment front.
Stock Market Index Analysis
Although the holiday-shortened trading week started out at a disadvantage (falling back from the previous week’s intraweek high), the bulls stood their ground. It wasn’t exactly thrilling. The S&P 500 only gained 1.7% last week, with all of that gain coming on Monday. But, it was good enough to soothe brewing fears. And perhaps most importantly, the index remained above the now-converged 20-day, 100-day, and 200-day moving average lines. That’s something to build on.
S&P 500 Daily Chart, with VIX and Volume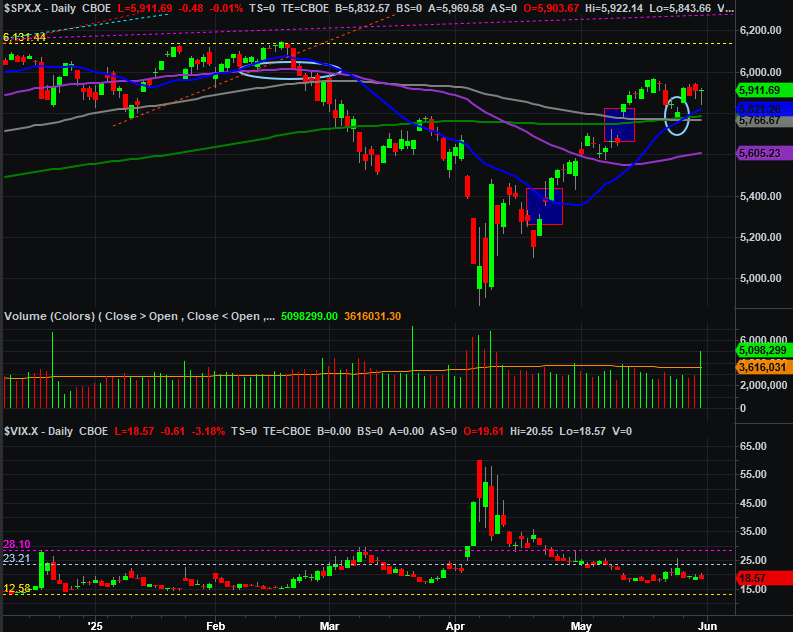
Source: TradeNavigator
It’s a bit too soon to say with absolute certainty that the market’s out of the woods, to be clear. Stocks could still fall. And given the 21.3% runup just since early April, there’s certainly pent-up profit taking potential on the part of nervous investors.
The market bought some much-needed time to regroup though. The less nervous/anxious traders feel, the less likely they are to start of participate in a panic selloff.
The daily chart of the NASDAQ Composite is telling the same basic story, by the way.
NASDAQ Composite Daily Chart, with VXN and Volume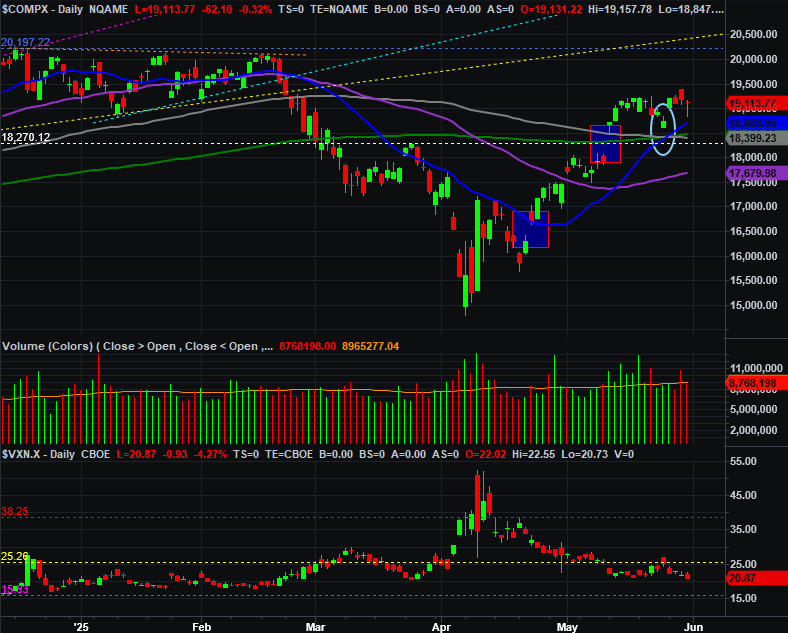
Source: TradeNavigator
Here’s the weekly chart of the S&P 500, to put last week’s action in the proper perspective. As you can see from this vantage point, the market is mostly just paused here from the rally that was finally stopped cold three weeks ago.
S&P 500 Weekly Chart, with VIX and MACD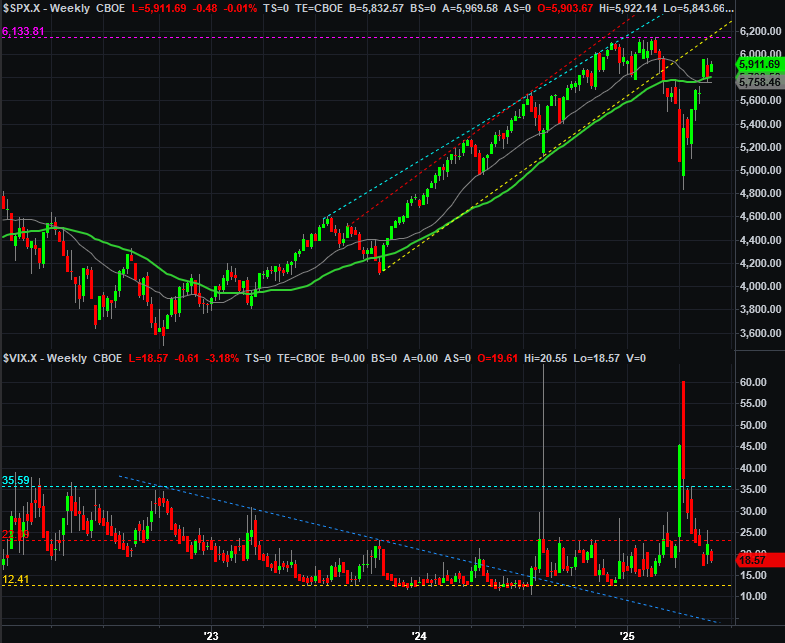
Source: TradeNavigator
This viewpoint also raises the question… was the big rebound “big” only because the pullback from February’s peak was also so incredibly big? Never say never. If that’s the case — and it may well be — it’s (again) still too soon to fully jump into the bullish camp.
Still, follow the trend. The bigger-picture here is bullish, and both indexes seem to be finding support at most of their key moving average lines. That’s big.
Just as a “show me” litmus test, let’s wait and see if both indexes can make highs above their May highs. It wouldn’t take much to do that, if the market’s actually in bullish mode. The slower and more measured, the better; a faster advance invites profit-taking. The next test after that of course is February’s highs. Should the market actually push above those levels, bullishness actually gets much easier to muster.
But isn’t summertime a slow, lethargic time for the market? It is… on average. June, July, and August in sum usually dish out a net gain of only 1.0%. The coming three months are also often some of the most volatile ones, in both bullish and bearish ways. It’s absolutely possible for stocks to log big gains over the course of any single given summer.
Of course, it’s also possible to suffer oversized losses in the event of a summertime swoon. A little more bad news on the tariff front or a couple of disappointing economic reports could prompt that sort of move too.
Let’s wait for traders to show us a few more of their cards here before making a more concrete call.