Following through on the previous week's intraweek reversal effort, the market mustered another win last week. In fact, the S&P 500's gain of 1.5% took it to a record high as well as a record high close on Friday; the NASDAQ Composite followed suit.
And yet, many of the concerns we've been discussing of late are still concerns. Those include a lack of (and deteriorating) volume behind the advance, and at least for the S&P 500, the fact that it's still not broken above a key technical ceiling. Do note, however, the NASDAQ pushed above its big resistance line last week, opening the door to what could be a massive move higher. Still, the timing is all wrong.
We'll show you why the timing is all wrong below. First, let's look at last week's economic reports and preview what's coming this week. Spoiler alert: Friday's jobs report could really shake things up.
Economic Data Analysis
Last week's big news items both had to do with real estate. On Monday we learned from the National Board of realtors that sales of existing homes accelerated to an annualized pace of 5.99 million in July, while the Census Bureau reported sales of new houses hit an annualized clip of 708,000. That's also a modest increase from June's level. Just bear in mind we're still nowhere near the manic levels seen just a few months back. In fact, both are still near the lower end of the long-term trend's range.
New, Existing Homes Sales Charts
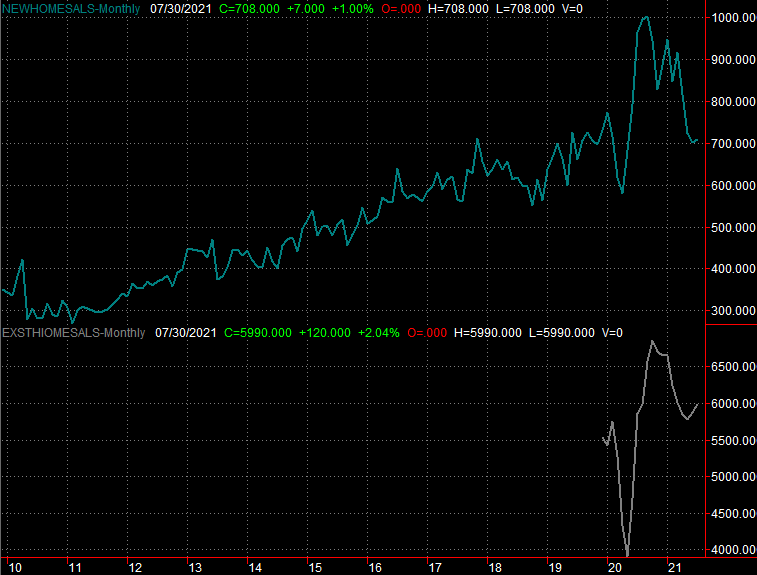 [1]
[1]
Source: National Board of Realtors, Census Bureau, TradeStation
Though we're not charting it this time around, note the third and final reading of Q2's GDP growth rate inched a little higher to 6.6%. Everything else is on the grid.
Economic Calendar
 [2]
[2]
Source: Briefing.com
This week's a pretty busy one, with the first item of interest due on Tuesday… in the form of the Conference Board's consumer confidence measure. The University of Michigan reported its final look at its sentiment index last week, with the reading of 70.3 marking a major dip from July's level. Economists are forecasting a similar setback for the Conference Board's figure of the same, from 129.1 in July to 123.0 for August. The re-acceleration of the pandemic stemming from the delta variant of COVID-19 has really rattled people's psyches.
Consumer Sentiment Charts
 [3]
[3]
Source: University of Michigan, Conference Board, TradeStation
We're also going to round out the look at the real estate picture this week, with the FHFA's measure of home prices due on Tuesday, and the S&P Case-Shiller report coming on the same day. While purchase activity has turned wobbly, prices have remained firm. That's not expected to change. Just bear in mind this week's home price reports are a month behind, reflecting June's data.
Home Price Charts
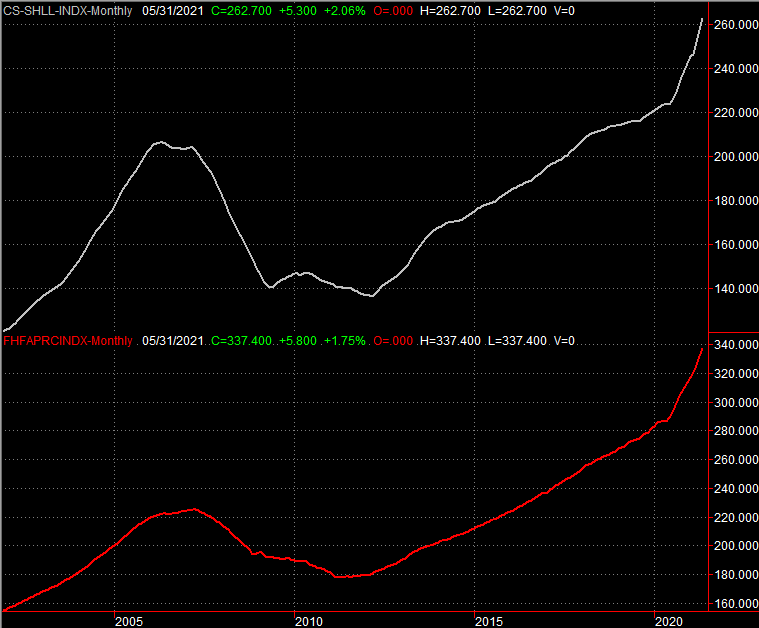 [4]
[4]
Source: Standard & Poor's, FHFA, TradeStation
We'll also got both ISM reports this week. The manufacturing figure is due on Wednesday, with the services report coming on Thursday. Both are expected to have peeled back a bit from July's figures, though both are also still expected to remain well above the critical 50 level.
ISM Services and Manufacturing Index Charts
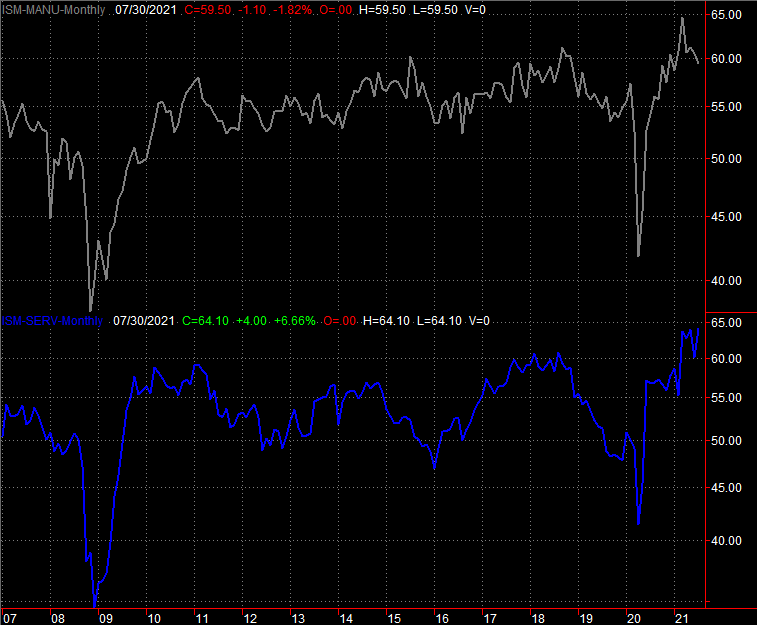 [5]
[5]
Source: Institute of Supply Management, TradeStation
This week's big Kahuna, of course, is Friday's jobs report. Forecasters are calling for job growth of 750,000 payrolls, down from July's growth of 943,000, but still probably enough to drive the unemployment rate down from 5.4% to 5.2%.
Unemployment Rate and Payroll Growth Charts
 [6]
[6]
Source: Federal Reserve, TradeStation
Stock Market Index Analysis
We'll kick things off this week with look at the daily chart of the S&P 500, primarily to show you what didn't happen. What didn't happen is, the S&P 500 didn't push past the upper boundary (orange) of its converging wedge pattern despite the advance. It touched it, but didn't hurdle it.
S&P 500 Daily Chart, with VIX and Volume
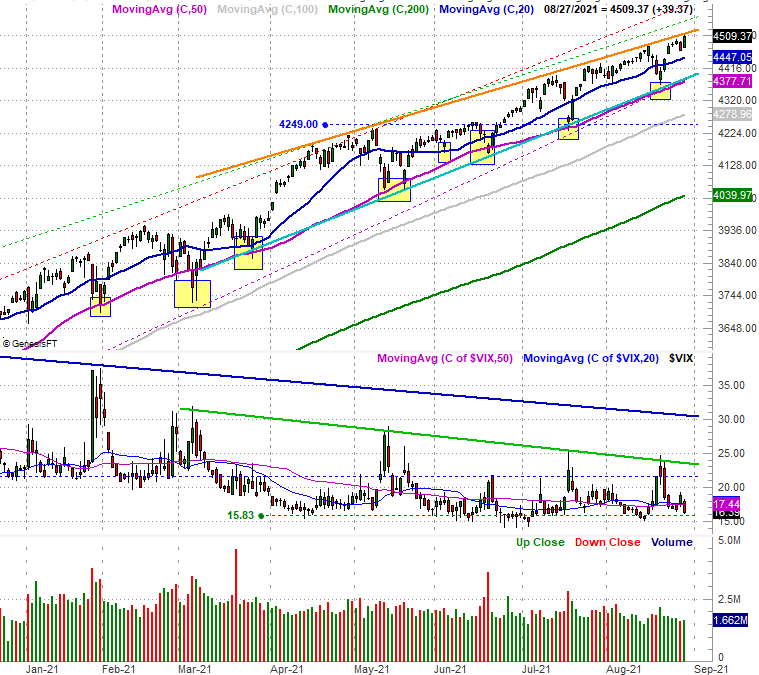 [7]
[7]
Source: TradeNavigator
The NASDAQ Composite, however, did the deed, accomplishing what the S&P 500 couldn't by punching through its key technical ceiling (light blue) at 15,025 to close out the week at 15,129.5. With that hurdle now in the rearview mirror, there's not another technical resistance level until you get to 16,556 (red, dashed)… a ceiling that's also rising.
NASDAQ Composite Daily Chart, with VXN
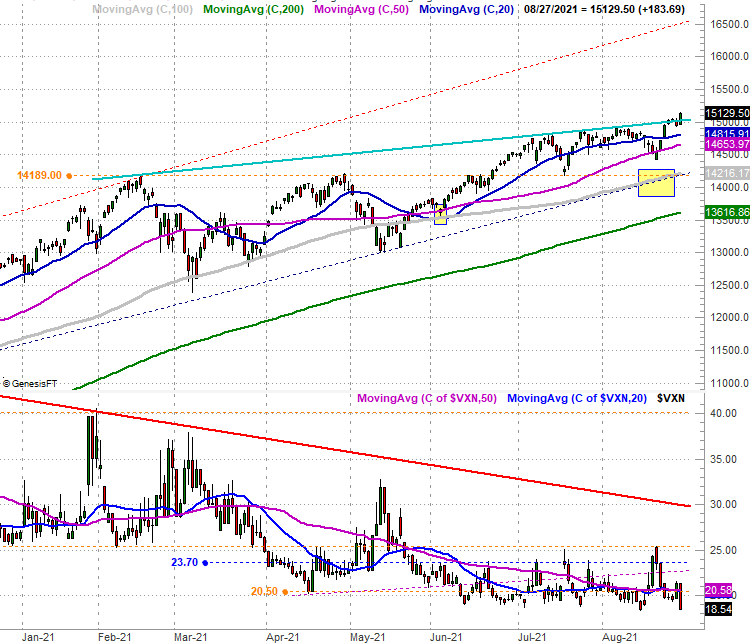 [8]
[8]
Source: TradeNavigator
Don't be too quick to jump to a bullish conclusion here, however, for a handful of reasons. Chief among these reasons is that, somehow — despite the huge rally on Friday — the rally itself wasn't especially well supported.
The chart below is one regular BigTrends readers have seen before, comparing the NASDAQ's daily advancers to its decliners, and comparing its daily "up" volume to its "down" volume. Most of the NASDAQ's listing made some sort of bullish progress on Friday, but the amount of volume behind the buying was not really any better than the selling volume. In fact, the bigger-picture problem is still the bigger-picture problem… there's just not a great deal of participation in the latest portion of the long-term advance.
NASDAQ Composite Daily Chart, with Advancers, Decliners, Up and Down Volume
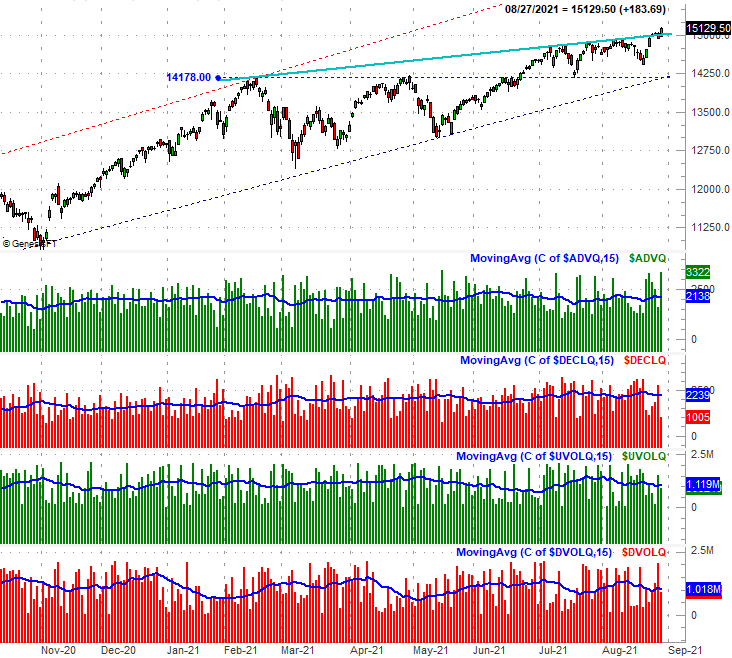 [9]
[9]
Source: TradeNavigator
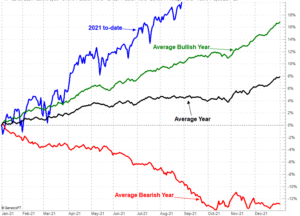
Another reason to worry the NASDAQ's technical breakthrough may not end up going anywhere is, stocks are already so far ahead of where they'd normally be at a time of year when the market starts to take a breather.
The graphic below tells the tale. The S&P 500 is up a little over 20% year-to-date, where it would normally be (on average) up 4.7%. Even in a bullish year the index would only be up about 10.3% at this point, and in both cases we typically bump into a September/October headwind. If the bears were going to take a swipe, this would be the time and place to do it.
S&P 500 Annual, Day-by-Day Performance Chart
 [10]
[10]
Source: TradeNavigator
Then there's the uncharted, non-technical reason the NASDAQ Composite's technical breakout doesn't end up going anywhere. That's the fact that the next technical ceiling currently at 16,556 is so far away, traders may think they can't actually reach it… and therefore won't even bother trying to do so. It's a completely-subconscious hurdle, but a hurdle nonetheless.
The super-low VIX and VXN also ultimately work against stocks here.
As momentum followers, we have to assume last week's and Friday's gains mark the bigger, bullish trend until there's a clear reason we can no longer hold that assumption. Thing is, there's room for a bit of selling before we have to reverse that assumption. The S&P 500 would have to slide below its convergence of technical support currently at 4380 (and rising) before the advance is fully broken and a downtrend has taken shape. And even then, there's a chance of recovery after-the-fact. It's the second breakdown below that support that would really get the bearish ball rolling the way it often does around this time of year.