
Stocks mustered a gain last week, but it was so small it meant little. The bulls just have little to no conviction at a time of year that's generally less than steal for the market; June's usually a net-loser.
 [1]Yet, credit has to be given where it's due. The bulls have at least drawn a line in the sand at the absolute best place to make a stand, and they're defending they're turf. A breakout thrust is still within easy reach.
We'll weigh the bullish and bearish arguments below, as always. Firs though, let's review last week's economic reports and preview this week's overloaded report schedule.
Economic Data
All in all a light week last week in terms of economic news, though we did get a couple of items worth a closer look.
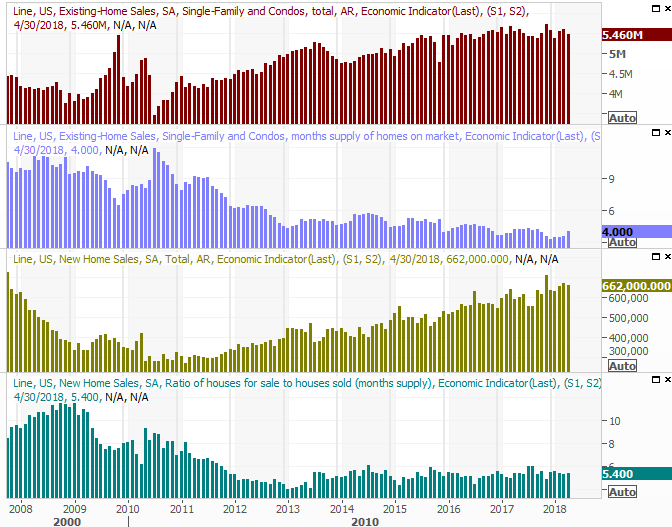
On the real estate front, the mixed message is still tilted bullishly overall. Sales of new homes as well as of existing homes fell short of expectations, and fell short of March's pace. But, the broad trend is still pointed upward. Home prices are still edging higher too, though not at a slower pace.
Home Sales (New and Existing), Inventory Charts
 [2]
[2]
Source: Thomson Reuters
Realistically speaking, higher interest rates are somewhat crimping demand, though not to the degree the screaming headlines would suggest. Then again, April's mortgage rates were still fairly palatable. Since then they've become relatively uncomfortable (even though they're still closer to multi-decade lows than not).
We were planning on taking a look at it, but between the surprising report and the news, we kind of have to now.
We're talking about crude stockpiles and natural gas inventory levels. Both rose last week, extending a respectable, albeit choppy, uptrend. This is the price-crimping increase in inventory we feared the oil companies might create, exacerbated by reports that production of oil is set to grow overseas in response to healthy oil prices.
Crude Oil, Natural Gas Inventory Charts
 [3]
[3]
Source: Thomson Reuters
The only other item of interest from last week was durable goods orders. We're not going to look at a chart. Just know that they were strong when taking planes, trains and automobiles out of the question, but fell an alarming 1.7% when factoring in always-volatile transportation orders.
Everything else is on the grid.
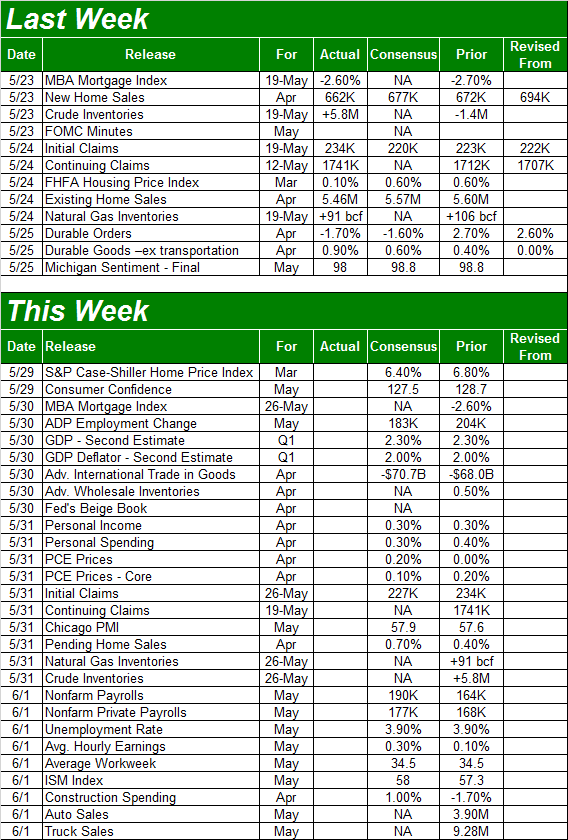
Economic Calendar
 [4]
[4]
Source: Briefing.com
This week is going to be overwhelmingly busy in terms of economic news, made even busier by the fact that we're cramming into just four work days. The grand finale is Friday's jobs report for May, though there's more than a little bit of news to keep tabs on between now and then.
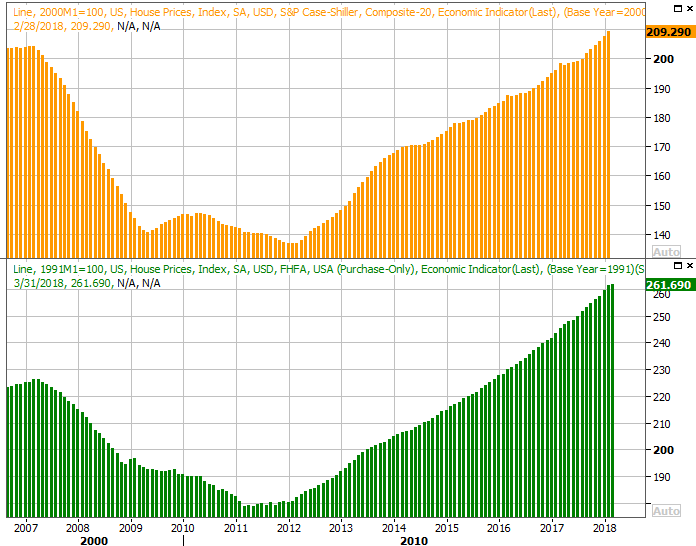
The party starts on Tuesday with the S&P Case-Shiller Home Price Index report, rounding out last week's FHFA Housing Price Index report. As we noted, despite wobbly total sales – by units – prices have been firm, and are expected to remain firm through March's figures. Just bear in mind that much has happened in April in May; those numbers are a little dated.
S&P Case-Shiller, FHFA Home Price Index Charts
 [5]
[5]
Source: Thomson Reuters
No preview chart, but do be aware that the second (of three) GDP growth readings for the first quarter will be posted on Wednesday.
Nothing much happens until Friday, but there's enough happening on Friday to keep things hopping for a while. Namely, we're going to get May's unemployment report and jobs growth numbers, but on that same day we'll also be getting (throughout the day) May's auto sales numbers.
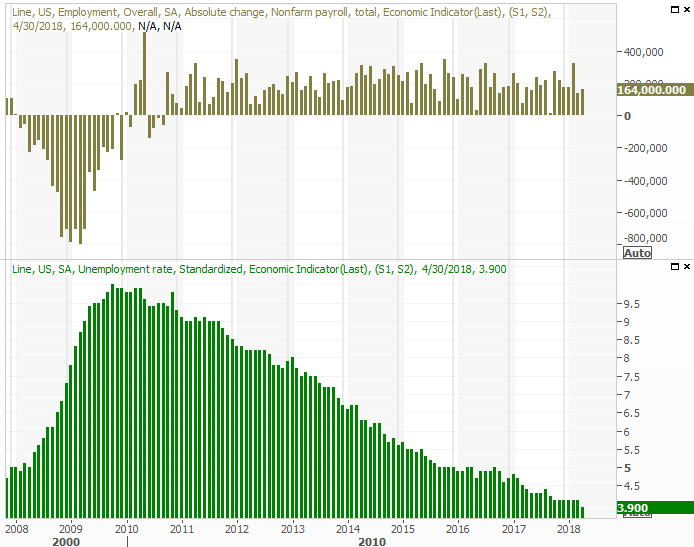
The employment picture has been undeniably impressive, including in the spot it needed to grow next… wages. There won't be much net job growth, and probably not any change in the unemployment rate. Both are about as good as they can get. Look for average hourly earnings growth as a measure of just how strong the job market is now. The pros are expecting firm progress.
Unemployment Rate, Payroll Growth Charts
 [6]
[6]
Source: Thomson Reuters
Food for thought: Wage growth can get too strong, spurring inflation.
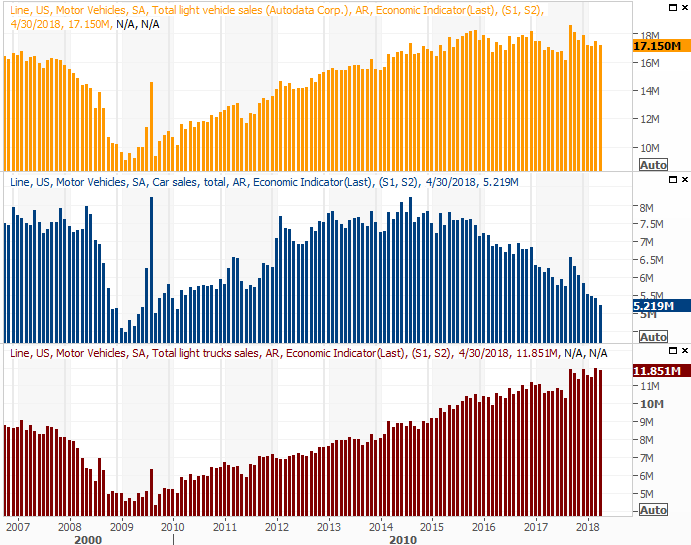
Don't forget to keep your eyes and ears open for car sales figures. They spiked late last year, but have been steadily dwindling ever since. The industry is also hunkering down for a major slowdown, falling victim to their wild success two and three years ago; even truck sales are leveling off. It's too soon for most car owners to replace the ones they bought in 2015 and 2016. Friday's auto sales data may further confirm this situation.
Auto Sales Charts
 [7]
[7]
Source: Thomson Reuters
Index Analysis
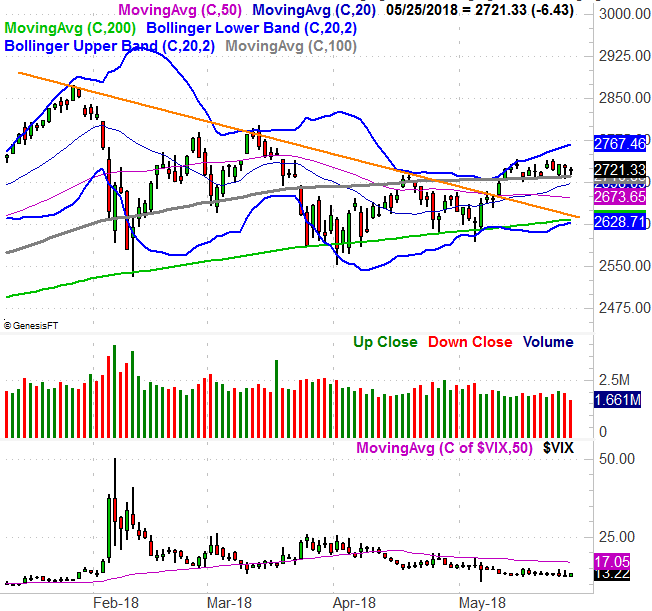
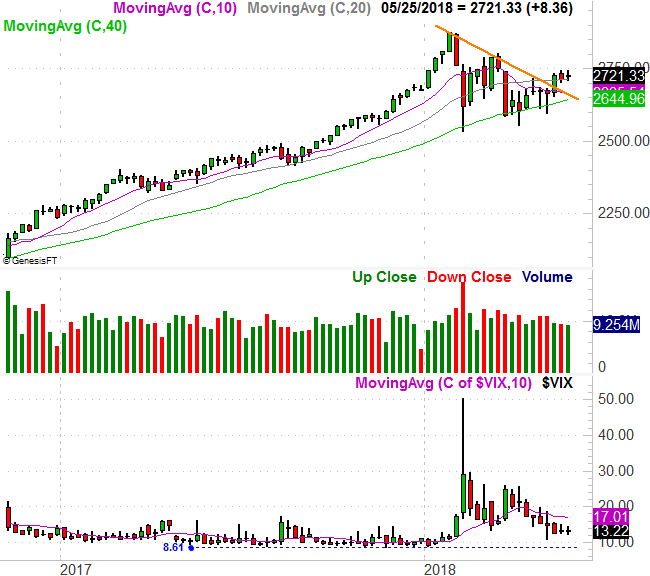
It coulda been better, but it certainly coulda been worse. Though the S&P 500 struggled last week, the bulls held the line at the 100-day moving average line. That's the gray line on the daily chart of the S&P 500 below.
S&P 500 Daily Chart, with VIX and Volume
 [8]
[8]
Source: TradeNavigator
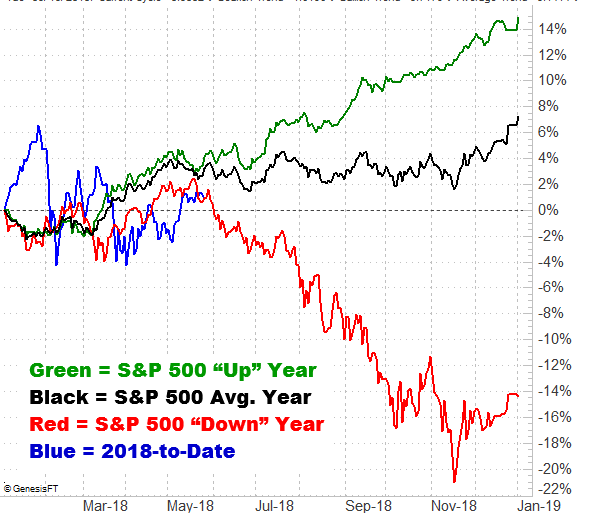
'Not bearish' isn't exactly the same as being bullish though, and things still aren't bullish. The market mostly just waffled last week. Part of that can be chalked up to a confused trader crowd. Part of it can also be chalked up to the calendar though. We're in a slow time of year, and we're headed into what's usually a bearish month. The S&P 500's typical year-to-date performance chart below tells the tale.
S&P 500 To-Date Performance Chart (vs. Average)
 [9]
[9]
Source: TradeNavigator
Zooming out to a weekly chart, we can see the slow-down taking shape. After a huge surge three weeks ago that built on a decisive reversal, the index went from barely higher to no higher at all. Volume (interest) also continues to wane.
S&P 500 Weekly Chart, with VIX and Volume
 [10]
[10]
Source: TradeNavigator
If nothing else, it's an annoying scenario just because things could still easily go either way. If we had to give an edge to one side or the other though, we'd have to give it to the bulls. The indices are above all the key moving average lines, and even if the 100-day line snaps as a support level, there's plenty more technical support just below it. Besides, the VIX has room to keep falling before it hits a more absolute floor around 9.0 (not that the VIX has been a great indicator of market tops of late anyway).
The flaw with the bullish argument? The calendar. Even in a 'good' year, June is usually a bad month. And, we can't help but notice this year's performance so far is following the same basic path as the average bearish year.
Keep close tabs on everything. This remains a day-to-day battle. We'll dissect any breakout or breakdown of and when one takes shape.