The market wasn't entirely sure what it wanted to do for the better part of last week's holiday-shortened trading stretch. But, when push came to shove by the time Friday rolled around, it was the bulls doing all the pushing. The S&P 500 logged a respectable gain of 0.5%, leaving the index within sight/reach of the new multi-week highs hit just the week before.
 [1]Maybe this June is going to be an exception to the norm and give traders the breakout move that (sort of) appears to be setting up. But, we continue to be suspicious. Politics and headlines have hijacked the market, but that rhetoric changes on a daily basis at a time of year that isn't usually a bullish phase.
We'll look at…. everything below, after a run-down of last week's economic news and a preview of this week's announcements.
Economic Data
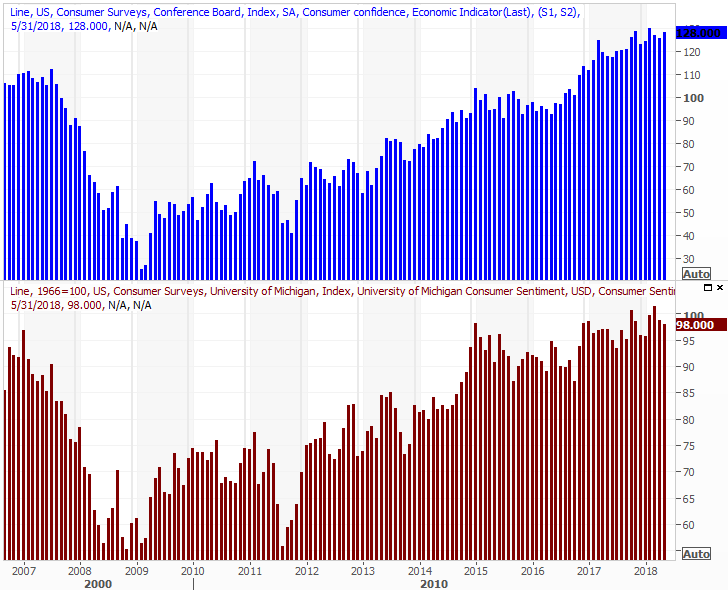
There's no getting around the fact that last week's economic highlight was Friday's amazing jobs report for May. But, we'll save that for the grand finale. Rather, we'll more or less hit the highlights more or less in order of appearance, beginning with a look at the Conference Board's consumer confidence score for last month. The reason of 128.0 was near a multi-year high, suggesting consumers aren't really sweating all the political bickering or the market's volatility. That uptrend is being matched by the University of Michigan's similar sentiment measure.
Consumer Sentiment Charts
 [2]
[2]
Source: Thomson Reuters
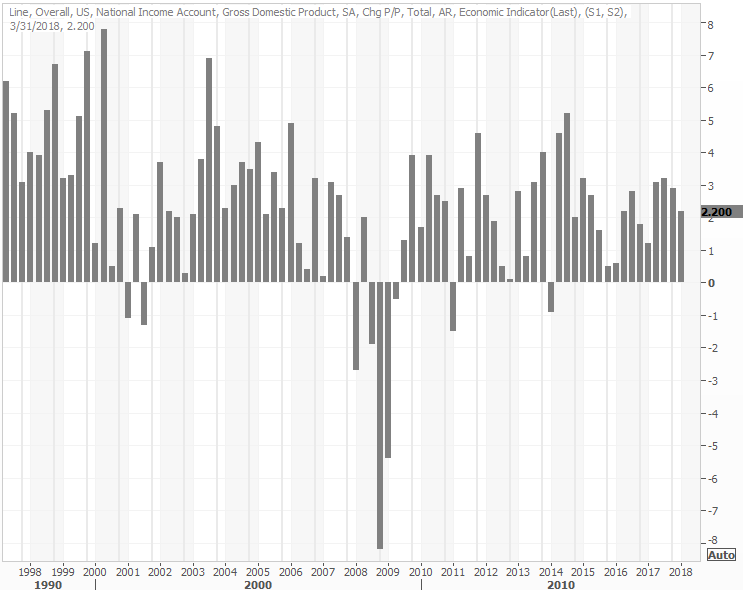
We didn't preview it a week ago, not expecting any real changes. But, Q1's initial GDP growth reading of 2.3% was dialed back to only 2.2%. The third and final reading will be posted later this month, though changes between estimates #2 and #3 are even rarer than changes between #1 and #2. Either way, 2.2% growth isn't a bad score. For the economy to really achieve escape velocity though, we probably need a little more.
GDP Growth Charts
 [3]
[3]
Source: Thomson Reuters
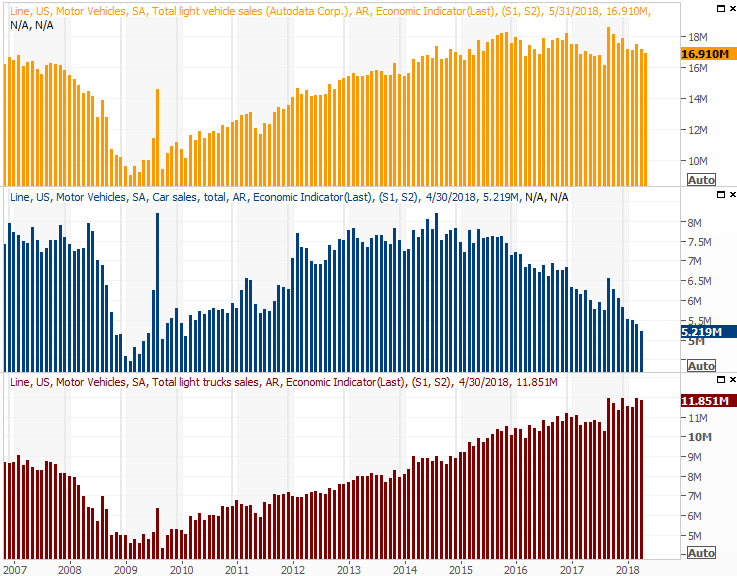
One of the big news items that was overwhelmingly obscured by the jobs report was Friday's auto sales reports for May. They were… ok, though mixed. The pros were calling for about a 3.5% year-over-year improvement, and that's more or less what they got. Not every manufacturer drove the sales gains they were hoping for though.
On an annualized basis, the overall sales pace fell a bit, to 16.9 million. Growing disinterest in passenger vehicles continues to pose problems, but it's not clear the increasing preference for trucks and SUVs is offsetting waning demand for sedans and sedan-like vehicles. Truck and SUV sales seem to be… leveling off, though that's not a decided, certain assessment. Definitely worth watching closely.
Auto Sales Charts
 [4]
[4]
Source: Thomson Reuters
Car manufacturers, by the way, certainly weren't shy about putting a positive spin on May's sales reports.
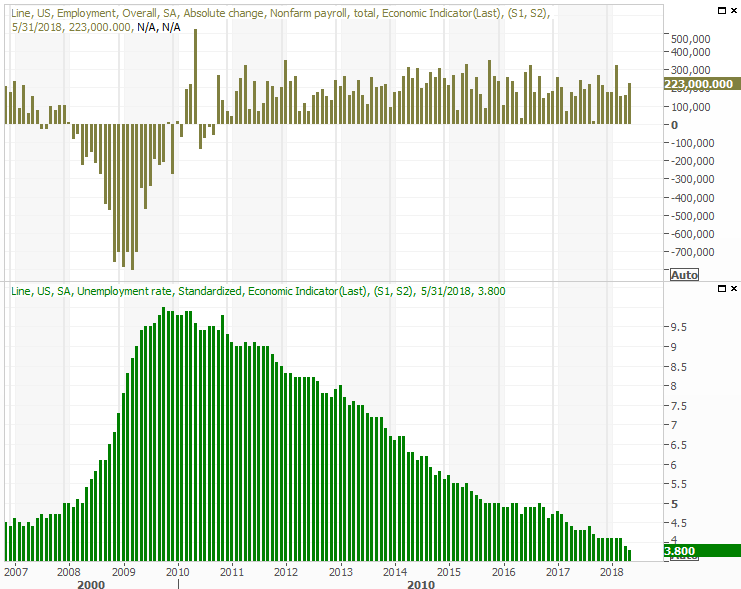
The proverbial big Kahuna, of course, was Friday's jobs report for May. It was, putting it bluntly, great. The unemployment rate fell to a multi-year low of 3.8% on payroll growth of 223,000 jobs. Wage growth was pretty solid too. There's no denying the jobs aspect of the economy is doing its part.
Unemployment Rate, Payroll Growth Charts
 [5]
[5]
Source: Thomson Reuters
The strong employment market is a big part of the reason consumer confidence remains so firm against a backdrop of political uncertainty, and even market gyrations.
We took a detailed look at the jobs report at the website, right here: https://www.bigtrends.com/education/markets/mays-jobs-report-leaves-critics-very-little-to-gripe-about
Everything else is on the grid.
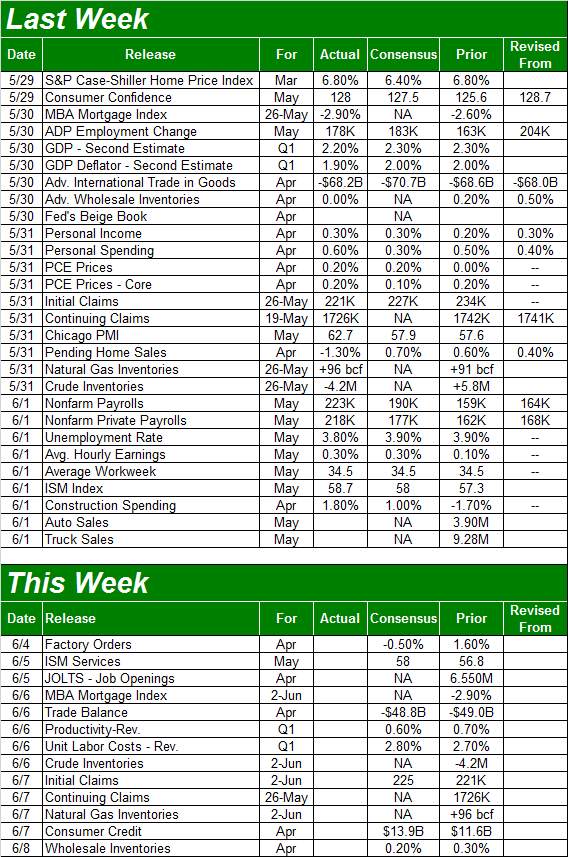
Economic Calendar
 [6]
[6]
Source: Briefing.com
This week is going to be a much easier one to process. In fact, there are only a couple of reports we're interested in, and we're not overly interested in either one.
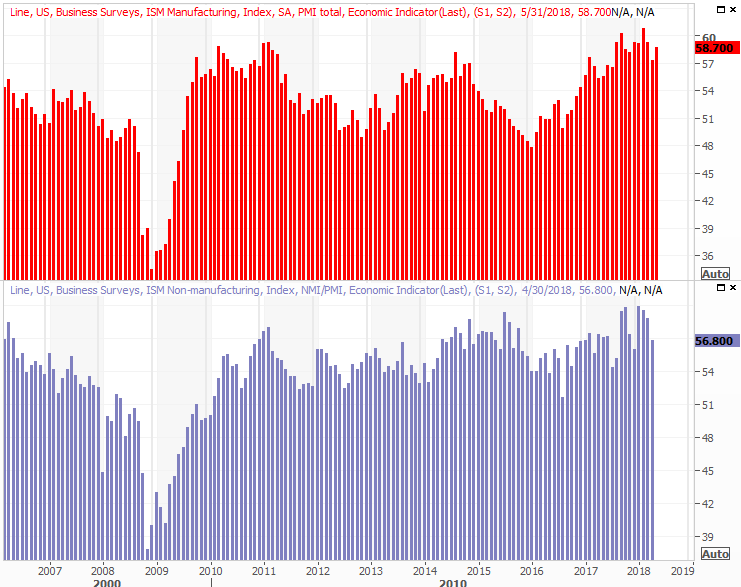
The first of those is the ISM Services Index update due on Tuesday, which will round out last week's update of the ISM Manufacturing Index. Analysts are expecting a respectable increase from 56.8 to 58.0, mirroring the rise in the manufacturing version of the measure.
ISM Index Charts
 [7]
[7]
Source: Thomson Reuters
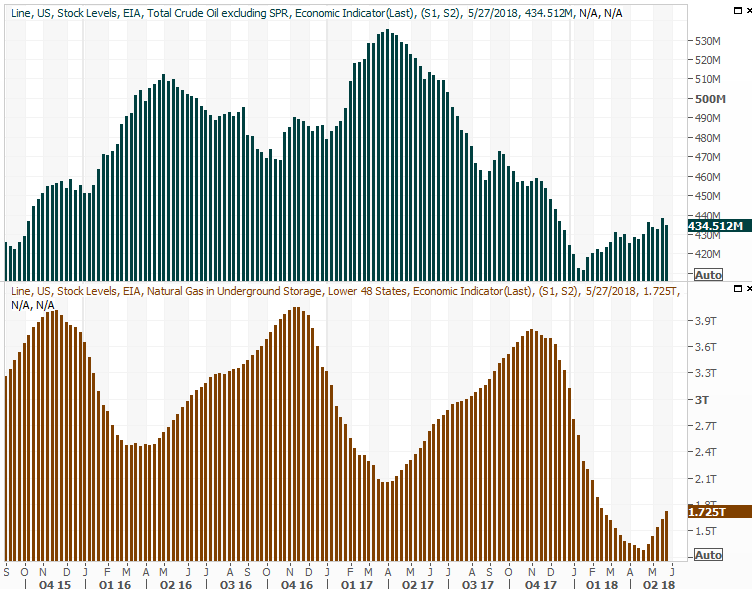
The other economic announcement you'll want to keep an eye out for – while you have time – is Wednesday's look at the nation's crude oil (and natural gas) stockpile. It's been generally edging higher, though not in a straight line. Nevertheless, the increasing inventory levels don't exactly jibe with oil's still-firm prices; the fear that production outages could happen all over the world are only just that… "fear of.' it's not actually happening yet. Just something to keep in mind.
Crude Oil, Natural Gas Inventory Charts
 [8]
[8]
Source: Thomson Reuters
Index Analysis
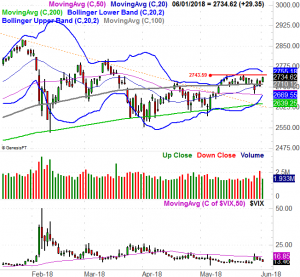
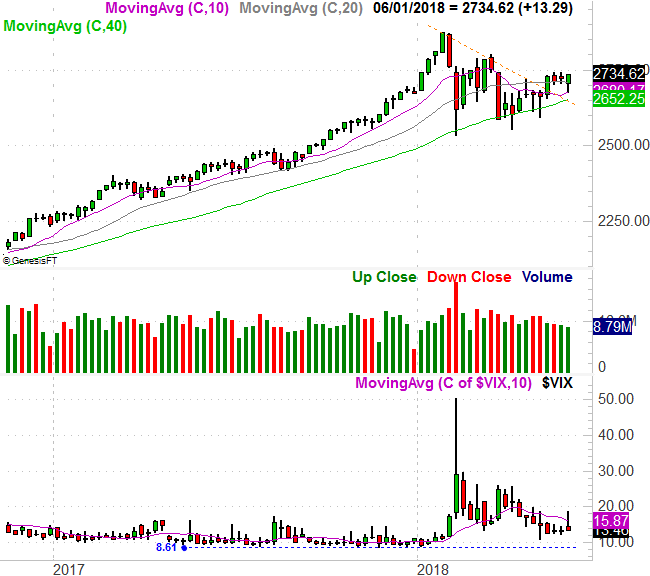
After dancing with danger on Tuesday – the first trading day of last week – the bulls mustered some inspiration and pushed the S&P 500 back above all of its key moving average lines to rekindle the bigger-picture uptrend. It was a less-than-ideal move, with both winning days of last week unfurling on low volume, while the two down days were both on higher volume. But, it's something to build on.
S&P 500 Daily Chart, with VIX and Volume
 [9]
[9]
Source: TradeNavigator
There's still some resistance to hurdle. Namely, the index will need to push its way above the high of 2743 hit a couple of weeks ago to get going in earnest. That would also carry the S&P 500 above its upper Bollinger band line… which has been a reversal point several times in recent weeks. If the market can clear it, that's huge. That's a huge "if" though, at a time of year when stocks are fighting an uphill battle.
Zooming out to a weekly chart of the S&P 500 we get a slightly more bullish sense of things. The index is still above a falling resistance line (dashed) that it broke above four weeks ago, and last week's long tail is a bullish reversal clue in and of itself. It's also in the weekly timeframe we can see the VIX has some room to slide lower before reaching a more absolute low of around 8.6.
S&P 500 Weekly Chart, with VIX and Volume
 [10]
[10]
Source: TradeNavigator
Since the market's on the fence until the S&P 500 hurdles 2743 or breaks below the 200-day moving average line (green) currently at 2639, it would be wise to look at other, indirectly-related charts that will impact stocks.
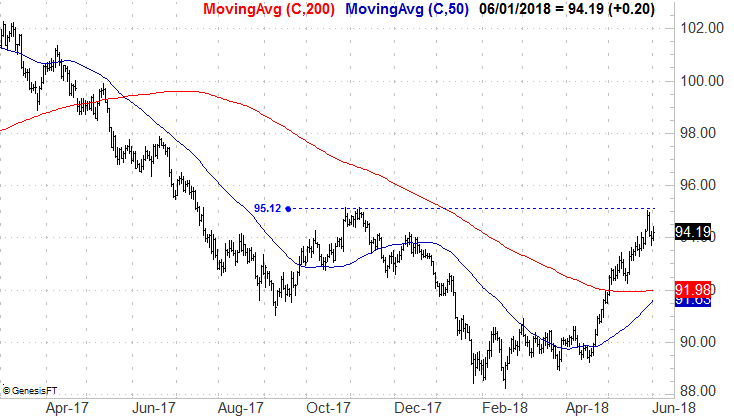
Chief among those charts right now is the value of the U.S. dollar. It has been on a tear since late April, but that rally is slowing down now, after the U.S. Dollar Index bumped into the same high it reached in November. It looks like that speculation-driven rally has finally started to burn itself out. A low under Thursday's low of 93.72 will likely confirm the downward reversal is taking shape.
U.S. Dollar Index Daily Chart
 [11]
[11]
Source: TradeNavigator
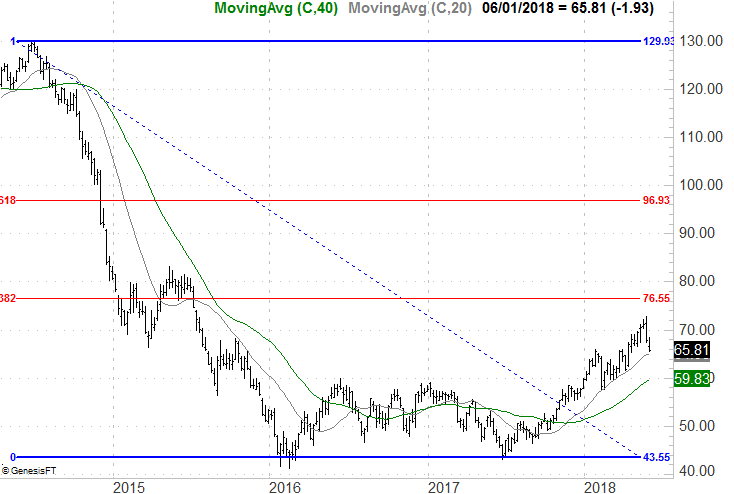
To the extent the dollar is impacting oil prices, a falling dollar will help revive the oil price rally that seems to have petered out over the course of the past several days.
Crude Oil Prices Daily Chart
 [12]
[12]
Source: TradeNavigator
Helping to send oil prices lower of late is a sustained increase in stockpiles, as was charted above. That's reasonable in a superficial sense, though oversimplifies how oil is priced. The bigger oil price trend is still pointed upward, and we believe crude prices will ultimately edge higher again based on a combination of a weakening dollar, growing demand stemming from economic strength, and an energy sector that may not have reached its production limit yet, but is getting close. A break above 76.50 per barrel would actually be a bullish catalyst.