 [1]Stocks were due for a breather. Last week they finally got it.
Of course, in this unusual environment that dishes out extremes (and often unfettered) rallies and pullbacks, last week's weakness also poses the distinct possibility that a much bigger correction is now underway. The market did, after all, bump into a well-established ceiling. On the other hand, Friday's tumble left the door wide open to a quick rebound early this week.
We'll show you how and why below. First, let's take a look at last week's economic news and preview this weeks. With earnings season winding down, a couple of this week's data nuggets have the potential to be the big market movers.
Economic Data
Last week was rather light in terms of economic announcements. In fact, there was only one data set of interest, but it was a biggie… July's inflation data. It's still on the rise, for consumers as well as producers. In fact, it's continuing to press onward and upward to concerning levels.
Inflation Charts
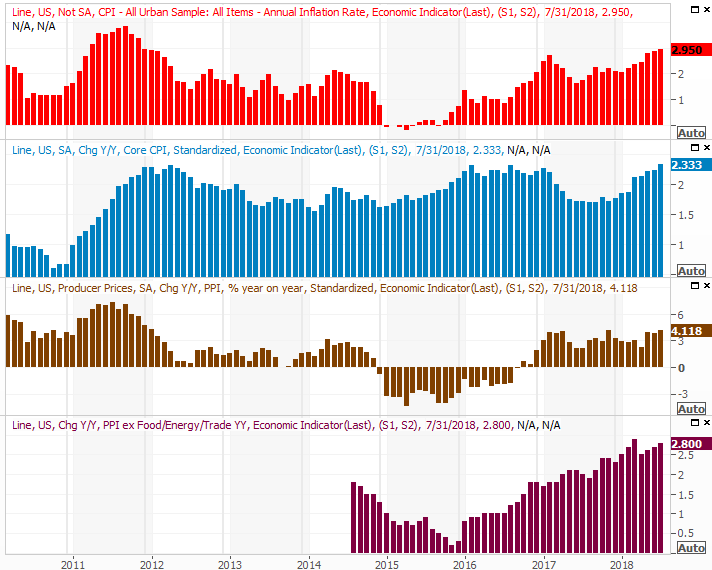 [2]
[2]
Source: Thomson Reuters
As of the latest look, the overall, annualized consumer inflation rate is 2.95%. That's the highest it's been since 2011. Though the root cause of the rise in inflation is a strengthening economy, the Fed has little choice but to proceed with its planned rate hikes.
Everything else is on the grid.
Economic Calendar
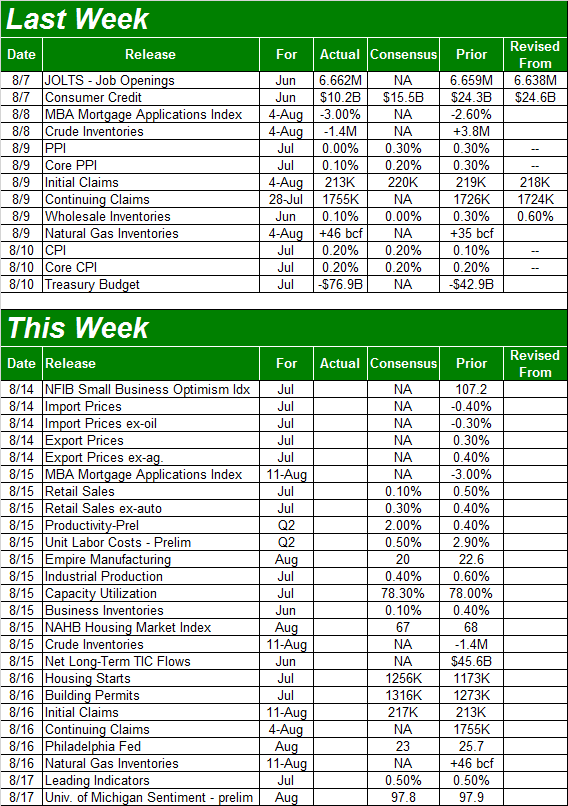 [3]
[3]
Source: Briefing.com
This week is going to be considerably busier. We'll only be able to preview the highlights.
The party starts on Wednesday, when we'll hear about last month's retail spending. Sales are once again expected to rise, with or without automobile sales factored in. The ongoing improvement in consumerism bodes well for the U.S. economy, which is two-thirds driven by consumers rather than corporations.
Retail Sales Charts
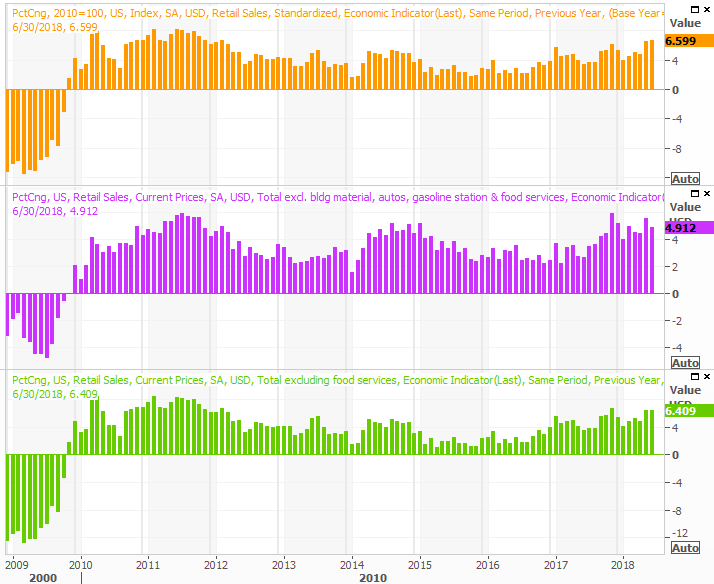 [4]
[4]
Source: Thomson Reuters
Also on Wednesday we'll hear about last week's industrial productivity and how much of the nation's manufacturing capacity was used… possibly the most important yet most-overlooked economic data we get on a monthly basis. Economists are looking for more progress from both measures.
Industrial Production and Capacity Utilization Charts
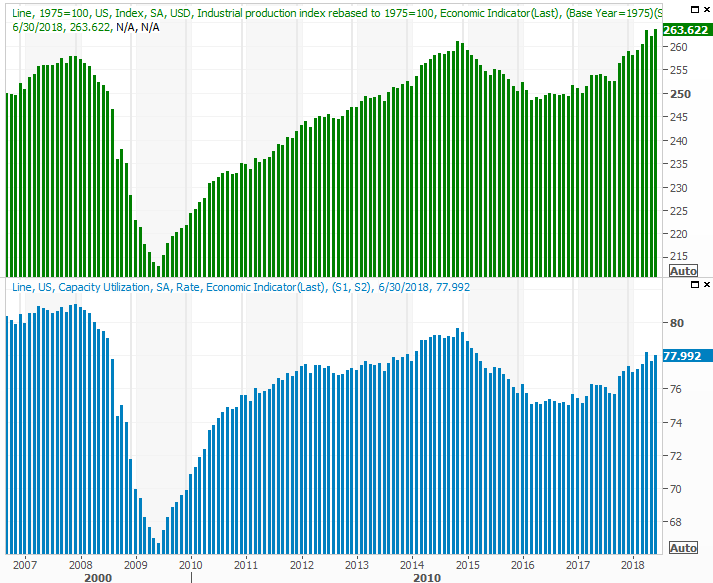 [5]
[5]
Source: Thomson Reuters
On Thursday we'll hear about July's housing starts and building permits. We need an encouraging sign on this front. Builders have been slow to take on new projects of late, and real estate sales activity has been slowing as well. It's not entirely clear why… chalk it up to the "chicken or egg" argument. Either way, the pros are looking for a small boost this week for starts and permits.
Housing Starts and Building Permits Charts
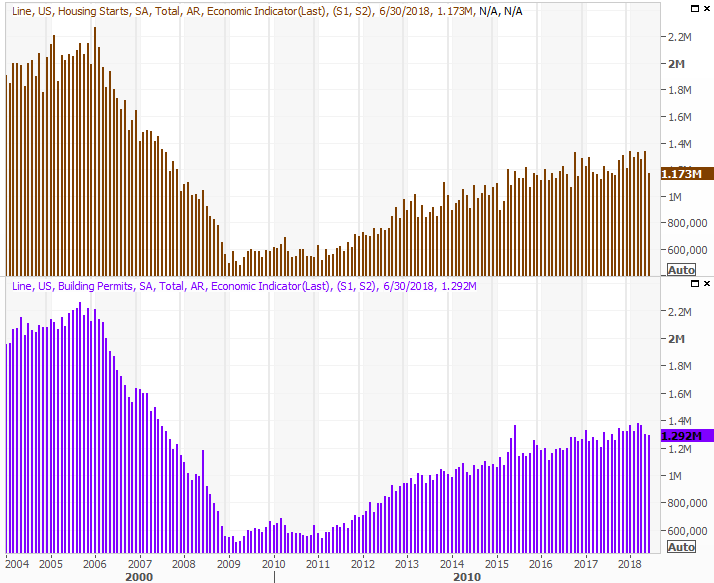 [6]
[6]
Source: Thomson Reuters
Index Analysis
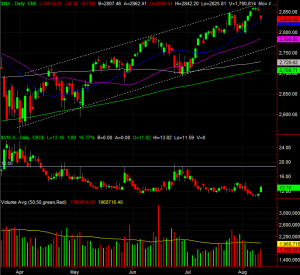
All major corrections start out as small stumbles. That's why last week's lull, though minor, is a worry. The market's been persistently bullish but almost eerily so. To the extent one can just sense it, we feel overdue for a sizeable correction.
If the bears were going to use last week's weakness as an opportunity to get that ball rolling though, they sure didn't do themselves any favors.
Chief among their problems is the gap the S&P 500 left behind at the open. Generally speaking [though there are certainly exceptions to the rule of thumb], traders don't like to leave gaps unfilled. If that tendency applies now, then the S&P 500 should sooner or later at least hit Thursday's low of 2851.95. Of course, that could happen at any time in the future – the market's (super)long-term trend is always 'up.'
S&P 500 Daily Chart, with VIX and Volume
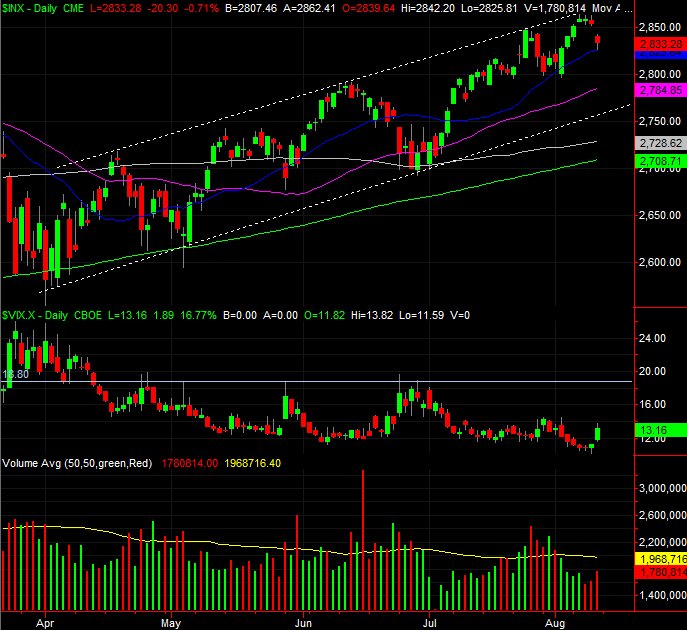 [7]
[7]
Source: TradeNavigator
You'll also notice where Friday's selling stopped and the buyback began again… at the 20-day moving average line (blue). This is where the bulls have their best shot at mounting a defense, and so far, so good.
There are a couple of vulnerabilities ahead too, however. As you can also see on the daily chart above, the S&P 500 has been bouncing around a rising trading range — framed in white, dashed lines — that's pushed the index higher since April. If the pattern repeats itself, the index is due for a pullback to 2780, give or take.
That's a big "if," of course.
Zooming out to the weekly chart of the S&P 500 we can gain a bit more perspective, though the bigger-picture view of the market forces us to make a tough decision. It's here we can see the market has been no stranger to prolonged rallies that started not unlike what we've seen since April; just go back to late-2016 and all of 2017 for proof. On the flipside, it's always dangerous to assume the present has to be like the past.
S&P 500 Weekly Chart, with VIX and Volume
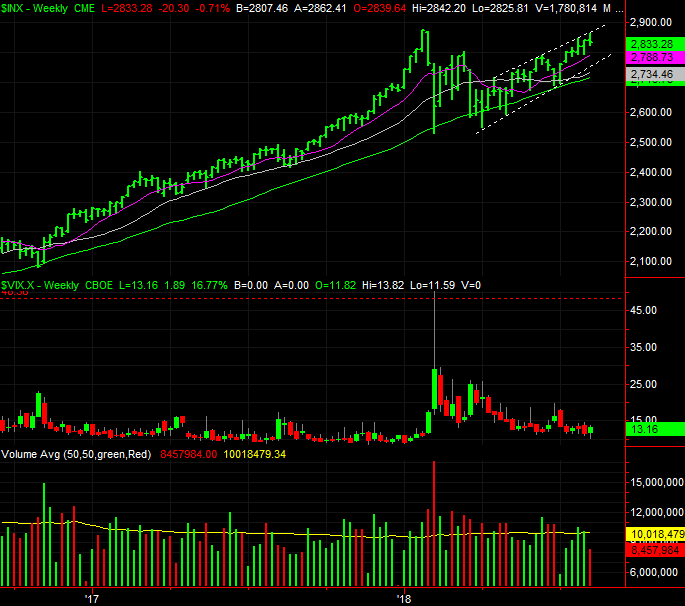 [8]
[8]
Source: TradeNavigator
It's also on the weekly chart we can see just how low the VIX has been, but also get the sense that the proverbial hammer of the VIX's trigger is pulled back, ready to be released and shoot it higher. Such an event could be a major problem for the market.
Again though, that's a big "if." Stocks have been oddly unpredictable of late, in good ways and bad.
Other annoying realities to chew on:
- Investors may be subconsciously aiming to push the S&P 500 to a new record high above 2872.87, but if and when that happens, they could easily lose interest in remaining bullish.
- Even if the 20-day moving average line fails to hold up as support, any of the other moving average lines all the way down to the 200-day moving average line (green) currently at 2709 could end up acting as support, rekindling the bigger-picture uptrend.
- For better or worse, headlines have hijacked the market. The right or wrong tweet, the right or wrong comment from the Fed, and even the right or wrong earnings report could catapult or crush stocks, by forcing investors to temporarily suspend the perceived importance of actual fundamentals.
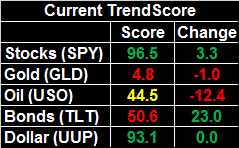
Our take? This is a case where you may as well play the game, like it or not. The chart's still mean something, and should be watched closely. If news is the key though, don't fight the tape. Just keep in mind it's all short-term stuff right now.