
Stocks followed through on the previous week’s big bullish reversal last week. But, it was a tepid, low-volume effort that calls into question of the move can keep going. We’d still argue there’s not enough “umph” behind the move to be a highly-convicted bull. But, never say never. Mostly we ended last week on the fence.
We’ll take a detailed look at the whole shebang in a moment. Let’s first recap last week’s bigger economic news and preview the announcement in the lineup for this week. It’s a particularly big week for real estate.
Economic Data Analysis
Actually, the real estate ball got rolling last week with Friday’s look at last month’s sales of existing homes. The National Association of Realtors reports sales of already-built houses edged a little higher again in December, to an annualized pace of 4.24 million units. It’s still too soon to call this a rebound, but it’s a step in that direction.
New, Existing Home Sales Charts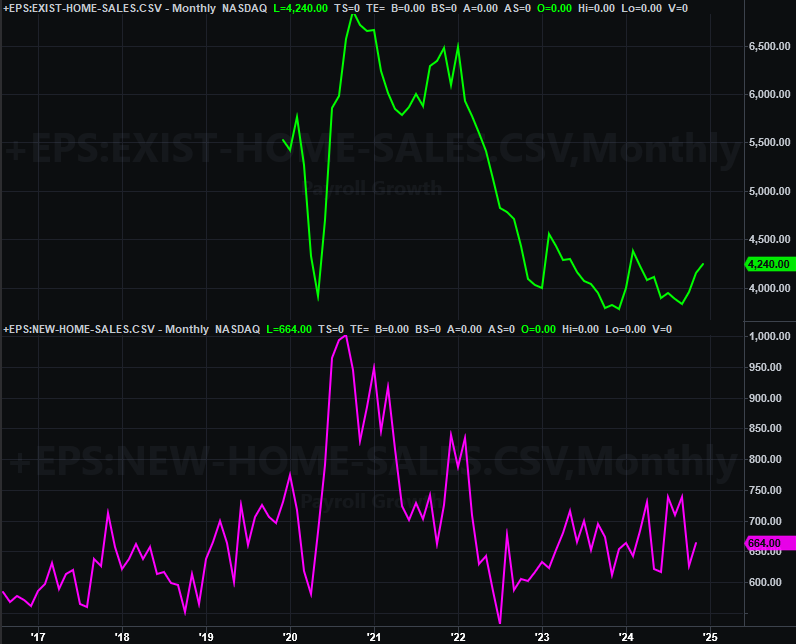
Source: Census Bureau, National Assn. of Realtors, TradeStation
Last month’s new home sales data will be posted on Monday of this week. Forecasters are calling for another slight improvement, but like existing home sales, it’s still tough to call this the clear beginning of a recovery.
The University of Michigan’ sentiment index ended up falling a bit for January (not yet shown on the chart below), to a reading of 71.1, temporarily interrupting what looks like decided improvement. Nonetheless, the bigger picture is still pointed upward.
Consumer Sentiment Charts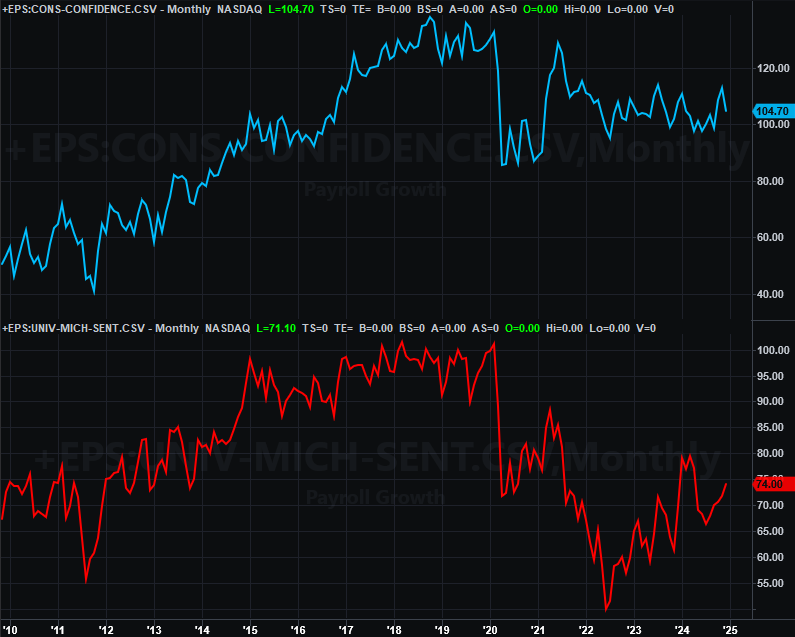
Source: Conference Board, University of Michigan, TradeStation
That’s not quite the case for The Conference Board’s consumer confidence reading, which fell slightly for this month, leaving the data locked in a sideways range. [Note that this data is also not yet updated on the chart above.]
Everything else is on the grid.
Economic Data Report Calendar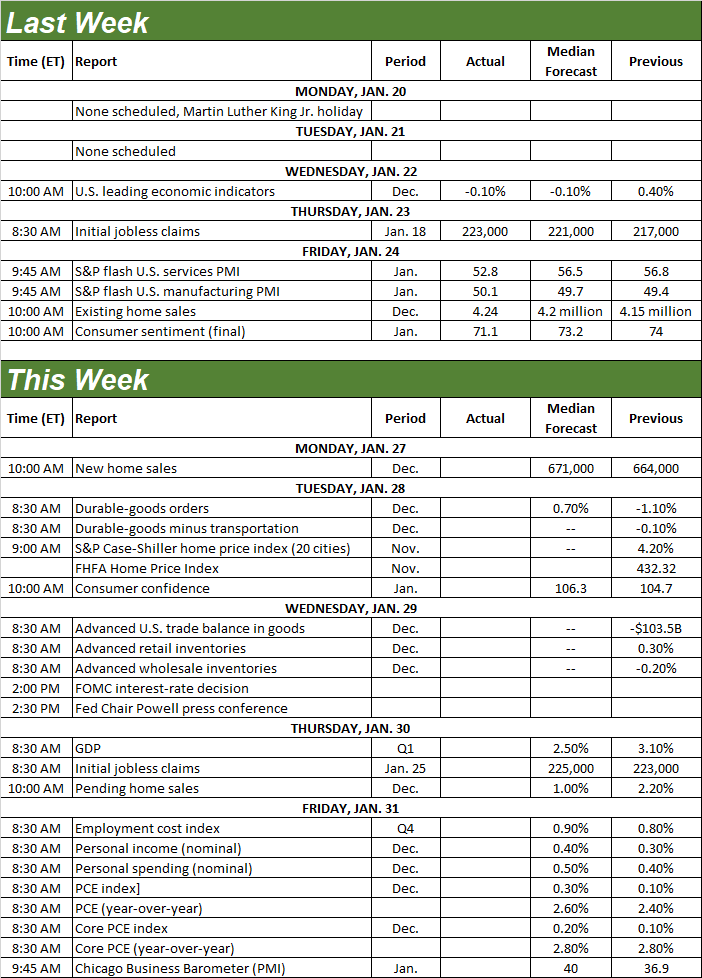
Source: Briefing.com, TradeStation
This week isn’t terribly busy, but we are getting some doozies. Chief among them of course is Wednesday’s decision regarding interest rates. The Fed Funds Rate currently stands at a target of around 4.25% to 4.5%. And, traders are saying there’s a 99% chance that’s where they’ll remain even though the FOMC has a scheduled chance to change them.
We may have a better understanding of why this is the case on Friday, when we get last month’s personal income and consumer expenditure data. Both were up firmly even if not aggressively for November, indicating people are comfortable spending their higher incomes, thus keeping prices at relatively inflated levels. Economists believe these pay-raises and subsequent spending growth will do so again this time around. Cutting rates here could potentially wave the flames of inflation again.
In any case, we’ll be rounding out the real estate picture on Tuesday of this week, with the S&P Case-Shiller and FHFA Home Price Indexes for November. Both are likely to roll in above year-ago levels (again), although the Case-Shiller Index is clearly slumping since June’s high while the FHFA’s measure continues to drive into record territories.
Home Price Index Charts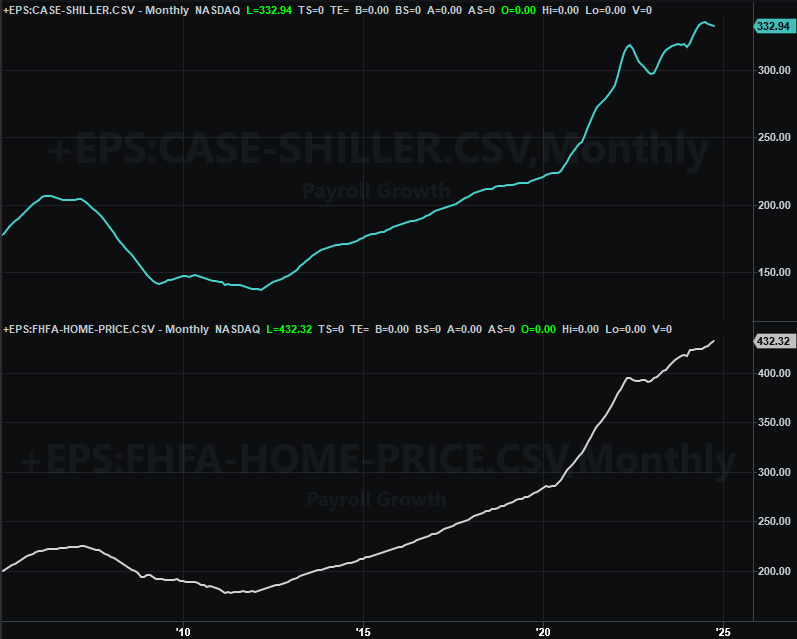
Source: Standard & Poor’s, FHFA, TradeStation
It’s decreasingly clear why there’s a disparity here. At one point we presumed it may be because higher-priced homes in and around metropolitan areas were losing value as people moved toward more rural areas… and requested FHFA loans that aren’t offered to those looking for more expensive homes. And, this still may well be the case. The argument for this prospect doesn’t feel as solid as it did just a few months ago though.
Stock Market Index Analysis
It wasn’t a bad week. The S&P 500 ended up gaining 1.7%. That’s slower than the prior week’s advance, but still solid… particularly for a four-day trading week. The index even managed to touch record-high territory, eclipsing the early-December peak at 6,093. And, as the daily chart of the index shows us, there’s still room for the S&P 500 to continue running higher before encountering their next technical ceiling.
S&P 500 Daily Chart, with VIX and Volume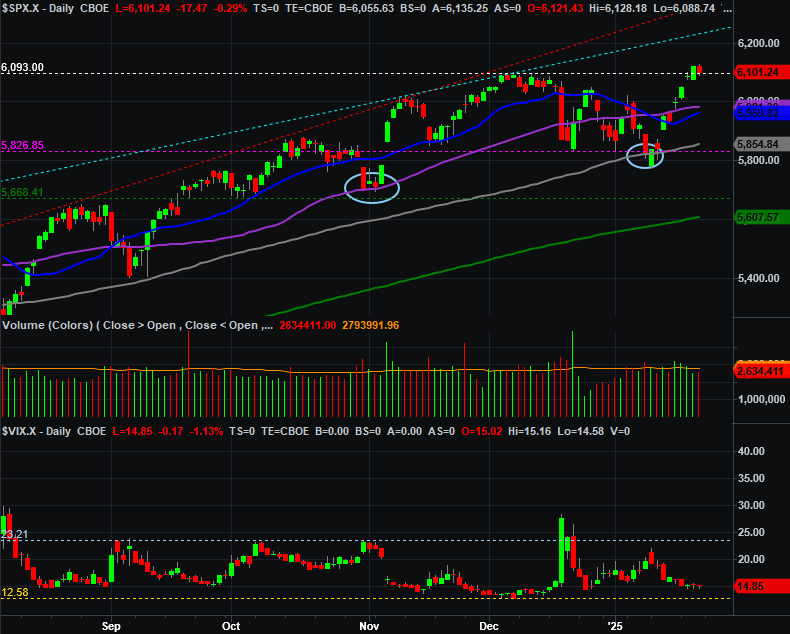
Source: TradeNavigator
Here’s the weekly chart of the S&P 500 for a little more perspective… particularly in terms of where the index currently is relative to its long-term rising trading channel. There’s room before the S&P 500 bumps into the lower of this upper boundary (light blue, dashed), and further still from the other, higher upper boundary (red, dashed) of this bullish channel. The bigger-picture momentum, of course, is bullish.
S&P 500 Weekly Chart, with VIX and MACD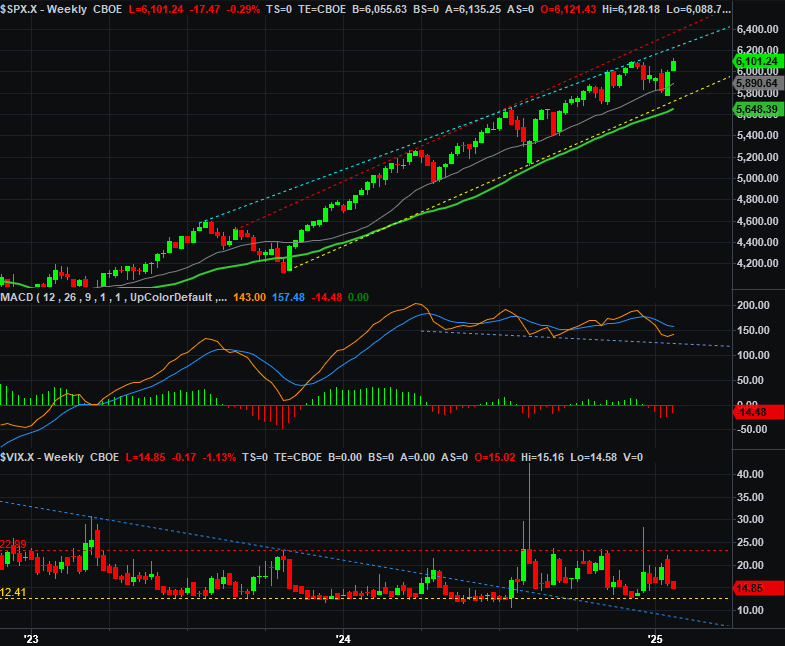
Source: TradeNavigator
That doesn’t necessarily mean the index is going to continue making its way higher. As both the weekly and the daily chart of the S&P 500 both show us, the market has been more likely to reverse course after just a few days’ worth of up or down moves whether or not there was a clear technical reason for a reversal. To this end, the fact that the S&P 500 is in a proverbial no-man’s land now — neither at support or resistance levels — underscores just how undecided traders are here. Underscoring this indecision is the fact that despite the market’s forward progress last week, the volume behind the move was never enormous, and waned as the bullish week wore on.
The NASDAQ Composite doesn’t look a whole lot different. Last week’s 1.7% advance wasn’t as big as the previous week’s rally. Indeed, the index didn’t quite touch new-high territory (and the advance was never making progress on great volume). A gain is a gain though, and like the S&P 500, there’s room for the composite to keep climbing before bumping into any real resistance.
NASDAQ Composite Daily Chart, with VXN and Volume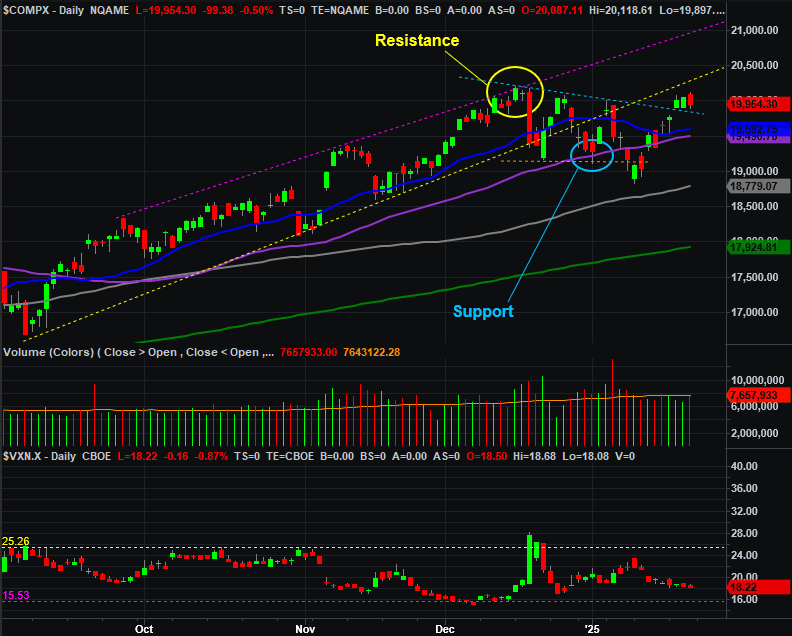
Source: TradeNavigator
The NASDAQ is, however, much closer than the S&P 500 is to the upper edge of its rising channel. It could be there soon, bringing an end to the effort. Notice the NASDAQ’s volatility index (VXN) is also near something of an absolute floor around 15. Once at that level, it will become much more difficult for the composite to keep climbing. Odds are good the VXN and the NASDAQ itself will reach its floor and ceiling (respectively) around the same time.
NASDAQ Composite Weekly Chart, with VIX and MACD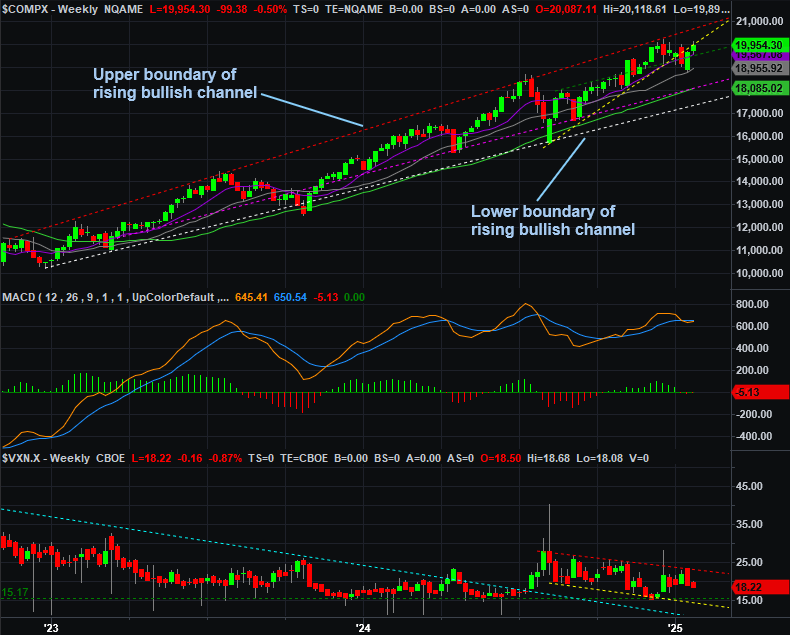
Source: TradeNavigator
The real underlying issue here, though, is the fact that the market hasn’t suffered a healthy setback in quite some time… and really needs one. This makes any continued bullishness a bit risky simply because it raises the amount of potential profit-taking if-and-when the tide finally turns.
Even then, however there’s plenty of support anywhere from 5% to 15% below where either index could end up peaking. That’s the degree of correction we’d like to see during a bull market — not more, and not less — to hit the overall market’s proverbial reset button. Until we get that, any bullish effort is apt to peter out pretty quickly.