The market may have ended last week on a high note, but it still ended the five-day stretch with a sizeable loss. All told, the S&P 500's close of 3825.33 on Friday was still 2.2% below the previous week's last trade, leaving the index (and all the rest of them) trapped between falling support and resistance lines.
In other words, it's way too soon for the bulls to start celebrating. The calendar itself only makes such a celebration even less appropriate.
We'll show you exactly why below… with pictures. First though, let's recap last week's biggest economic news and take a look at what's in store for this week. There are some heavy-hitters in the lineup.
Economic Data Analysis
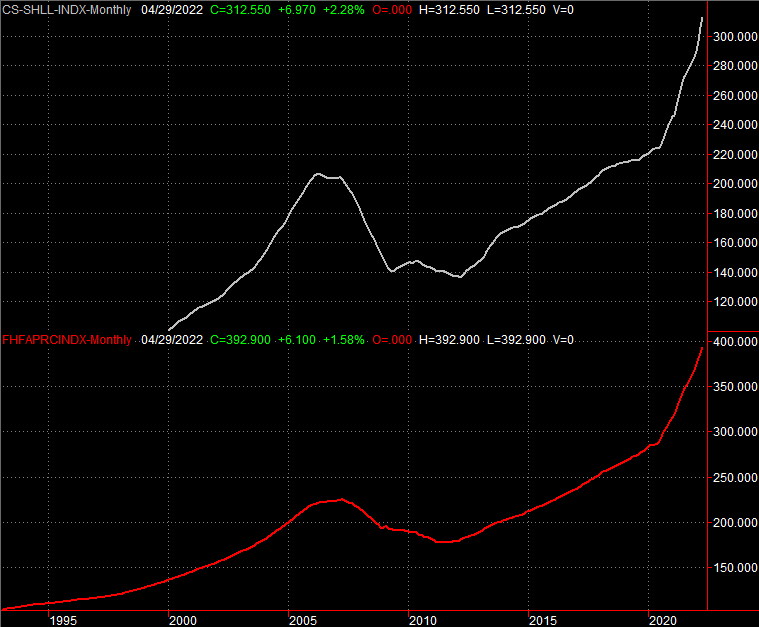
Last week wrapped up June's look at the most recent real estate picture, with the FHFA Housing Price Index and the S&P Case-Shiller Home Price Index both being posted on Tuesday. Both continued long-standing uptrends, with the FHFA's measure up 1.6% from the prior month's, and the Case-Shiller figure up 21.2% year-over-year. Although the data is a bit dated – for April rather than May – the slowdown in lending and purchasing activity was underway than, and inventory was finally starting to swell. It just didn't matter. At the very least, the homes that are being bought and sold are at least holding their value.
Home Price Charts
 [1]
[1]
Source: Standard & Poor's, FHFA, TradeStation
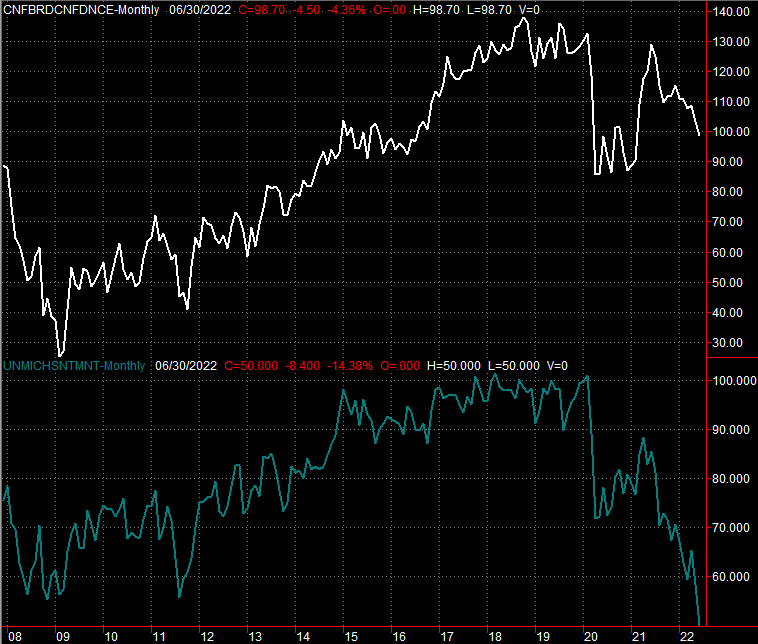
And that's surprising, in light of the fact that consumer confidence was already in a freefall at that point. It fell considerably more last month. The Conference Board's consumer confidence measure slipped from 103.2 to 98.7, in fact, blowing past expectations of 101.0, mirroring a similar plunge from the University of Michigan Sentiment Index seen over the course of the past several months.
Consumer Sentiment Charts
 [2]
[2]
Source: Conference Board, University of Michigan, TradeStation
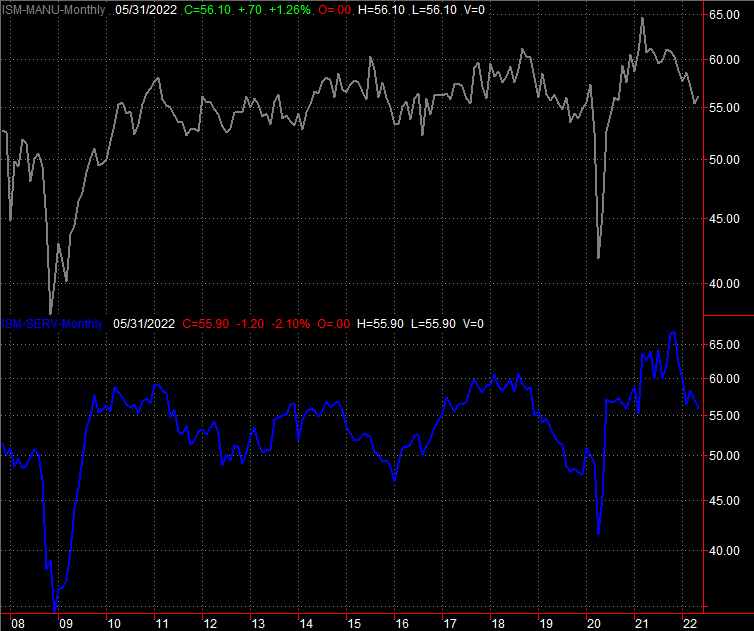
Finally, we got the first half of the Institute of Supply Management's stance on the economy, hearing its manufacturing index report on Friday. Though still above the critical 50.0 level, it took another step back, suggesting an economic slowdown.
Institute of Supply Management Manufacturing and Service Index Charts
 [3]
[3]
Source: Institute of Supply Management, TradeStation
The ISM's non-manufacturing (service) index will be updated for June this week. Economists are calling for a slight ebb here as well, though it too should hold above the 50.0 mark that delineates growth and contraction.
Everything else is on the grid.
Economic Calendar
 [4]
[4]
Source: Briefing.com
This week's dance card looks pretty full, but there's really only two reports we're terribly concerned about.
The first of these is Wednesday's release of the minutes from the Federal Reserve's governors' most recent meeting. It's not a scheduled time to make a change to interest rates. You can bet, however, the market will be parsing every word of the minutes, looking for insight as to what the FOMC is worried about here.
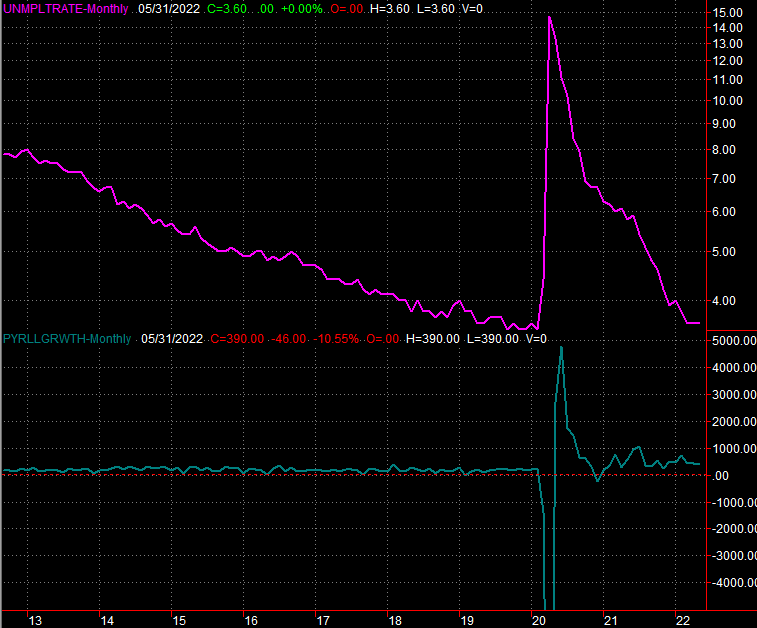
This week's biggie of course will be Friday's jobs report from the Bureau of Labor Statistics. While this has been a pleasantly-surprising bright spot, it's not been bright enough to buoy the market. And, it's unlikely to this time around. Analysts believe job growth slowed from 390,000 to only 250,000 for June, which should be just enough to hold the unemployment rate at 3.6%.
Unemployment Rate and Payroll Growth Charts
 [5]
[5]
Source: Bureau of Labor Statistics, TradeStation
Perhaps far more telling will be the pay-rate data and hours-worked data from the BLS, which may be a far more telling statistical indication of the job market's actual health.
Stock Market Index Analysis
Despite Friday's effort, the downtrend is still well underway.
The bulls had a chance to change that early last week, mind you. Stocks were rallying as of two weeks ago. But, rather than clear the technical hurdles both the major indices were testing at the time, the sellers started last week firmly in control.
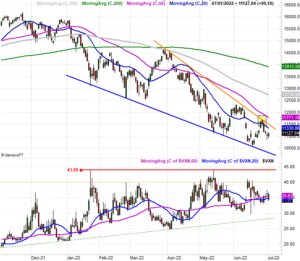
For the NASDAQ Composite, the technical ceiling in question was the line (orange) that connects all the major highs going back to late-March. The composite only had to brush this line (highlighted) before being up-ended.
NASDAQ Composite Daily Chart, with VXN
 [6]
[6]
Source: TradeNavigator
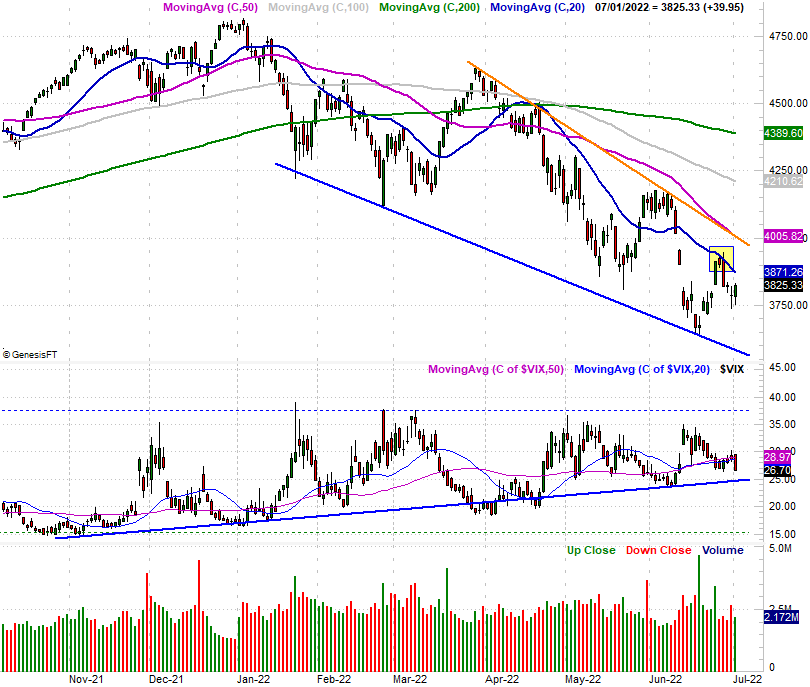
For the S&P 500, that ceiling is the 20-day moving average line (blue). The index brushed that level two weeks ago as well (highlighted), but last week's bearish start dragged it out of reach of a breakout.
S&P 500 Daily Chart, with VIX and Volume
 [7]
[7]
Source: TradeNavigator
In both cases the indices remain trapped between falling support and resistance lines that continue to steer the market lower. In both cases though, the indices are also sitting in the shadow of a strangely big and strangely fast selloff. The first half of 2022 was the worst first-half performance from the S&P 500 since 1970. As daunting as this sounds, it may also be the reason we can at least start thinking about buying…
… thinking, but not necessarily plowing in.
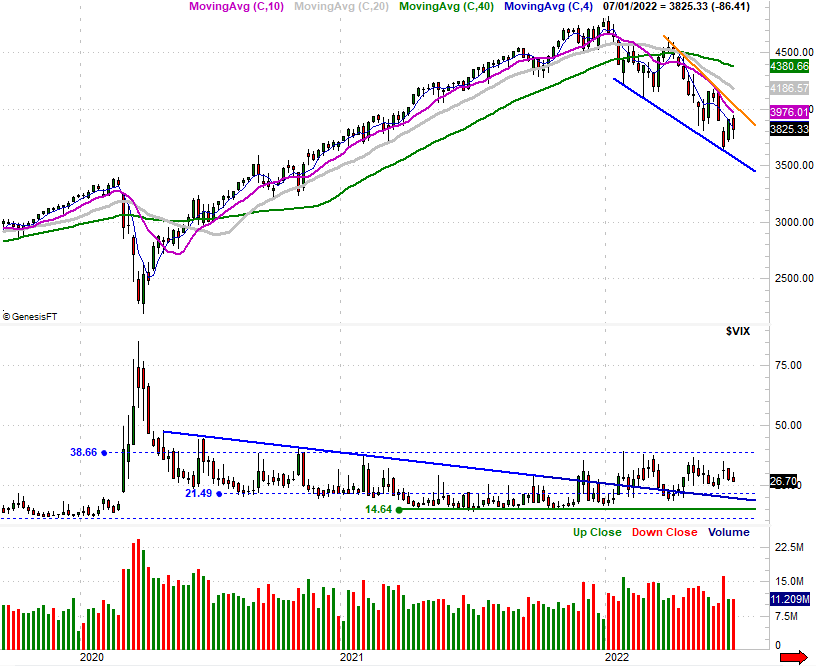
Zooming out to weekly charts of both indices helps put things in much-needed perspective. So, here's the S&P 500's weekly chart. Note how unusual the scope of the selling since the end of last year is. While it started to the new year out with the disadvantage of being overbought thanks to huge rallies in 2020 and 2021, that still doesn't make the 20% pullback suffered over the course of the past six months particularly fun for long-term investors. (Traders that can capitalize on short-term bearish trends, of course, don't really care.)
S&P 500 Weekly Chart, with VIX and Volume
 [8]
[8]
Source: TradeNavigator
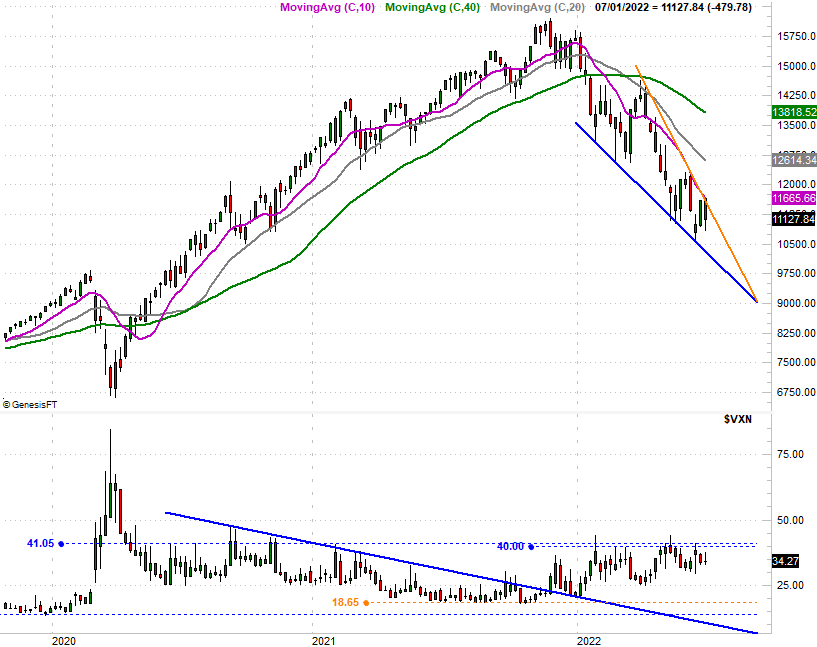
Here's the NASDAQ's weekly chart… same story.
NASDAQ Composite Weekly Chart, with VXN
 [9]
[9]
Source: TradeNavigator
What's most curious – and perhaps most telling – from the weekly charts is the fact that both index's volatility index's stand ready to punch through key technical resistance levels. And, broadly speaking, both the VIX and the VXN are also logging a streak of higher lows. It's not "trouble" until both the VIX and the VXN move above resistance at 39 and 40, respectively. In the same sense a coiled-up spring uncoils very rapidly once released though, such an event for and from the volatility indices could up-end stocks. Until then, the downtrend is actually not all the dramatic on a net basis. It's just persistent, taking two steps back for every one step forward.
Early-July is usually a bullish time, and after the decent finish to last week, odds are we'll see that usual bullishness surrounding the holiday. This is usually soon followed by renewed lethargy though. And this time, there's clear resistance in place that could halt any rally in its tracks and steer stocks into the typical lull in the latter half of July.
As always though, we'll just have to wait and see.