
The market is a lot like the ocean… you never want to turn your back on it for too long. Or, to put it in more direct terms, last week (the worst week since March of 2020 when the pandemic made landfall in the U.S.) is how the market punishes traders who've learned to presume you can buy on any and every dip.
Granted, there's sort of an upside to the meltdown. That is, stocks fell so hard and so fast, we may be due for a dead-cat bounce that puts a more prolonged recovery into action. It would be surprising, in fact, if we didn't see the bulls push back at least a little bit. Just don't jump to conclusions in that direction either. Last week's damage could be more critical than it seems on the surface.
We'll look at the matter in some detail below, as we always do. First though, let's review last week's economic news and preview this week's announcements.
Economic Data Analysis
There wasn't a whole lot of economic news released last week, but what we got really rounded out the real estate picture. It was a mixed message.
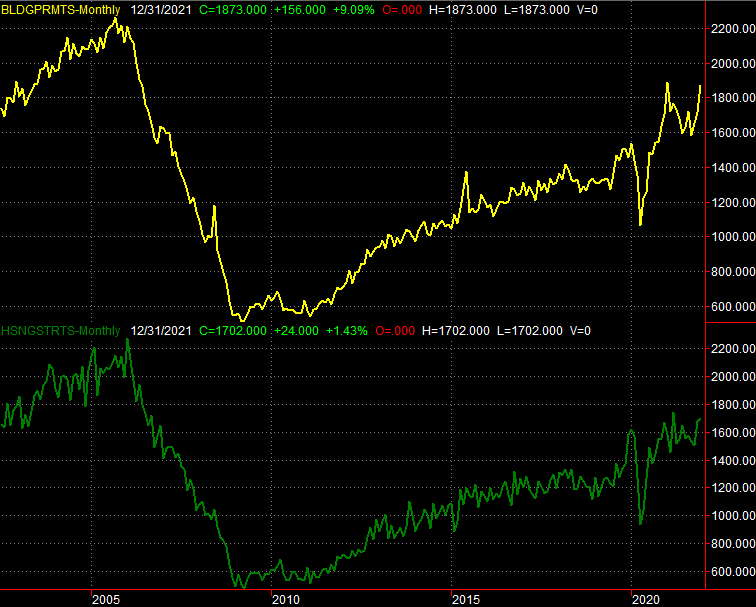
December's housing starts and building permits, for instance, both edged higher. Starts improved from 1.68 million to a pace of 1.7 million, while permits soared from an annualized clip of 1.71 million to 1.87 million.
Housing Starts and Building Permits Charts
 [1]
[1]
Source: Census Bureau, TradeStation
It's possible this strength simply reflects an effort to "beat the clock" before interest rates starts to rise…. which they have in the meantime. We won't know if this marks the renewal of the longer-term uptrend until we get this month's data in February.
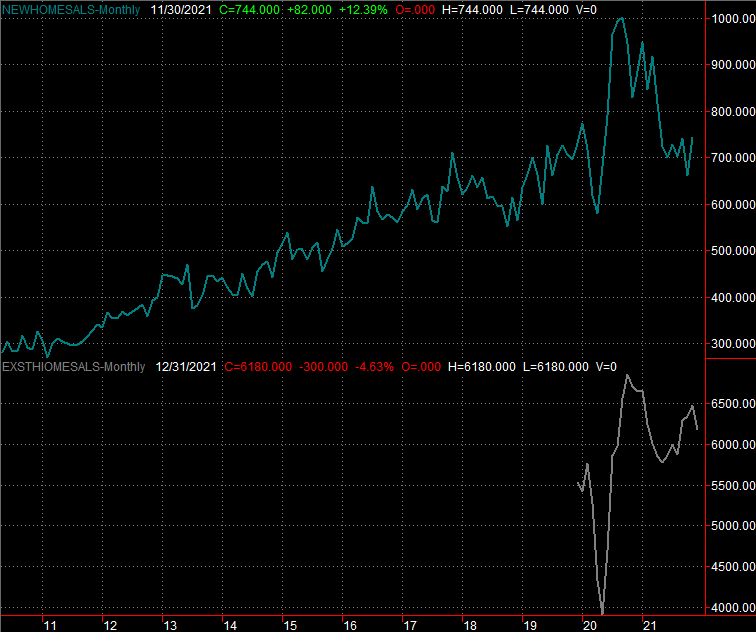
On Thursday we heard about last month's sales of existing homes. This figure wasn't bad, but did fall from a pace of 6.48 million to 6.18 million.
New and Existing Home Sales Charts
 [2]
[2]
Source: Census Bureau, National Board of Realtors, TradeStation
We'll hear about last month's sales of new homes this week, though economists aren't looking for any real improvement from November's still-low levels.
Everything else is on the grid.
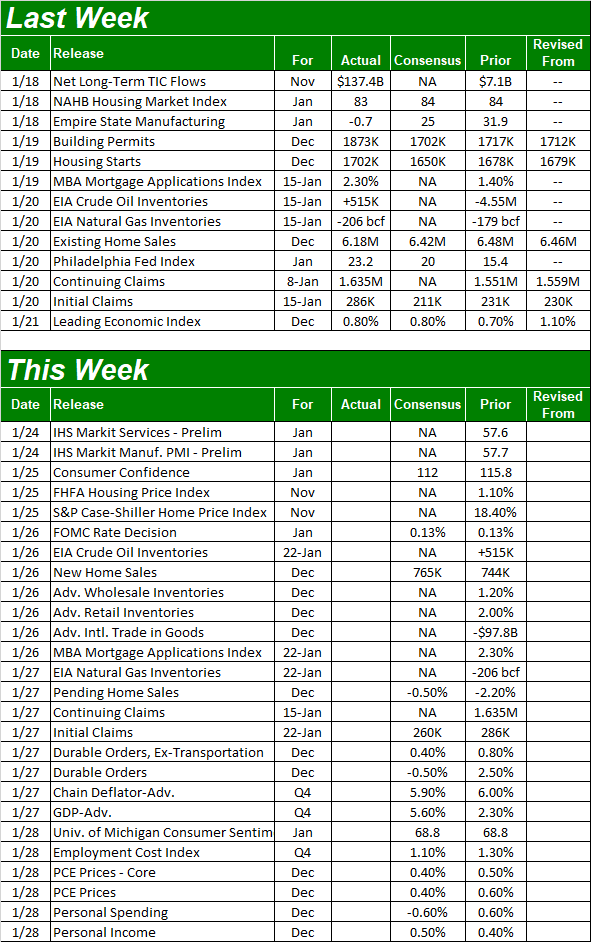
Economic Calendar
 [3]
[3]
Source: Briefing.com
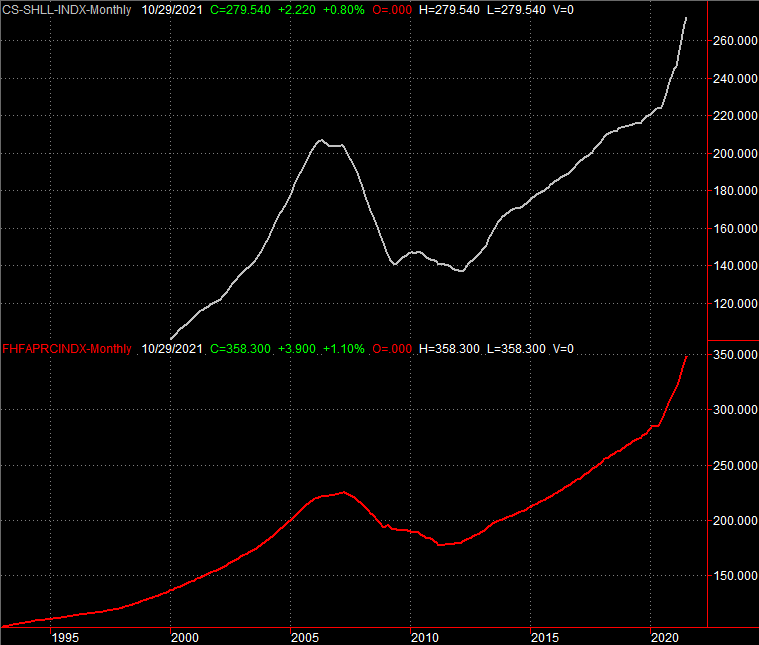
This week is going to be busier, with a heavy dose of real estate information. In addition to Wednesday's new home sales figures — which are expected to rise just a bit — we'll get home price reports on Tuesday. Forecasters didn't have their estimates ready as of the time of this publishing, although it's likely that both the Case-Shiller number as well as the FHFA Home Price Index edged a little higher. The pace of home value growth probably did slow down, as it did in October. Just bear in mind the upcoming November report (yes, it's a month behind) is being compared to some incredibly strong numbers. Don't sweat pessimistic spins too much.
Home Price Charts
 [4]
[4]
Source: Case-Shiller, Standard & Poor's, FHFA, TradeStation
Although we're not going to preview a chart of either, know that the FOMC is scheduled to make a decision on interest rates on Wednesday, which is the same day we'll hear about last week's mortgage applications. As of the most recent look the market says there's a 95% chance the Fed's governors won't change anything and opt to keep the Fed Funds Rate between 0.0% and 0.25%. But, the odds of a quarter-point rate hike soar to 89% when the FOMC considers the possibility in March. This prospect could be accelerating mortgage applications, although we've already seen higher mortgage rates start to stymie interest in taking out such loans.
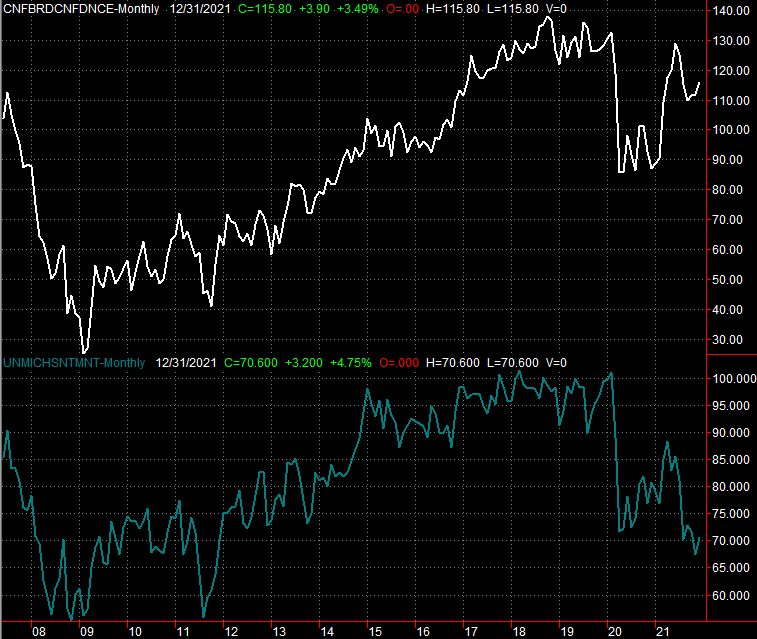
Finally, this is a big week for sentiment. The Conference Board will post January's consumer confidence score on Tuesday, and we'll get the third and final look at the University of Michigan's sentiment reading for January on Friday. Both are expected to slide a little lower, and understandably so in light of the market's recent action as well as the renewed spread of COVID-19.
Consumer Sentiment Charts
 [5]
[5]
Source: University of Michigan, Conference Board, TradeStation
Stock Market Index Analysis
Brutal. That's the only way of describing last week's action… brutal. The S&P 500's 5.7% setback (in just four trading days, no less) was the worst since stocks tumbled in March of 2020, when COVID-19 was first found in the United States. But, the NASDAQ Composite led the charge lower, losing 7.5% of its value during the same timeframe.
It's not just the scope of the selloffs that's most concerning though. Indeed, the size of the pullbacks isn't a real worry at all. We've survived worse. The big pullback ultimately sets the stage for a big bounceback, as we've seen several times since early 2020.
Rather, the chief worry is the severity of the technical damage done last week. All the indices are now below key technical support levels that should have held up as a floor.
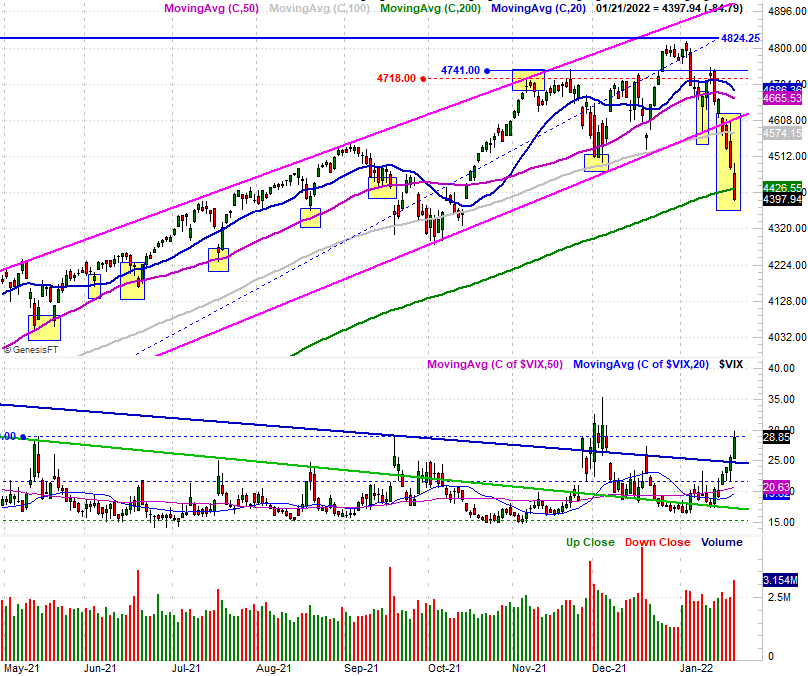
Take the S&P 500 for instance. Once the straight-line support (pink) that had connected all the key lows going back to mid-2020 broke down on Monday, the sellers never looked back. Not even the 200-day moving average line (green) at 4426.5 was able to slow the selling down.
S&P 500 Daily Chart, with VIX and Volume
 [6]
[6]
Source: TradeNavigator
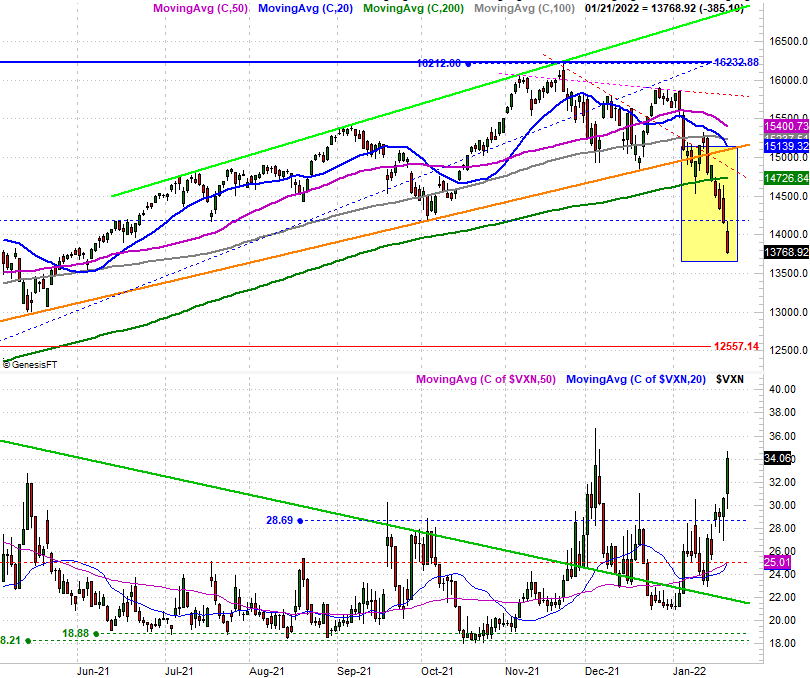
The NASDAQ Composite fell into the exact same trouble last week.
NASDAQ Composite Daily Chart, with VXN
 [7]
[7]
Source: TradeNavigator
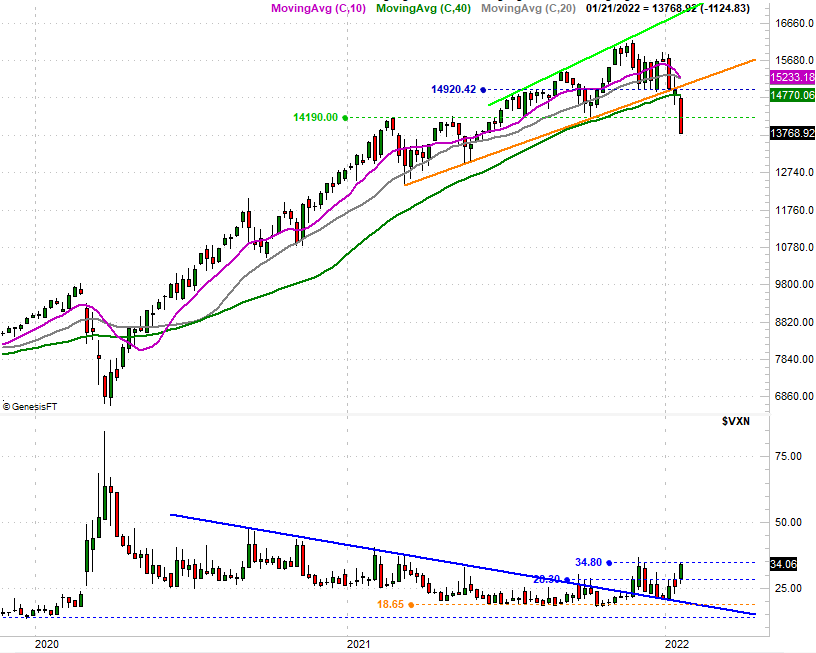
The weekly charts put things in more perspective. The NASDAQ Composite didn't just take a tumble. It got obliterated, obliterating and plausible support level as a result. The index now sits 15% below its late-November peak… a pullback big enough to entertain the idea of a dead-cat bounce. But, there's no context or other reason to suggest such a bounce has to take shape right now.
NASDAQ Composite Weekly Chart, with VXN
 [8]
[8]
Source: TradeNavigator
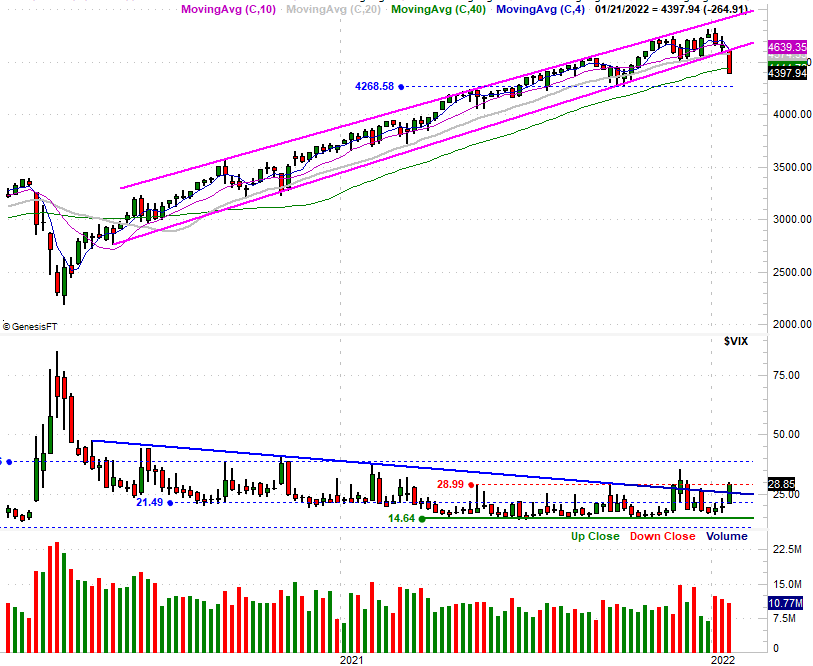
Here's the S&P 500's weekly chart. The fact that its bullish trading range (pink) that's been in place since mid-2020 has now failed only makes this week's failure more pronounced. Something's clearly changed for the worse. When well-established trends snap so firmly, they tend to stay snapped. If-and-when the index falls below October's low near 4269, there's even less reason to expect a quick recovery.
S&P 500 Weekly Chart, with VIX and Volume
 [9]
[9]
Source: TradeNavigator
For perspective, the S&P 500 is now trading at nearly 9% under its early January peak.
The weekly charts show us something else important that's not quite as clear on the daily charts… the volatility indices. They're not doing much, which is the problem. While both the VIX and the VXN moved higher last week in step with the market's pullback, they didn't soar as much as one might expect them to given that we just suffered the worst week in nearly two years. Investors are apt to capitulate without driving both volatility indices through the roof, so to speak. That means we haven't yet hit the psychological bottom that tends to coincide with the market's actual bottom, even if we see a little (yet temporary) rebound effort this week.
In fact, it would be a bit surprising if we didn't see at least some buying this week. Just don't read too much into. It could take weeks for the market to get back into a bullish mood, and mode. Indeed, it should take weeks, since the slower the recovery effort is, the firmer and better-grounded it is.
In the meantime, take last week's action as a reminder of an important lesson… not every dip is a buy.