The bulls may have ended 2017 on something of a hesitant foot, but they rekindled their bullishness as soon as the calendar was flipped. The S&P 500 gained 2.6% last week… a feat made more impressive by the fact that it only took four trading days to do it rather than the usual five. It was the best start to any new year since 2010.
As amazing as the rally has been since early November of 2016, few traders disagree that the 25% gain since then leaves the market in a tentative spot. Then again, it hasn't mattered yet — why should investors worry about the inherent risks of a pullback now? Besides, January is usually a pretty good month for the market anyway.
It never hurts to hope for the best and plan for the worst though.
We'll look at both sides of the coin (as always) below, after a review of last week's and a preview of this week's economic announcements.
Economic Data
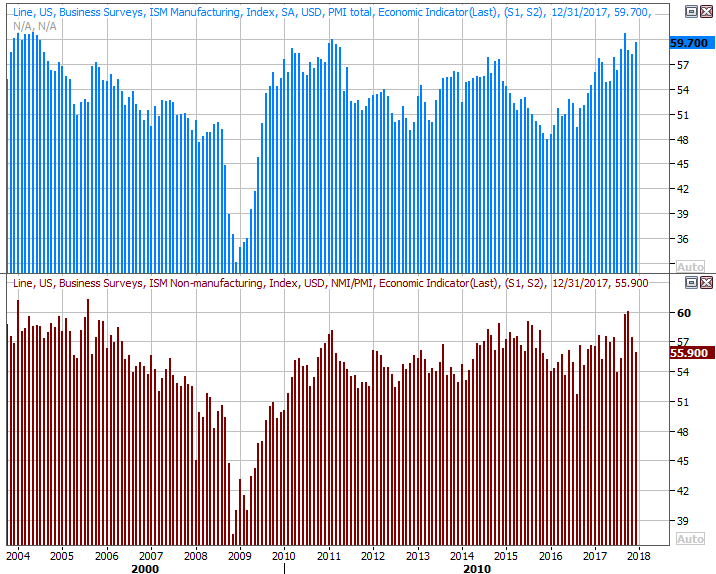
Despite it being a holiday-shortened week, we got plenty of economic news to work with. The highlight, of course, was Friday's jobs report for December. Let's take our looks in order of appearance though, starting with Wednesday's ISM Manufacturing Index report, which was followed by the ISM Services Index report later in the week.
They were a mixed message… sort of. The manufacturing side of the ISM data showed an improvement, while the services version of the index slipped a little. Still, both remain above the key 50 level, pointing to broad economic strength.
ISM Index Charts
 [1]
[1]
Source: Thomson Reuters Eikon
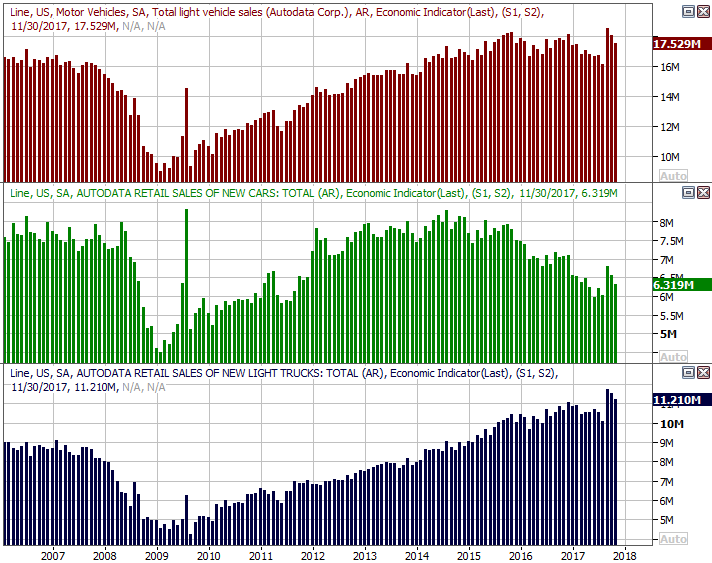
Last month's auto sales were also released, dishing out another mixed message. Truck sales were strong, but passenger vehicles sales turned tepid. Of course, we're still dealing with the purchase surge created by the impact of two rather devastating hurricanes, so it would be wrong to come to any immutable conclusions. All the same, even with strong sales over the last four months of the year, 2017's car sales in the United States were still less than 2016's tally.
Auto Sales Charts
 [2]
[2]
Source: Thomson Reuters Eikon
Of course, the big Kahuna was Friday's jobs report. It was technically disappointment in that the unemployment rate didn't slide from 4.1% to the expected rate of 4.0%, and the number of new jobs added in December only rolled in at 148,000 versus expectations of 252,000.
Payroll Growth and Unemployment Rate Charts
 [3]
[3]
Source: Thomson Reuters Eikon
Investors didn't sweat it, however, as they know we're at or near maximum employment as it is. The measure of progress from here will be wage growth.
Everything else is on the grid.
Economic Calendar
 [4]
[4]
Source: Briefing.com
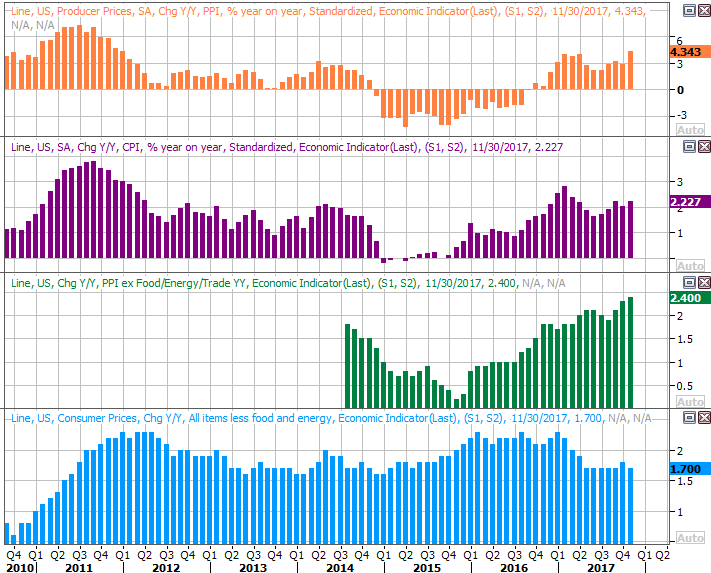
This week is going to be just as busy, though the biggest fireworks won't start going off until Thursday when we hear about December's producer inflation rates. We'll get last month's consumer inflation data on Friday.
Analysts are looking for a slightly cooler inflation pace than we saw in November, though they're still expecting a pretty good bump. With a strong economy and roaring market, consumers haven't been shy about spending, and companies are willing to invest. Don't be surprised if inflation comes in stronger than expected for December, but even if it doesn't, the Fed's still got room and reason to ratchet interest rates higher to keep inflation in check.
Consumer and Inflation Rate (Annualized) Charts
 [5]
[5]
Source: Thomson Reuters Eikon
On Friday we're going to hear about December's retail sales, which will almost certainly be up year-over-year and will likely top the expected growth rates. Again, this is ultimately a reflection of consumer confidence, and coincides with economic strength. Spending growth has been trending up for some time now, and we expect another solid report.
Retail Spending Growth (Annualized) Charts
 [6]
[6]
Source: Thomson Reuters Eikon
Also keep an eye/ear out for last week's oil stockpile report on Wednesday. Inventory levels have been falling fast, helping boost oil prices. The steep fall-off suggests the industry has shuttered a lot of capacity, and though oil prices are heating up, it could take a while before capacity it added back in and inventory levels start to rise again. It can take weeks (if not months) for oversupply or undersupply to work its way out of the system, allowing for these wild inventory swings.
Index Analysis
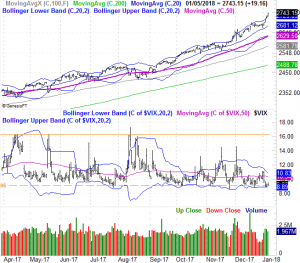
Against the odds, the market managed to make incredible forward progress last week. It likely had more to do with the sentiment we tend to see at the beginning of a new year in a bullish environment, but it's progress nonetheless.
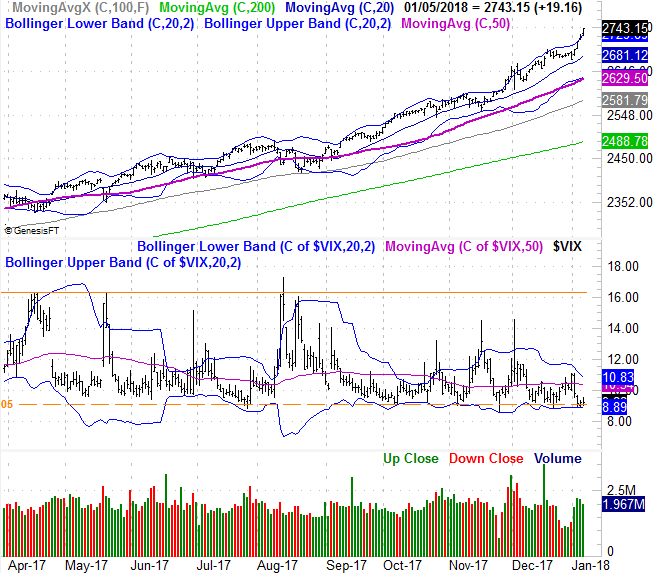
The daily chart of the S&P 500 below puts it all in perspective. Stocks were technically overbought by mid-December, and even paused as a result. Traders took the bullish fork in the road though, and the index is now a whopping 10.2% above its 200-day moving average line (green). The index is generally unable to move more than about 8% above — or below — the long-term moving average line.
S&P 500 Daily Chart, with VIX and Volume
 [7]
[7]
Source: TradeNavigator
You can also see the VIX is back at a familiar floor around 9.0. A VIX that low doesn't inherently mean a market implosion is nigh, but it sure doesn't leave a whole lot of room to pack in more bullishness to the market's present value.
Zooming out to a weekly chart doesn't tell us anything new, but it does put things in perspective. The advance has been uninterrupted since November of 2016, to the point of being unusual and dangerous. It's also on the weekly chart we can see the low VIX hasn't exactly had to be a liability.
S&P 500 Weekly Chart, with VIX and Volume
 [8]
[8]
Source: TradeNavigator
The chart of the NASDAQ doesn't tell us anything more because, if we're being honest, this rally is one only being built on speculation about earnings growth driven by an economic explosion… an explosion that seems likely, though isn't exactly secured yet.
To that end (and since the end of one year and the beginning of another is the perfect time to take this look), what exactly is in the cards earnings-wise? The data is now in hand.
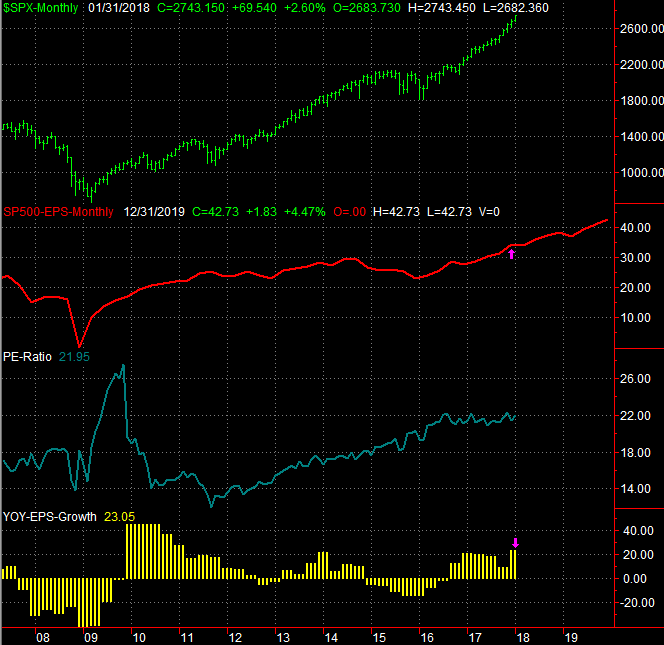
As of the latest tally, the pros think Q4's expected earnings of $34.33 will translate into full-year earnings of $124.99. For 2018, those same analysts are expecting a full-year profit of $145.79, steadily ramping up that whole time on a year-over-year basis. Right now the S&P 500 is valued at a trailing P/E of 21.9, and a forward-looking P/E of 18.8. Both are above average, though not wildly so.
S&P 500 With Earnings, Past and Projected
 [9]
[9]
Source: Standard & Poor's
Things look even better down the road — in 2019 — and truth be told, we'll probably get there given the benefit of Trump's tax plan. The market's unlikely to keep traveling in a straight line (up) though, to reflect earnings growth.
And that's what makes right now such a tough time to predict the future for stocks. Nobody doubts the fundamental undertow. Most everyone thinks, however, we're going to have to go through some sort of valuation "reset" thanks to 2017's overheated rally. The hard part is figuring out when we're going to pay those dues. It seems like it should be sooner than later, but the first four months of the year are usually bullish.
This, unfortunately, remains a day-to-day exercise. The S&P 500 could fall all the way back to its 50-day moving average line (purple) currently at 2629 and still be in an uptrend, and the index could slide all the way back to the 100-day moving average line (gray) currently at 2581 and there wouldn't be e major reason to sweat. The 100-day average would have to fail as a floor and the VIX would have to move above its ceiling at 16.2 before assuming the worst.
Either way, if a meltup ensues, it should be short-lived. If the profit-taking begins right away, don't assume it's more than that until we fall below the aforementioned moving average lines.