
It wasn't necessarily a bad week for the market. All of the indices basically broke even. But, how and where stocks stalled is highly suspect. None of the key indices managed to get up and over the technical hurdles that came into play two weeks ago. This may be the market's way of telling us there are some psychological underpinnings standing in the way of more forward progress.
We'll look at the failure to clear these key hurdles in a moment. Let's first run through last week's biggest economic announcements and preview what's coming this week.
Economic Data Analysis
It wasn't a huge week for economic news, but it was a big one for real estate.
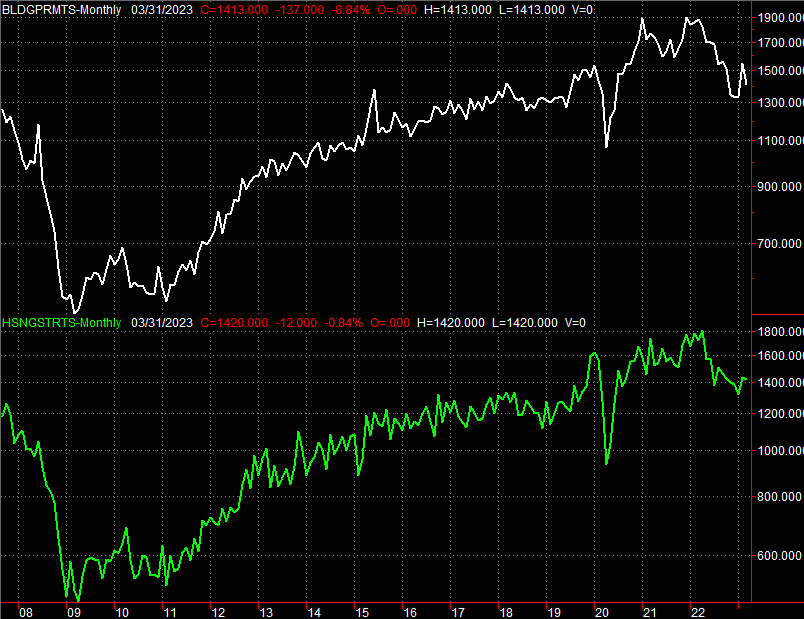
The party started on Tuesday with March's housing starts and building permits. Both were expected to roll in close to February's figures, which had shown – finally – glimmers of hope for a rebound from last year's declines. We didn't even get that. While the starts figure only fell from 1.432 million to 1.42 million (though that's better than the expected 1.407 million), permits tumbled from February's revised figure of 1.55 million to only 1.413 million, falling well short of the forecasted 1.458 million.
Building Permits, Housing Starts Charts
 [1]
[1]
Source: Census Bureau, TradeStation
Simply put, the real estate recovery remains in question.
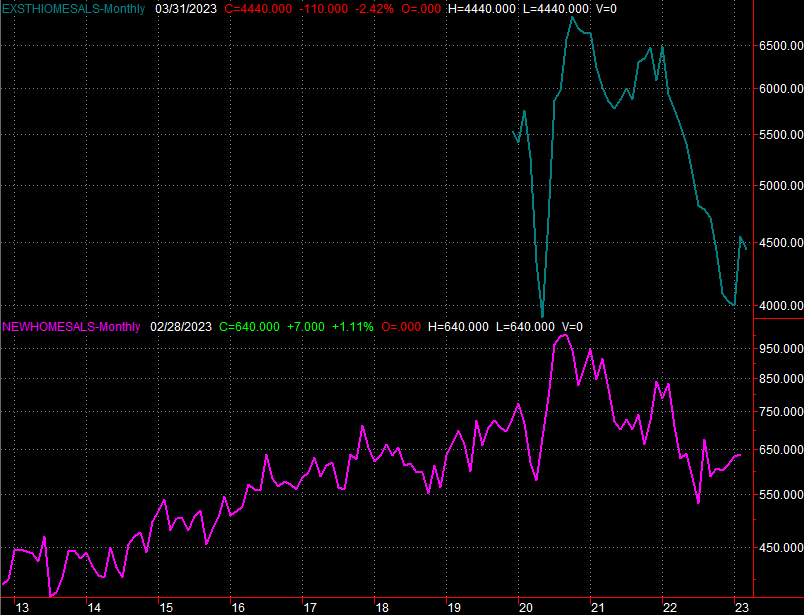
And it's not like Thursday's look at last month's sales of existing homes helped any. This number slipped from 4.55 million in February to 4.44 million, falling below forecasts of 4.5 million. And, any of those numbers hold this data back near last year's levels following a steep pullback in sales during 2022. There's no real glimmer of hope here either.
New, Existing Home Sales Charts
 [2]
[2]
Source: Census Bureau, National Association of Realtors, TradeStation
Last month's new-home sales figures will be reported on Tuesday of these week. Like everything else real-estate-related, these numbers have been lackluster for months. Economists don't see this number taking a turn for the better this time around either.
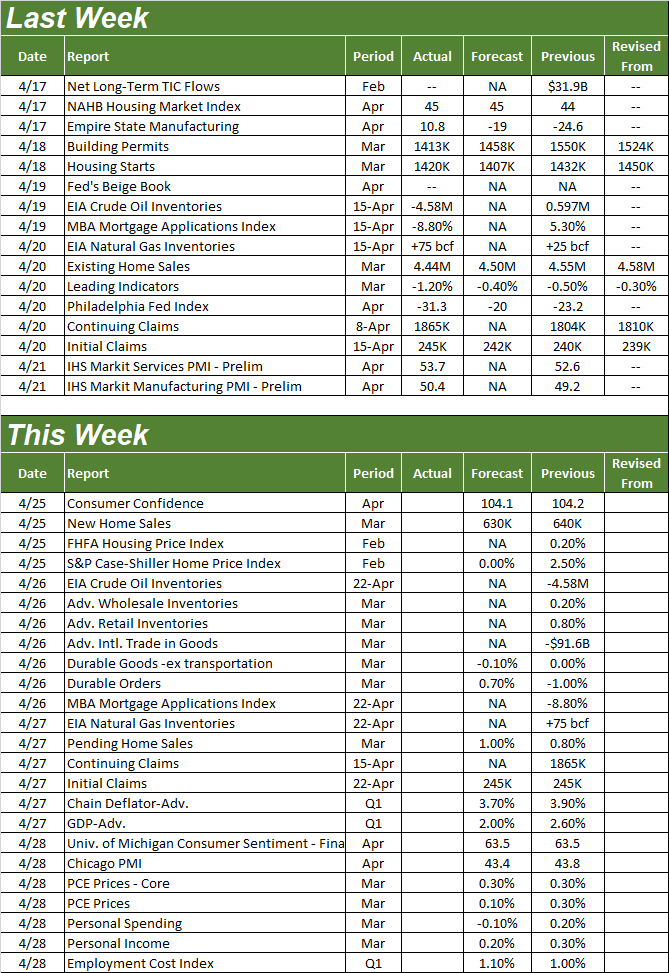
Everything else is on the grid.
Economic Calendar
 [3]
[3]
Source: Briefing.com
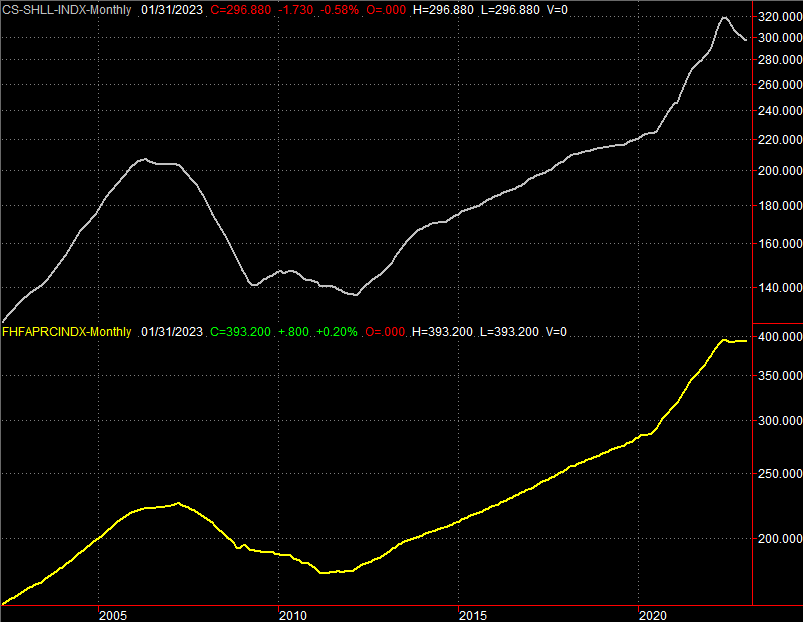
This week will really round out the real estate picture. In addition to Tuesday's new-home sales figures, we'll also hear real estate price data that same day (although it's for February). The S&P Case-Shiller Home Price Index is projected to continue weakening, and though it's not falling nearly as fast, the FHFA Housing Price Index will likely continue to slip a bit as well.
Home Price Index Charts
 [4]
[4]
Source: Standard & Poor's, FHFA, TradeStation
We're not charting it here, but do keep an eye out for last week's mortgage applications on Wednesday, and pending home sales for March on Thursday. Both will help illustrate where the real estate market really is at this point in time.
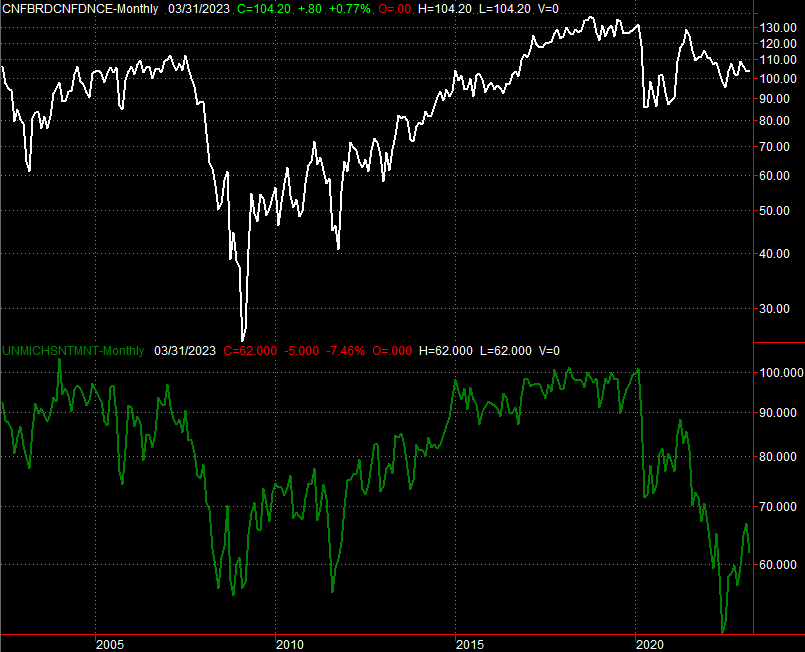
This is also a huge week for sentiment. The Conference Board's consumer confidence data will be posted on Tuesday, while the third and final look at the University of Michigan Consumer Sentiment Index for April is coming on Friday. The former should come in near March's level, while the latter's is expected to be up just a bit. Notice that both measures are starting to settle in following some extreme volatility over the course of the past three years. That's good in and of itself, as it allows investors to make more reliable use of the data.
Consumer Sentiment Charts
 [5]
[5]
Source: The Conference Board, University of Michigan, TradeStation
Again we're not charting it, but Friday's look at personal income and personal spending in the U.S. will help paint the picture of how consumers are truly feeling right now. Note that income growth likely slowed, while actual spending probably fell last month. The market's paying more attention to these numbers now than it typically does.
Stock Market Index Analysis
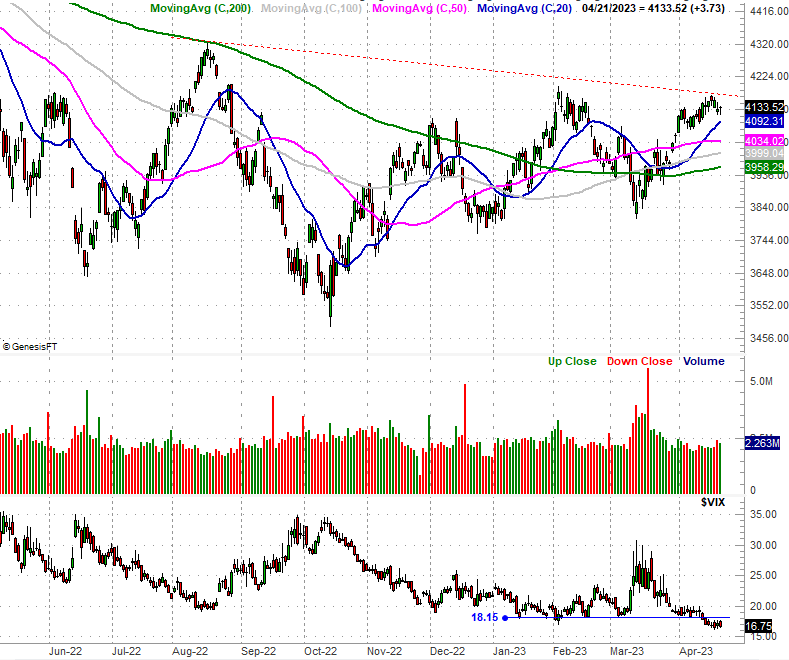
We kick this week off with a look at the weekly chart of the S&P 500, as this is the vantage point that best illustrates the bulls' biggest problem right now. That is, the index is bumping into the same straight-line technical ceiling (red, dashed) that stopped rally efforts back in August and February (marked with blue arrows).
S&P 500 Weekly Chart, with VIX and Volume
 [6]
[6]
Source: TradeNavigator
Also notice that the volatility index (VIX) is bumping into technical floor that corresponds to the S&P 500's resistance line, underscoring the idea that the current rally is out of steam.
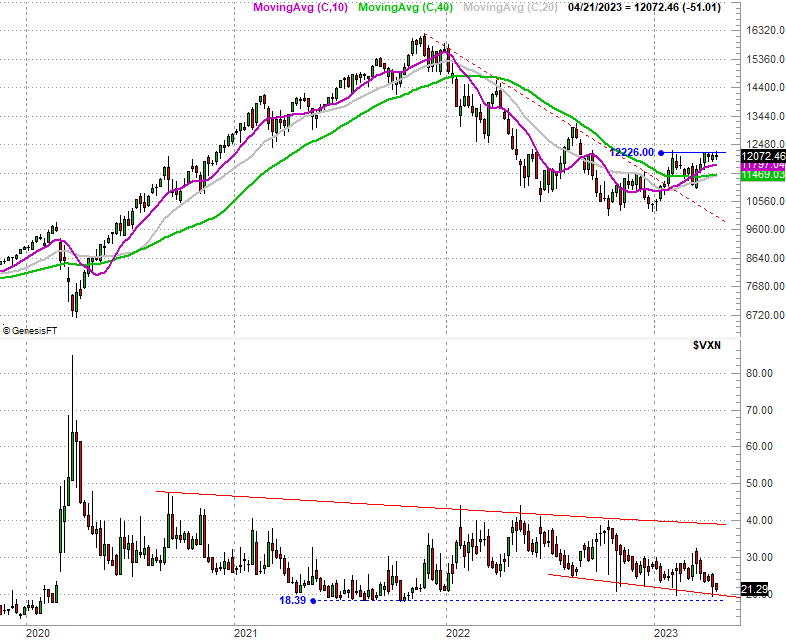
The weekly chart of the NASDAQ Composite is running into a similar wall. Namely, the index can't get over the 12,226 level, where it also peaked back in February. You can also see the NASDAQ's volatility index (VXN) is testing a key technical floor of its own. That too works against more bullishness in the immediate future.
NASDAQ Composite Weekly Chart, with VXN
 [7]
[7]
Source: TradeNavigator
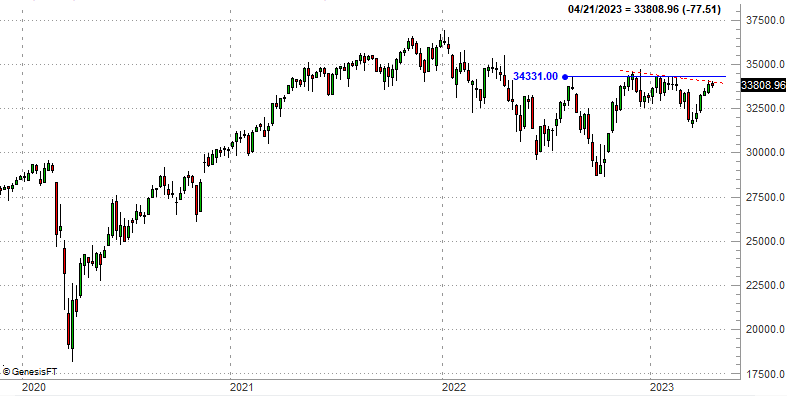
Even the Dow Jones Industrial Average is struggling right on cue. Connecting its highs from late last year, early this year, and just the past couple of weeks (red, dashed), a clear ceiling is in place.
Dow Jones Industrial Average Weekly Chart
 [8]
[8]
Source: TradeNavigator
It's not a reason to panic, or even a bearish call. That might the outcome from here. Or, it might not be. If a pullback is in the immediate future though, this is most likely how and where it would start.
And, even if that is the immediate outcome, that doesn't inherently mean the budding bull market is dead. All of the indices have made higher lows and higher highs since October's bottom, and as a result are all now above all of their key moving average lines. Also, all of those moving average lines are now sloped upward. Any and all of them can act as support in the event of a full-blown pullback. As the daily chart of the S&P 500 shows us, there's room to slide all the way back to the 200-day moving average line (green) at 3958 without actually snapping the uptrend.
S&P 500 Daily Chart, with VIX and Volume
[6]
Source: TradeNavigator
Bottom line? One lethargic week doesn't automatically mark the beginning of a selloff. Even a trio of bad weeks doesn't have to end with a pullback. The buyers may simply be regrouping here, mustering to punch through all of the technical ceilings described above. Moreover, even if stocks do take a tumble, there are plenty of technical floors below to stop that pullback pretty quickly.
Whatever the downside risk is, the bigger risk from here is missing out on more upside if-and-when the indices break above the technical resistance currently holding them back. And, while the forward progress has currently stopped, the current momentum is still technically bullish.
Don't be too discouraged by the relative weakness for the past couple of weeks. These levels were always going to be a battleground.