
The bulls just aren't giving up. Last week's 1.6% advance is not only the fourth weekly win in a row, it's the tenth winner in the past eleven.
Almost needless to say, the market is now well into record-high territory… almost dangerously high. The S&P 500 is now up nearly 13% from its early October low, and up a stunning 28% for the past twelve month stretch (the big bottom was made the last week of last year). Granted it started that run with the benefit of a major setback in the last quarter of last year, but still, that's a big move for the timeframe. The move since early October is even more amazing considering Q3's earnings for the S&P 500 fell about 4%. Granted, energy and materials companies – the most volatile when it comes to earnings – are dragging the overall average down. Still, no sector was particularly impressive in terms of third quarter earnings growth.
In any case, we'll explore the incredible, unlikely below. First though, let's look at last week's economic news, and preview this week's announcements.
Economic Data Analysis
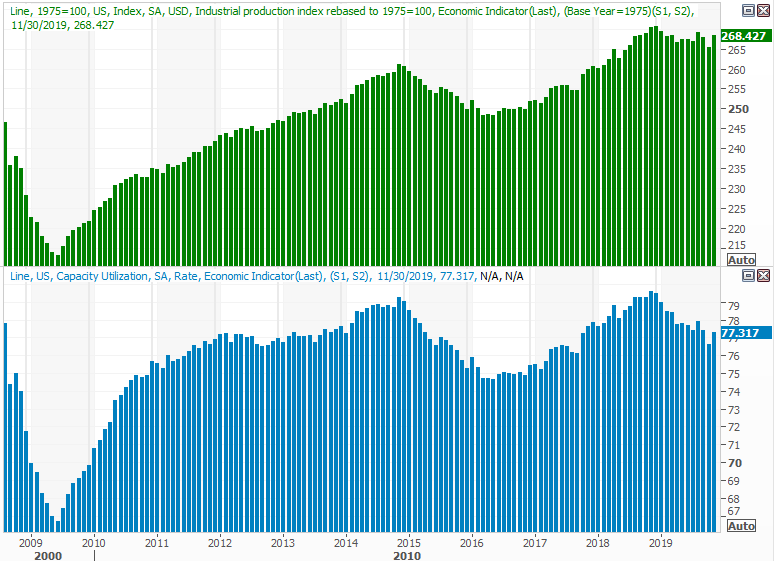
It was a busy week to be sure, and a particularly big week for real estate. The party started in earnest, however, on Tuesday with a look at last month's capacity utilization and industrial production levels. Both were up, reversing November's lull as well as offering a glimmer of hope for a more sustained advance.
Industrial Production and Capacity Utilization Charts
 [1]
[1]
Source: Thomson Reuters Eikon
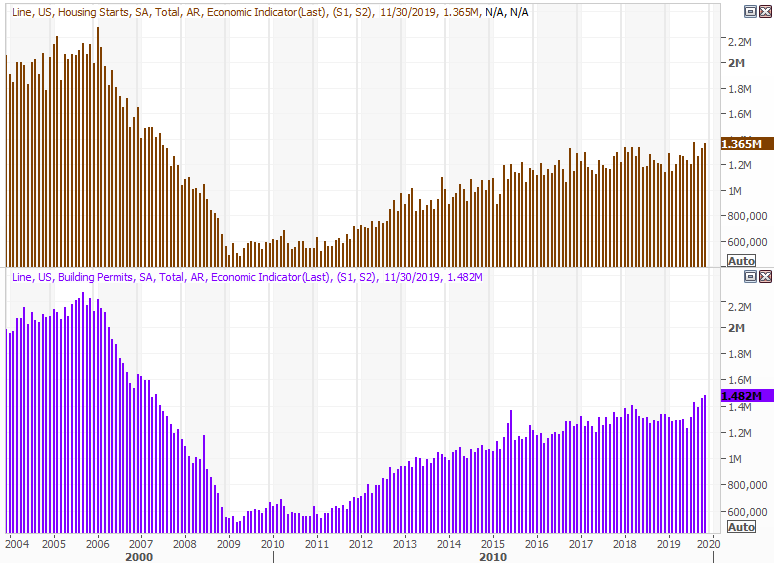
Also on Tuesday, we got a major look at the state of the real estate market, with November's housing starts and building permits. Starts were up firmly – and above expectations – while permits soared to a multi-year high pace of 1.482 million. Demand for new construction is clearly not a weak link at this time, even if driven by still-low interest rates.
Housing Starts and Building Permits Charts
 [2]
[2]
Source: Thomson Reuters Eikon
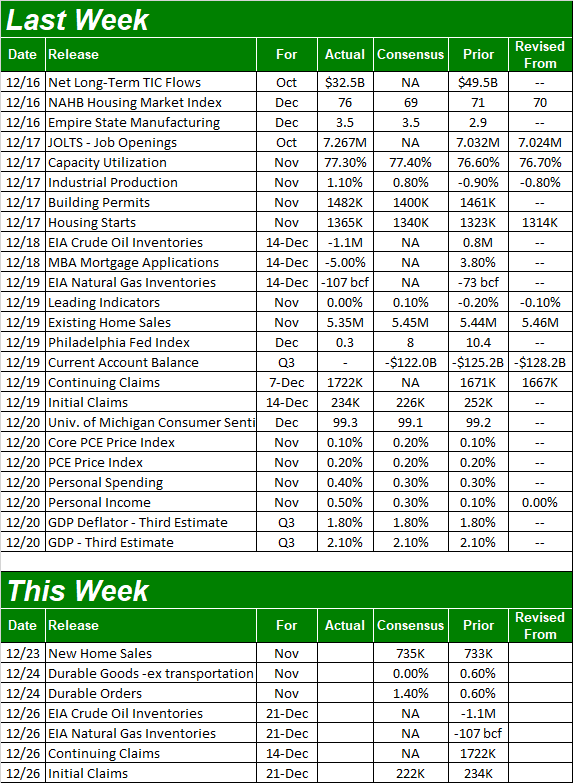
Other key data nuggets from last week include November's existing home sales (more on that below) and a final figure on Q3's GDP growth rate. As expected, it's still looking like it will be up 2.1%. It's not red hot, but it's up from Q2's pace, and economic growth has been nothing if not persistent.
Everything else is on the grid.
Economic Calendar
 [3]
[3]
Source: Briefing.com
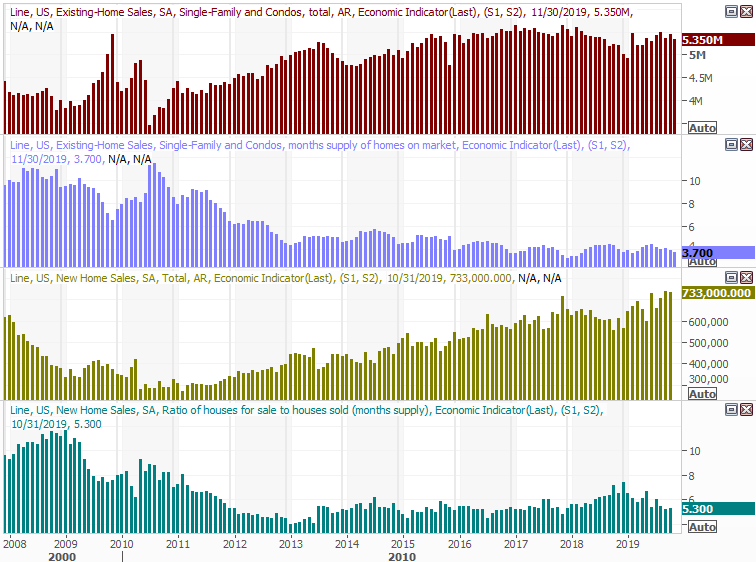
This week is was already going to be a fairly quiet one, but it was made even more tame by the holiday break scheduled for the midpoint of the week. There is one item worth keeping tabs on though. On Monday, look for last month's new-home sales. The pros are looking for a slight lift from October's 733,000, but more important, that data has been steadily trending higher – is still trending higher – since 2011.
New, Existing Home Sales Charts, with Inventory Levels
 [4]
[4]
Source: Thomson Reuters Eikon
In that vein, notice that last month's existing home sales slumped a bit. In fact, they've been fairly flat since 2015. It's possible, however, that a lack of inventory is holding that piece of the market back. The new homes market hasn't had to deal with the same degree of impasse.
Stock Market Index Analysis
First and foremost, don't be terribly impressed by the fact that the volume behind Friday's gain was so strong. It was not only an option-expiration day for the month, and the quarter as well… as well as the last one for the whole year. A lot of people were unwinding and renewing their option and futures trades.
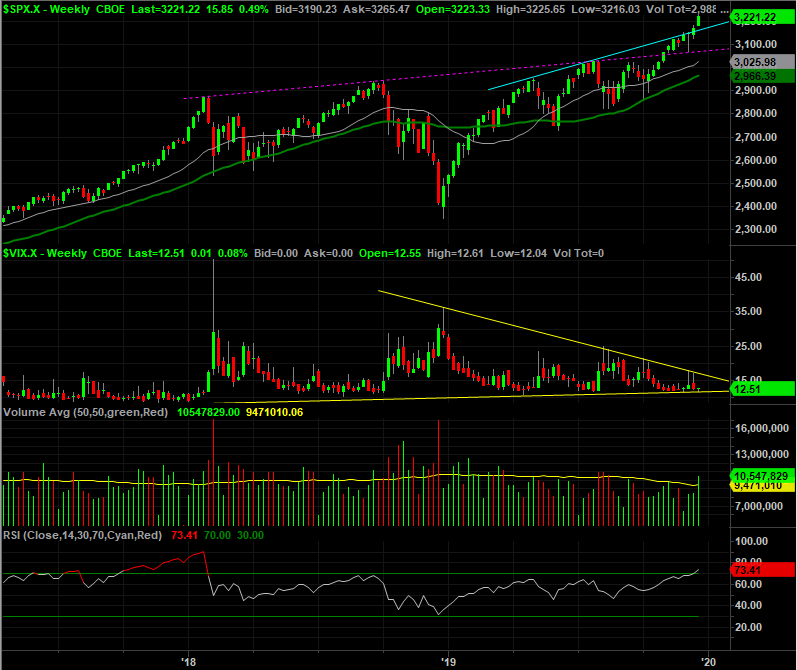
Still, the total gain for the day and the week in the shadow of the big move since the beginning of October is amazing to say the least. And, that's the problem. The S&P 500 is now up almost 13% for the quarter so far, and now above its 200-day moving average line (green) by 8.7%. That's a rarely-seen extreme, but more than that, it's a rarely-sustained extreme. To that end, also notice on the weekly chart that the S&P 500's RSI line is now officially into overbought territory.
S&P 500 Weekly Chart, with VIX
 [5]
[5]
Source: TradeStation
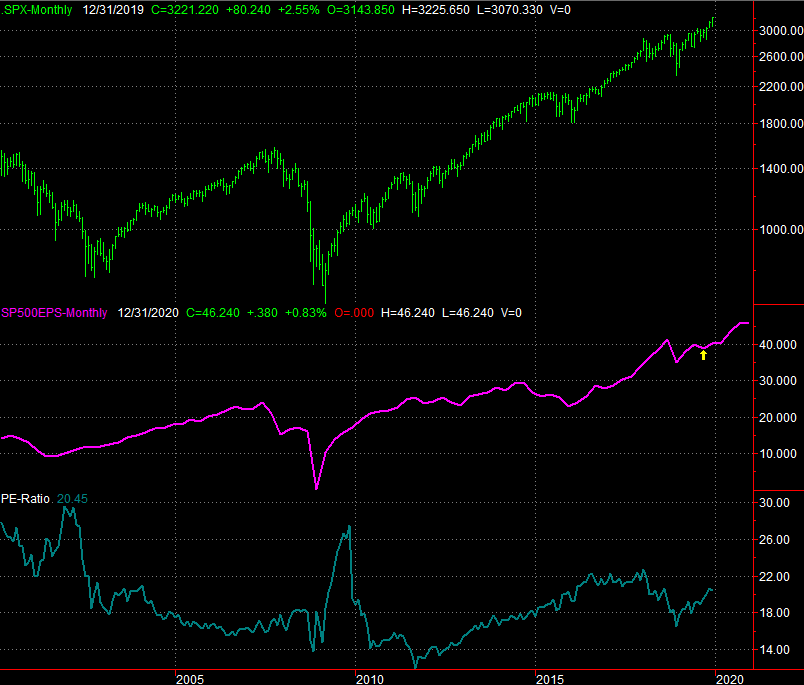
It's made a sizeable impact on the market's overall valuation. With almost all Q3 earnings in-hand, the S&P 500 is now priced at 20.4 times its trailing full-year income. That's not outrageous, but hardly cheap either…. regardless of how low interest rates are. Investors seem to be giving the market the benefit of any doubt, eyeing the expected earnings recovery for 2020. This year's earnings outlook, however, at one point looked about as good as next year's does.
S&P 500 Chart, with Earnings and P/E Valuation
 [6]
[6]
Source: TradeStation
That won't impact what happens in the very near term. In the short run, the market's going to do what the market's going to do. And, what the market looks like it's going to do in the very short term is continue moving higher.
That's not an easy call to make, or get behind with any real conviction. It can only be said because the current momentum is bullish, and we have to assume that the body in motion will remain in motion… until something stops it. The challenge here is, the sheer weight of the advance can create friction, as can the fairly lofty valuation. The oddly low VIX isn't helping either. Until the S&P 500 actually breaks below the 20-day moving average line (blue), it's difficult to talk about a corrective move as if it's actually happening… or even will happen.
S&P 500 Daily Chart, with VIX and Volume
 [7]
[7]
Source: TradeStation
And even then, so what? There are still several other moving average lines that can (and would) act as technical support. The S&P 500 could, in fact, fall all the way back to 2910 area (white, dashed) and still not be in a technical downtrend. That's the line that connects the lows from August and early October.
With all of that being said, the make-or-break line is still the line that connects all the major peaks for the VIX since late last year. See the weekly chart for perspective. That falling resistance line is also the upper boundary of a converging wedge shape (plotted in yellow). But, there's little room left to navigate within it. Once the VIX breaks out of that boundary, it could mark a more explosive – and bearish – move for the market itself. Don't be too quick to jump to conclusions though.
The point where there's no room left to roam within the range could still be a few weeks off… even as late as the latter part of January. But yes, it's still difficult to say there won't come a time when this big, unchecked rally won't lead into a wave of profit-taking.