The market's three-week losing streak finally came to a close last week, in spades. The S&P 500 rallied 3.6% last week, pushing its way back above some key technical resistance lines. Ditto for the NASDAQ Composite. It's hardly an ironclad move, but it's a start.
We'll take a look at the move in some detail below. First, though, let's look at last week's most important economic announcements and preview everything that's coming this week — there's a lot in the lineup.
Economic Data Analysis
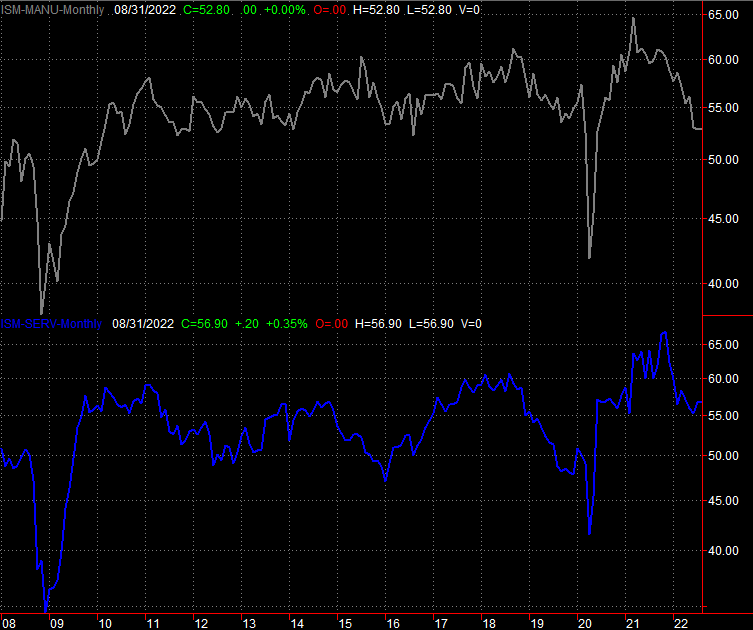
There was only one data nugget from last week worth looking at there… the ISM Services Index update for August. It was good, if not great. Economists were calling for a slight pullback from July's print of 56.7, to 55.2. But, it actually ticked a little higher instead, to 56.9. The downtrend is still intact more than not (and for the ISM Manufacturing Index as well). But, that downtrend is slowing, perhaps easing into a flat or even rising period.
ISM Manufacturing and Services Index Charts
 [1]
[1]
Source: Standard & Poor's, FHFA, TradeStation
The problem/challenge here is, the ISM reports aren't predictive, but reactive. If the economy doesn't perk up, we won't know it (or know it's confirmed) until after the fact, as evidenced by a renewal of the downtrends that have been in place since late last year.
Everything else is on the grid.
Economic Calendar
 [2]
[2]
Source: Briefing.com
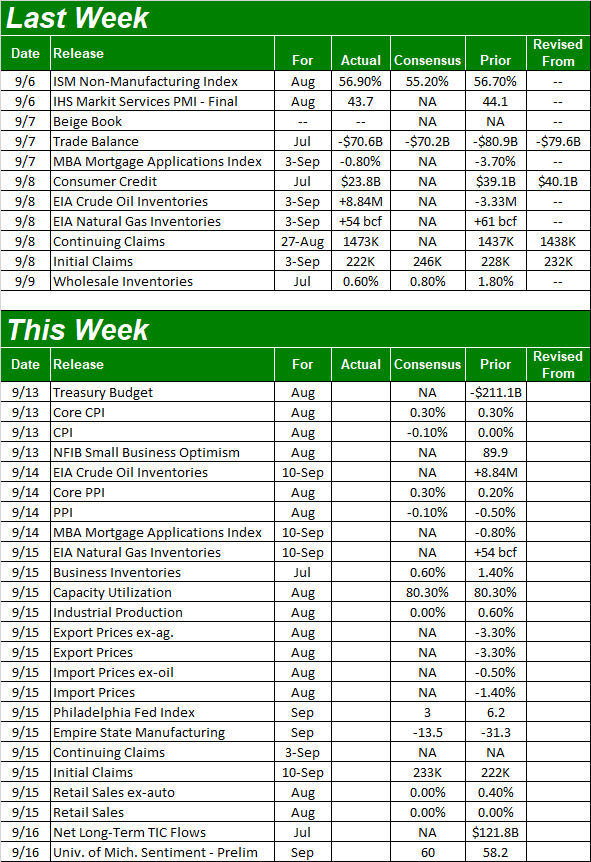
This week is loaded, with some biggies.
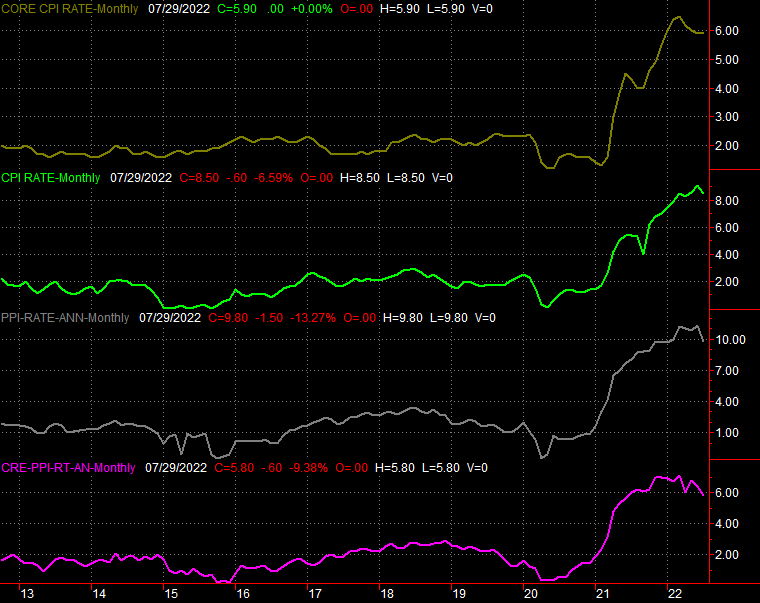
The party starts in earnest on Tuesday with a look at last month's consumer inflation data, followed on Wednesday with the producer inflation report for last month. After stripping out the benefit of falling energy and food prices (finally!), forecasters are essentially looking for more of the same. The current consumer inflation rate still stands at right around 8%, while the annualized producer inflation rate is a tad higher.
Consumer and Producer Inflation Rate Charts
 [3]
[3]
Source: Bureau of Labor Statistics, TradeStation
The buzz is the Federal Reserve is looking to raise the Fed Funds Rate by three-quarters of a point later this month. This week's inflation report will either etch that prospect in stone, or perhaps give the FOMC a little wiggle room to not be so hawkish.
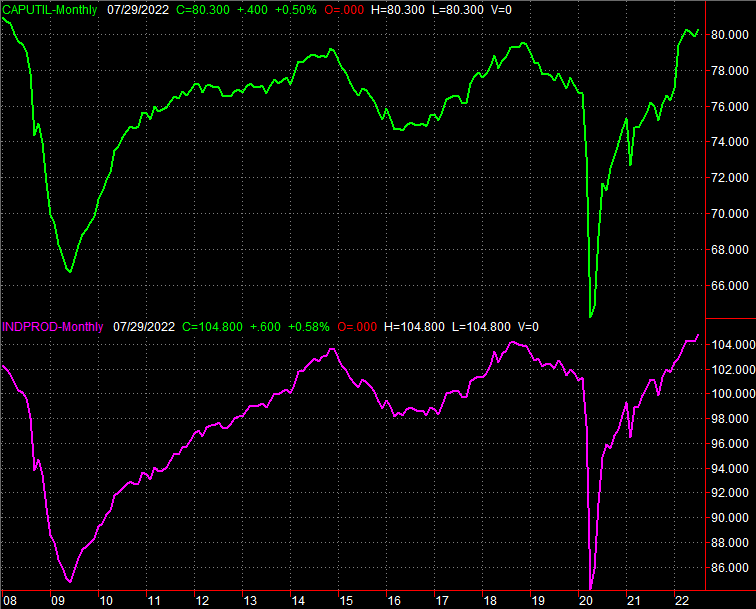
On Thursday look for capacity utilization and industrial productivity figures from the Fed. These are critical figures, even if not closely followed. Namely, they're very good indications of true economic strength (or lack thereof). And, that's not a bad thing here. Despite the bearish rhetoric, both capacity utilization and productivity have remained high after major uptrends from 2020's low. Economists believe August's numbers will be about even with July's, which in some ways is still a victory.
Capacity Utilization and Industrial Productivity Charts
 [4]
[4]
Source: Federal Reserve, TradeStation
Also on Thursday look for last month's retail sales. You may recall spending slowed quite a bit in July, albeit from accelerated levels from earlier in the year. Economists believe that slowdown is still in effect, stemming from a combination of higher prices as well as worries about the foreseeable future. Another round of relative weakness may (again) give the Fed some breathing room in terms of interest rate increases, but it would still be an economic red flag that undermines the market's budding rebound effort.
Retail Sales Charts
 [5]
[5]
Source: Census Bureau, TradeStation
Stock Market Index Analysis
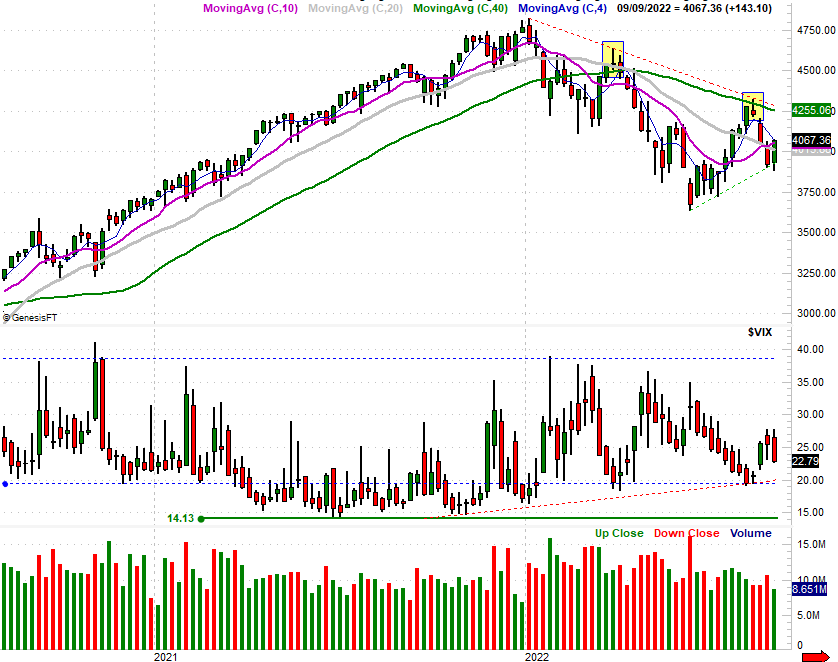
Take a look. Despite the rough start that dragged the S&P 500 to new multi-week lows on Tuesday, stocks managed to rally – bigtime – over the course of the last three days of last week. The last day of that three-day ramp pushed the index up and over its 50-day (purple) and 100-day (gray) moving average lines. Impressive.
S&P 500 Daily Chart, with VIX and Volume
 [6]
[6]
Source: TradeNavigator
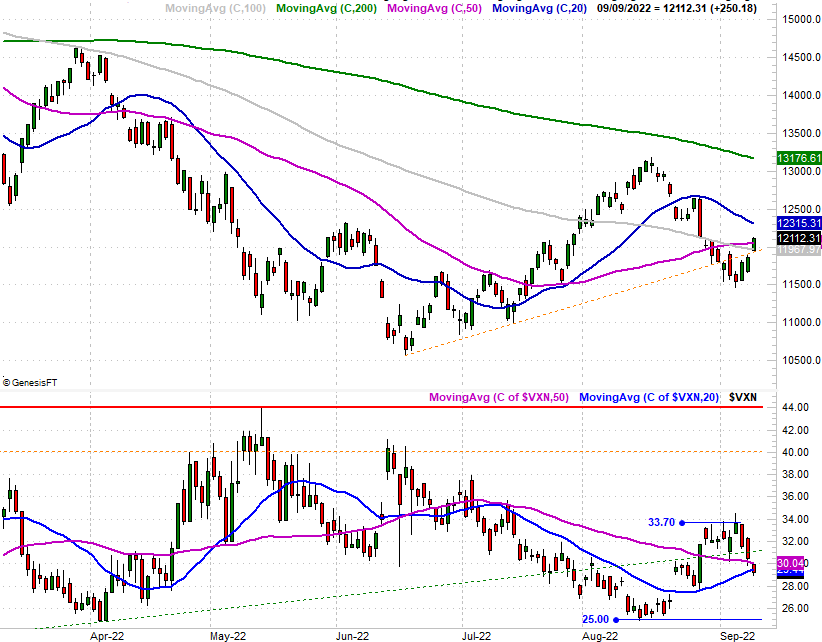
The NASDAQ Composite looks basically the same, hurdling its 50-day and 100-day moving average lines with Friday's closing "umph." And, like the S&P 500's volatility index, the NASDAQ's volatility index broke under a couple key moving average lines of its own. Both are bullish hints.
NASDAQ Composite Daily Chart, with VXN
 [7]
[7]
Source: TradeNavigator
In and of themselves these moves are a clear step in a bullish direction, but not exactly moves that clinch the beginning of a full-blown recovery. There are several other clues now pointing in that direction though.
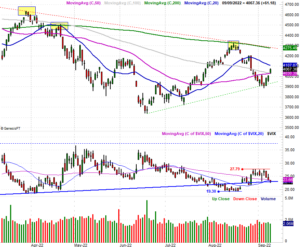
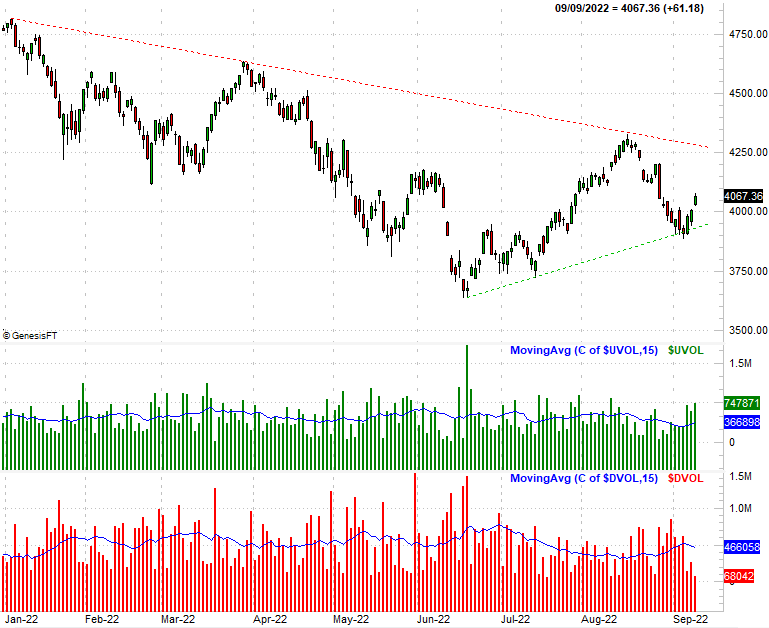
Take a look at the daily chart of the S&P 500 below, which removes the moving average lines so you can better focus in the index's rising support line (green, dashed) and falling support line (red, dashed). Last week's low was essentially made by a kiss of the floor side of that converging wedge. The ceiling currently at 4280 still looms above, and will be lower by the time it can be tested.
S&P 500 Daily Chart, with NYSE Up/Down Volume
 [8]
[8]
Source: TradeNavigator
That's not the only bullish hint on this chart though. On the bottom of the chart you see the NYSE's daily volume data… bullish and bearish. The rally from late last week was backed by plenty of bullish volume, and there was very little selling interest. In other words, last week's bullishness looks like a majority opinion.
There's more. Here's the weekly chart of the S&P 500, zoomed-in for good detail of last week's bar. As you can see, it's not a perfect "engulfing outside day," but it's close. An outside day simply means the bar's open is below the prior week's low, yet the close is above the prior week's high… the latter bar's range "engulfs" the previous week's bar, but more than that, does so in a way that decisively reverses a trend. In this case, the reversal is out of a downtrend and into a potential uptrend. The weekly chart also puts the VIX's recent action in perspective.
S&P 500 Weekly Chart, with VIX and Volume
 [9]
[9]
Source: TradeNavigator
It's a great start; this is definitely what the beginning of a recovery would look like. It's still too soon to call it a done deal though. Investors have been rather moody of late, and quick to change their minds. It would also be naive to ignore the fact that headlines prompted the volatility, perhaps because traders were wishing/hoping to see the glass as half full. Headlines could just as easily send things in the other direction though, particularly with an interest rate increase decision from the Federal Reserve due in a couple of weeks.
In other words, don't be too quick to react here. Let's see if the market can actually hold up to a real test of this bullishness.
The nice part is, it's clear where all the key lines in the sand are.