The market may not have finished last week on a terribly bullish foot, but it didn't matter. Stocks did more than enough bullish work during the prior four trading days to leave the S&P 500 at 2549.33 on Friday. That was 1.2% better than the prior Friday's last trade, carrying the market deeper into record-high territory.
 [1]It's an unlikely outcome, to be sure. Aside from the fact that we're still waiting on the usual September pullback, valuations are more than pushed to their limit, with investors essentially counting on a favorable tax overhaul gaining approval in Washington D.C. We'll see, and we'll see if it even matters if it happens. It may end up turning into a "buy the rumor, sell the news" kind of event. In the meantime, while the bigger-picture momentum remains bullish, this is when and where we've been getting some short-term selling pressure.
We'll look at it all below, as always, right after a closer look at last week's big economic announcements and previewing this week's economic news.
Economic Data
Last week was loaded with economic news, with the grand finale being last month's (mostly meaningless) unemployment report for September. Let's just move in order of appearance though, beginning with last month's ICM data. The manufacturing version of the ISM index romped to 60.8 versus expectations for a slight dip, and the services index also ripped higher rather than rolling in where it found itself for August. This is good news, though anything above 50 is technically a good reading for the ISM indices.
ISM Index Charts
 [2]
[2]
Source: Thomson Reuters Eikon
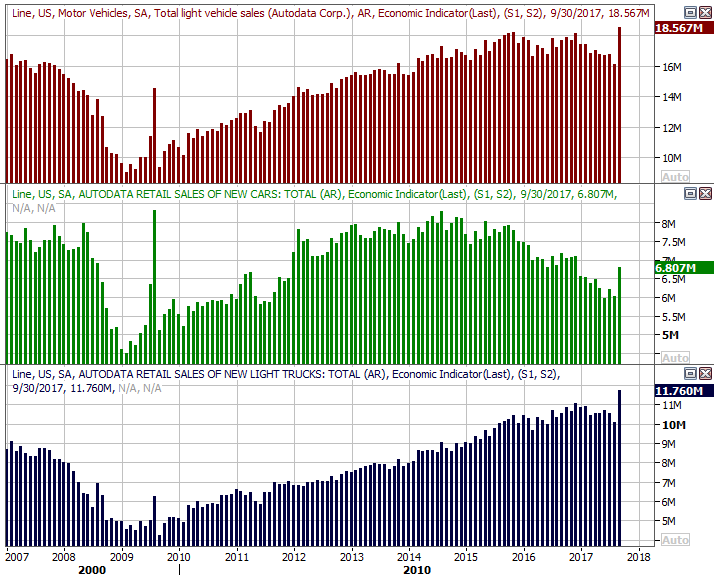
Auto sales were also far better than expected last month, reversing an August lull. Be very careful here though. The post-hurricane insurance payouts to replace destroyed cars isn't something that will be sustained… though it may linger into October. We'll see. Either way, the trend was moving in the wrong direction before last month's surge. The surge may well have flushed out the last of the would-be buyers for the cycle. Think of it as a reverse capitulation. Again, only time will tell here.
Auto Sales Charts
 [3]
[3]
Source: Thomson Reuters Eikon
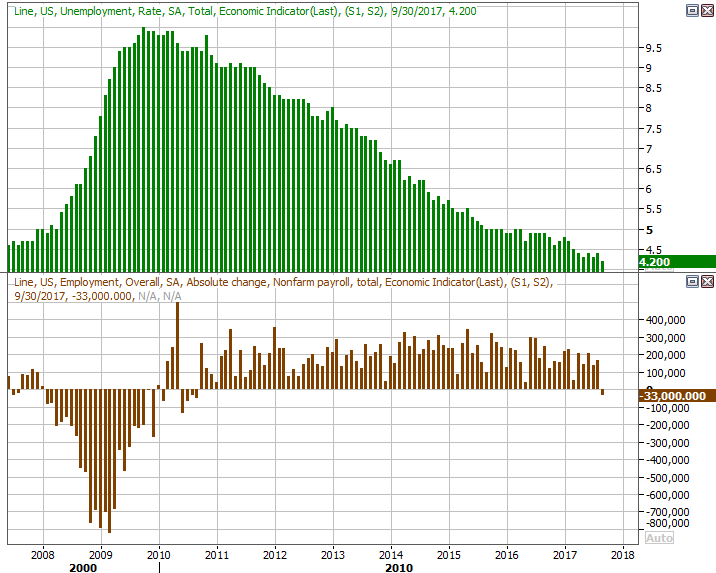
Last but certainly not least, last month's unemployment rate fell from 4.4% to 4.2% despite the fact that we lost 33,000 payrolls last month… the first time in years jobs were lost on a net basis. Again, the impact of two (and technically three) hurricanes have skewed the numbers to the point where they mean very little. In fact, we took a closer look at ALL the relevant employment data for last month at the website and found the job loss figure was highly misleading [4]. The hurricane may have actually improved the jobs picture.
Unemployment Rate and Job Growth Charts
 [5]
[5]
Source: Thomson Reuters Eikon
Everything else is on the grid.
Economic Calendar
 [6]
[6]
Source: Briefing.com
This week won't be as busy, but we do have a couple of important items in the queue.
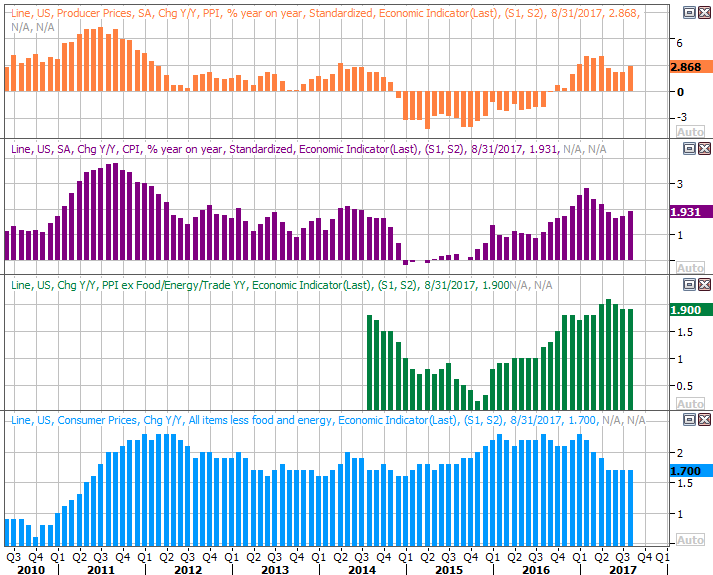
First, we'll be hearing about last month's inflation rates — for producers and consumers. Economists are looking for both to heat up, on a core as well as a non-core basis… and inflation is already relatively firm. Yes, the hurricane prodded this data as well, and has pretty much forced the Fed into a rate hike sooner than later. Traders are now betting on a December increase in the Fed Funds rate, ahead of the one previously expected in March of next year.
Inflation Data (Annualized Rates) Charts
 [7]
[7]
Source: Thomson Reuters Eikon
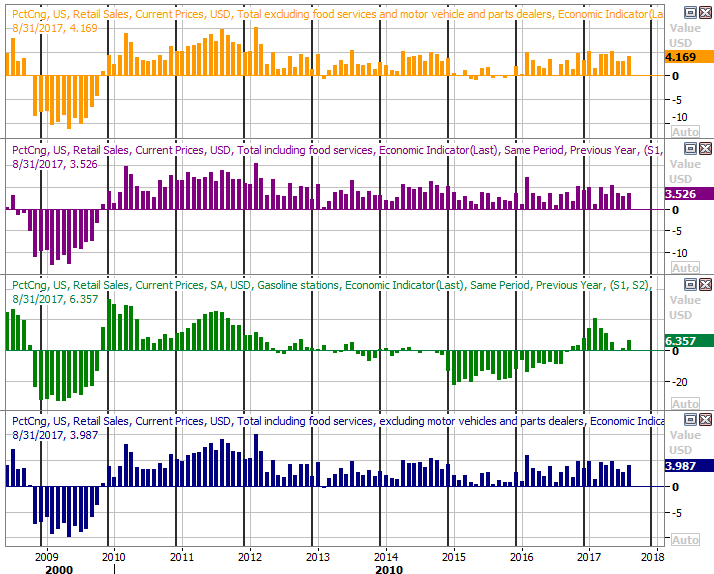
We're also going to hear about last month's retail sales this week, and yes, once again hurricanes likely impacted this data — though for the better. Even without car sales factored in, spending is expected to have grown 0.8% on a month-to-month basis, extending a long-standing string of growing consumerism. Individuals are doing their part to support the economy.
Retail Sales Growth Charts
 [8]
[8]
Source: Thomson Reuters Eikon
Index Analysis
There's no denying it… as of the end of last week, the bulls were firmly in charge. As unexpected and as unlikely as forward progress is at this time, it's happening nonetheless. Trade against the grain at your own peril.
On the flipside, know that the market is getting really good at slowing down or moving sideways — even if not pulling back — just when it looks like it's taken flight.
Take a look at the weekly chart of the S&P 500 to see this reality. Not only has the index continued its amazing runup that took hold in November of last year, it's actually accelerated above and beyond a resistance line (blue, dashed) that's kept the index in check since March.
S&P 500 Weekly Chart
 [9]
[9]
Source: TradeNavigator
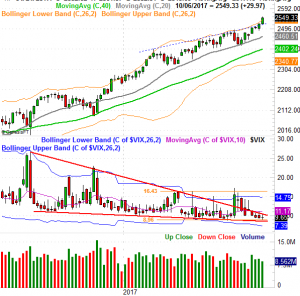
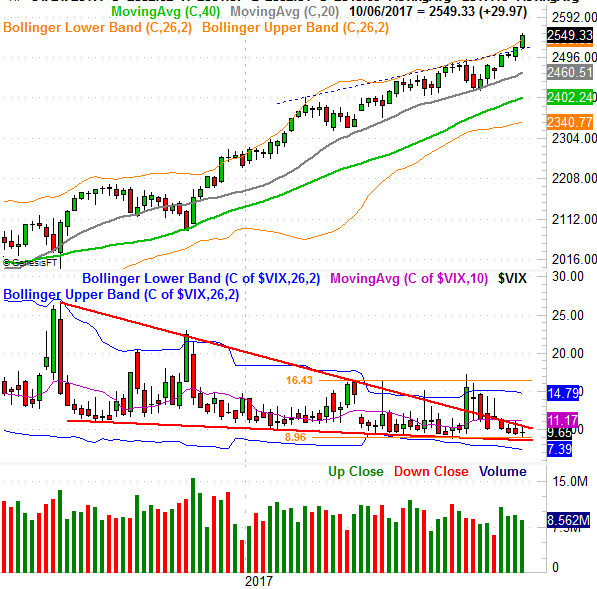
The concerns? An overheated market, for one. This recent leg of the rally is largely built on assumptions that a favorable tax-plan overhaul is inevitable, and it may not be in the cards… at least not yet. Perhaps more alarming, though, is that the VIX is back to an absolute floor. With no room to move any lower, the S&P 500 (and all other stocks) is going to have a tough time moving any higher.
Zooming into a daily chart of the S&P 500 doesn't tell us a whole lot more, but the daily chart does reveal a couple of noteworthy details.
First though not foremost, on this daily chart we can see the index is bumping into its upper Bollinger band, which has been a problem (sooner than later) in the recent past. It's also on the daily chart we can see how much separation there is between the S&P 500's current value and the 50-day moving average line (purple). The distance between the two is unusually wide right now… wide enough that it shouldn't be surprising to see the gap close again.
S&P 500 Daily Chart
 [10]
[10]
Source: TradeNavigator
Most interestingly on the daily chart — and not in a bullish way — we can see that the bullish volume over the course of the past couple of weeks was fading the whole time. This is a subtle hint that most traders don't actually believe this rally is for real, or built to last.
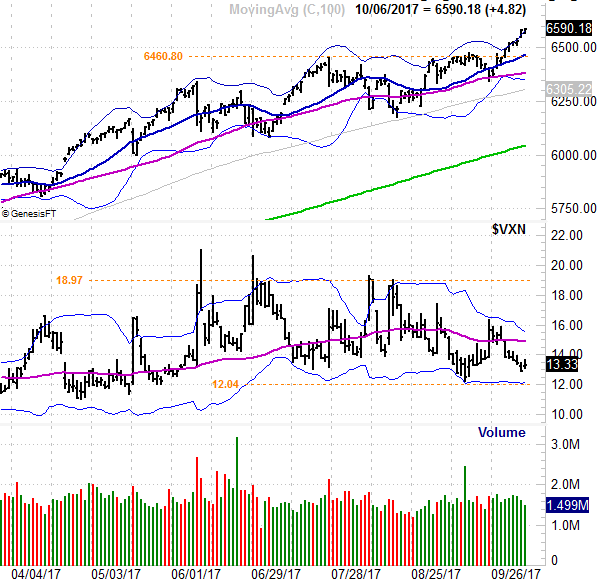
A look at the NASDAQ's daily chart doesn't add anything new to the analysis, except for perhaps the idea that the VXN does have room to move lower, suggesting the NASDAQ has room to move higher. This is a mixed message at best, though.
NASDAQ Composite Daily Chart
 [11]
[11]
Source: TradeNavigator
They say "the trend is your friend" for a reason; we have to assume the current bullish momentum will remain in place until we clearly see it can't. But, with the market up 13% year to date and up 22% since early November of last year, don't be shocked when we finally start to pay the piper.