As was predicted, Monday's and Wednesday's drubbings were so bad, stocks bounced pretty firmly on Thursday and Friday. Don't get too excited just yet though. As big as the rebound move was, it didn't lift any of the indices above any of their key lines in the sand. The bulls still have much to prove, and they still have to prove it in a tricky environment ("sell in May," strong inflation, lingering pandemic, etc.). Anything could still happen from here.
We'll weigh the odds below. First, let's run through last week's big economic news, and preview what's in store for this week. Fortunately, the next few days shouldn't be as raucous as the past few have been… at least in terms of economic reports.
Economic Data Analysis
The simplest assessment of last week's data is, prices are rising, and nobody cares.
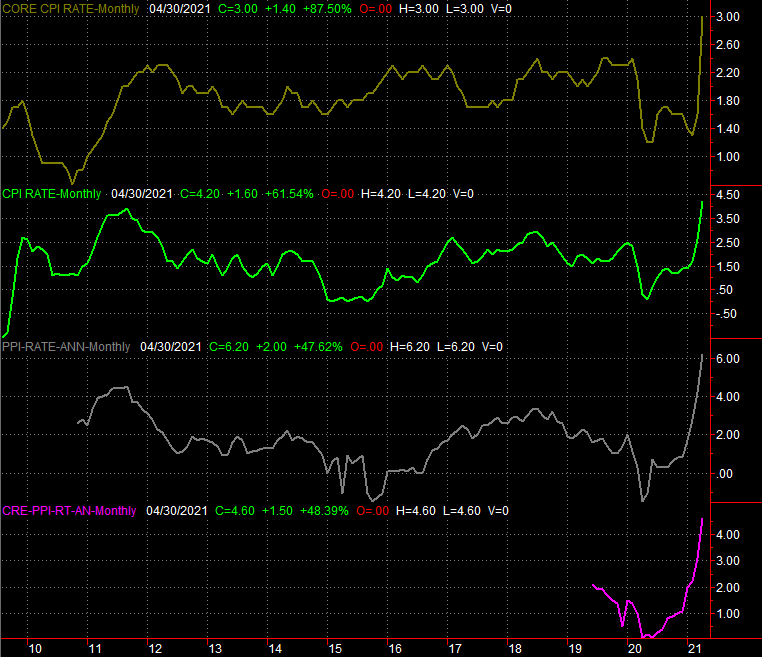
As was anticipated, inflation is rearing its head. Consumers saw a second straight month of brisk price increases, driving overall inflation to a multi-year high of 4.2%. Even on a less-volatile core (not counting food and fuel) basis things are still tough, with prices up 3.0% year over year.
That's just the country's factories and processing plants passing along their higher costs, mind you. Producer inflation now stands at 6.2%, and still stands at 3.0% (annualized) when taking out less-controlled costs like food and fuel. Both of those are also multi-year highs.
Annualized Inflation Charts
 [1]
[1]
Source: Bureau of Labor Statistics, TradeStation
It's easy to chalk up the inflation surge as an unfair comparison to last April's environment, which was fully suppressed by the pandemic's arrival in the United States. And, there's certainly a bit of that. This is the second big month of price hikes though, and given the flood of cheap dollars put into circulation since then, this isn't something to dismiss.
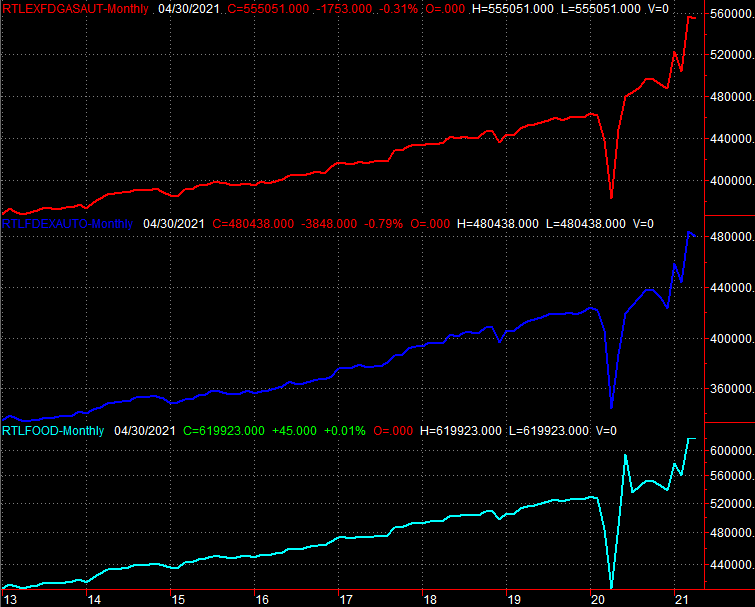
The curious thing is, higher prices didn't deter consumers from buying, Retail spending in stores in April was essentially even with March's figures, versus expectations of 1.2% growth. But, just remember March's spending surged 10.7% year over year, and was a tough comp. Consumerism remains alive and well despite most stimulus checks being spent the month before.
Retail Sales Charts
 [2]
[2]
Source: Census Bureau, TradeStation
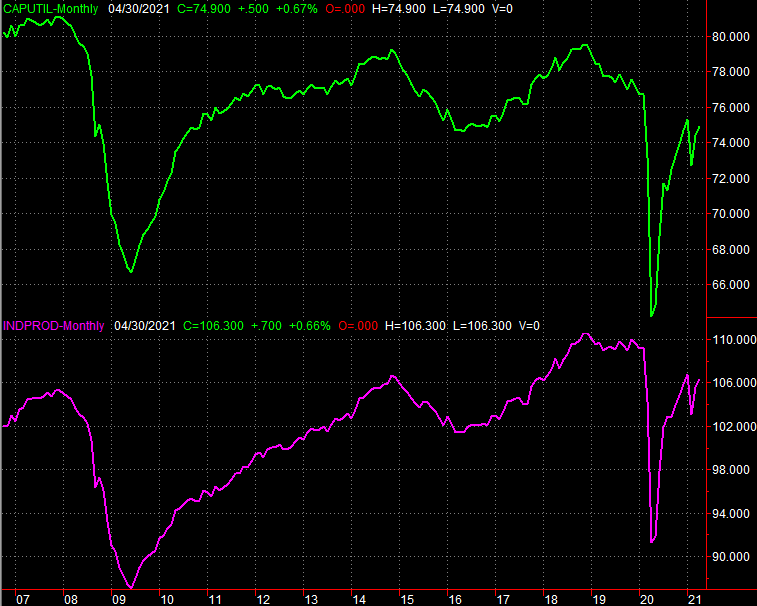
Finally, after bumping into a slight headwind a month earlier, industrial productivity made forward progress again in April. Utilization of the nation's prediction capacity grew to 74.9%, almost bouncing back January's 75.3% when things began inching back to normal (and factories were cranked up to meet renewed demand). Meanwhile, the industrial production index improved from 105.6 to 106.3 in April, also moving to within site of January's surge figure. This slow and steady progress on these fronts bodes well for the economy despite other red flags.
Industrial Productivity and Capacity Utilization Charts
 [3]
[3]
Source: Bureau of Labor Statistics, TradeStation
Everything else is on the grid.
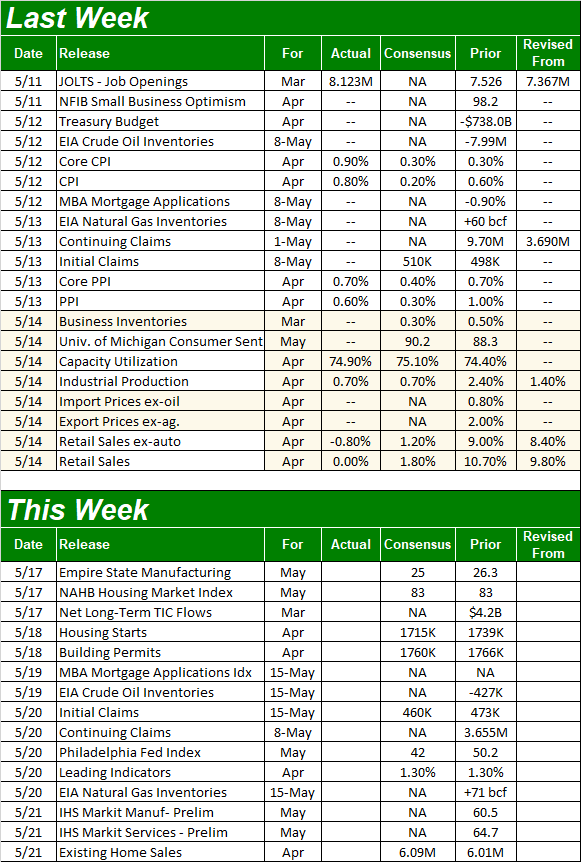
Economic Report Calendar
 [4]
[4]
Source: Briefing.com
This week should be a relatively light one, though it's a big one for real estate. On Tuesday we'll hear about last month's building permits and housing starts, and on Friday we'll get sales figures for existing homes.
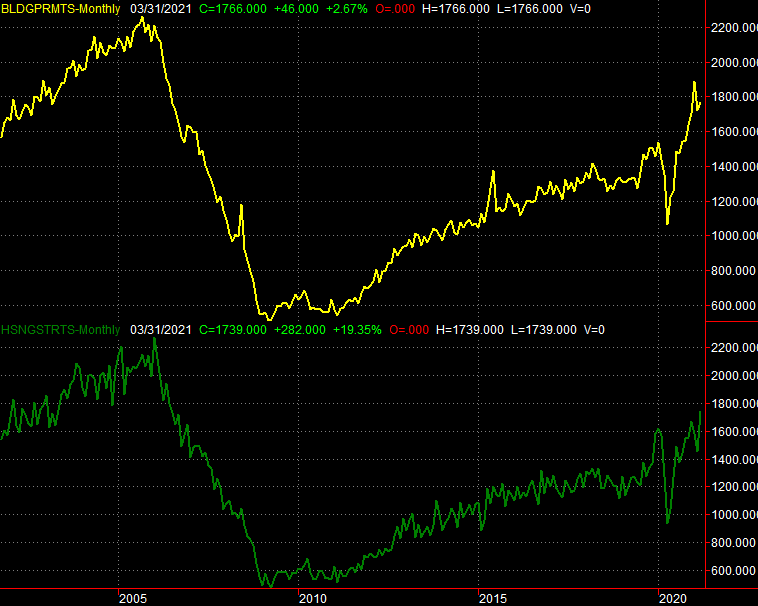
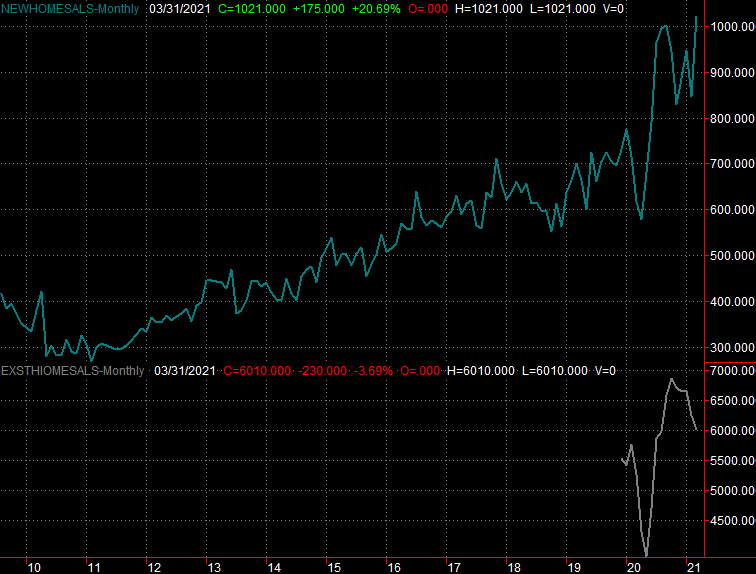
Look for strong numbers on the permits and starts front, as demand for homes continues to soar. Likewise, look for strength on the existing home sales front. Home sales are largely being held back by a lack of supply, but even so, the demand is so strong that the crimped supply can be overcome…. at the right price.
Housing Starts and Building Permits Charts
 [5]
[5]
Source: Census Bureau, TradeStation
New and Existing Homes Sales Charts
 [6]
[6]
Source: National Board of Realtors, Census Bureau, TradeStation
Stock Market Index Analysis
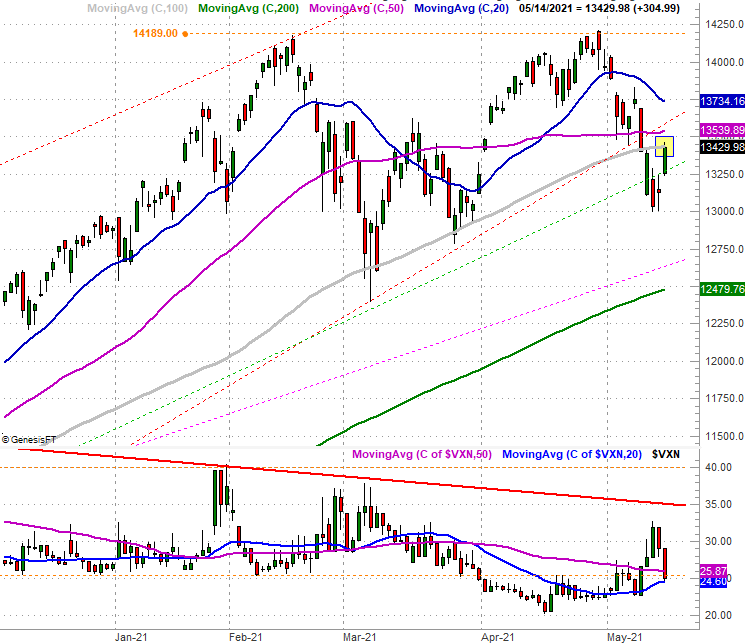
The NASDAQ Composite bounced back firmly from the drubbing suffered early last week. When all is said and done though, that bounce accomplished very little. Take a look. While the composite briefly moved above this level on Friday, the close was still right at the 100-day moving average line (gray). It's suspicious simply because the 100-day average has been both support and resistance a few times since March. To see it still right at this mark now confirms it will not be an easy barrier to hurdle.
NASDAQ Composite Daily Chart, with VXN
 [7]
[7]
Source: TradeNavigator
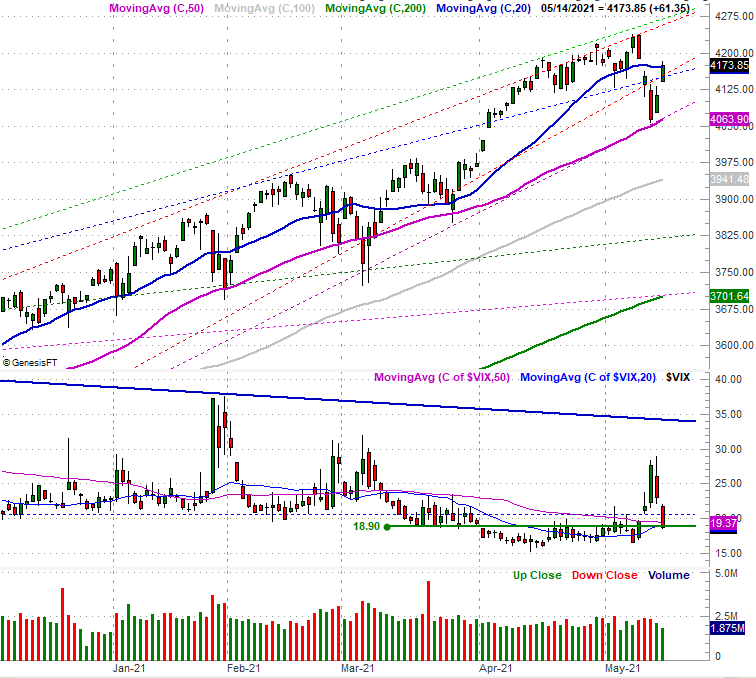
The S&P 500's daily chart is telling a similar (though not identical) story. It managed to find support at (and push off of) its 50-day moving average line (purple) on Wednesday of last week, but the rebound was halted right at the 20-day moving average line (blue)… at least on a closing basis. Both of these moving average lines have been support and resistance for the index in recent weeks, so we shouldn't blow this hesitation off.
S&P 500 Daily Chart, with VIX and Volume
 [8]
[8]
Source: TradeNavigator
That's not the biggest worry evident on the S&P 500's chart, however. See the volume bars at the bottom? More specifically, do you see the lack of volume behind Thursday's and Friday's gains? Stocks may have been soaring, but it's not as if there was a meaningful degree of participation in the move.
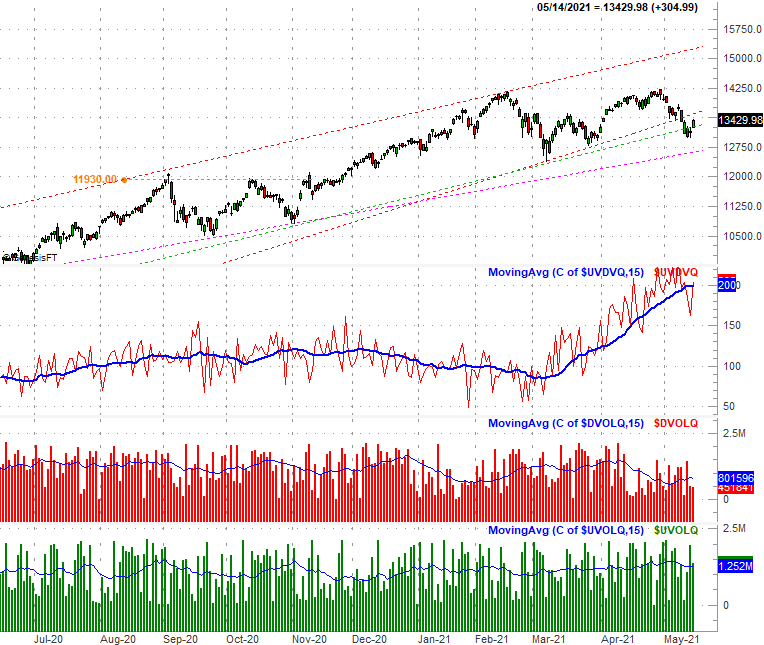
And it's not like there was simply a lack of bearish volume altogether on these days. Drilling into the NASDAQ's daily up volume and down volume (at the bottom of our chart below), while bearish volume was below average, bullish volume on those days was just barely above average… not the sort of interest one would expect to see when stocks are rallying as much as they did. Typically, those big days following steep selloffs have encouraged a flood of buyers to jump in. They're not jumping in this time.
NASDAQ Composite Daily Chart, with Up/Down Volume Comparison and Daily Up/Down Volume
 [9]
[9]
Source: TradeNavigator
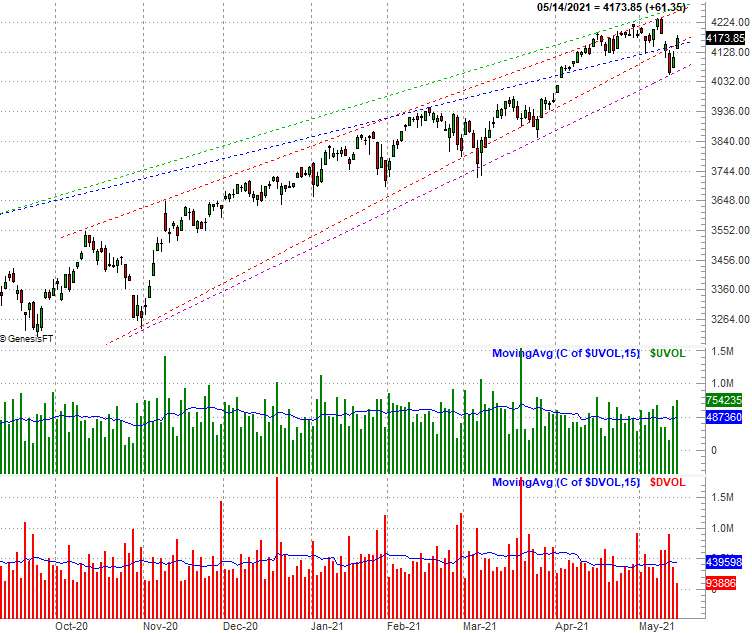
Here's the S&P 500 compared to the NYSE's daily up and down volume. It looks a little healthier/bullish. But, still… given the enormity of Friday's bounce effort AFTER such a big correction, one might have expected stronger participation.
S&P 500 Daily Chart, with NYSE Up/Down Volume
 [10]
[10]
Source: TradeNavigator
Or, maybe the growing disinterest in being a buyer or seller has more to so with the fact that investors see — or at least sense — something bigger going on with this 14-month-old rally.
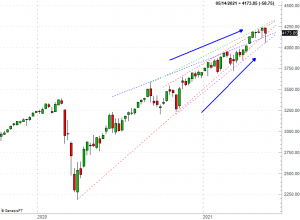
One has to take a step back and look at the weekly charts from a distance to see it, but it's there. The S&P 500 is getting squeezed into the tip, or point, of a converging wedge pattern. The closer the index gets to the 4500 area, the less room it has to maneuver. That's going to force the bulls and the bears to make a tough decision they haven't had to make in a long, long time, as it will force the index outside of a well-established confine.
S&P 500 Weekly Chart
 [11]
[11]
Source: TradeNavigator
Just know that the S&P 500 typically doesn't make it all the way to a converged point of a triangle, or wedge. Traders typically make their move when the inevitable comes into view. Also know that a rising or bullish wedge more often than not results in a bearish breakdown below the lower boundary of the pattern, as there's lots of pent-up profit-taking to be done.
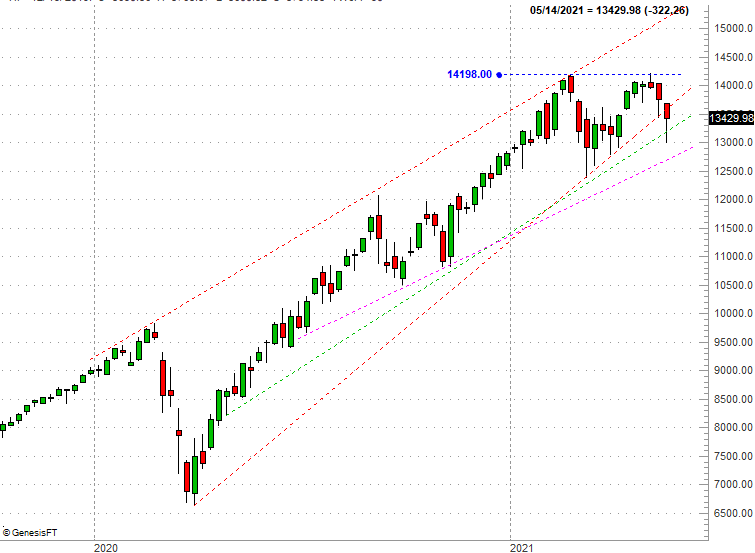
The NASDAQ Composite's wedge shape isn't quite as well defined, nor is it narrowing as quickly. Nonetheless, it's there. Also notice the composite has experienced resistance a couple of different times now at 14,200. It would be short-sighted to assume that doesn't matter.
NASDAQ Composite Weekly Chart
 [12]
[12]
Source: TradeNavigator
Maybe the doubts about the rally aren't merited. Maybe it's just that they're not merited yet. Whatever the case, the market's been kind enough to show us exactly where the floors and ceilings are, including for the VIX and the VXN. That's what we'll be watching closest this week, especially now that the dead-cat bounce has run its course.