
Stocks continued to lose ground last week, with the S&P 500 sliding 2.7% over the course of the holiday-shortened week. And yet, the recovery effort that got going near the end of last year is still intact. In fact, it may be better off following last week's lull than it would have been had it continued rolling higher. That's because when the bulls had to make a stand at a key technical floor, they did so.
We'll look at that stand in a moment. First, let's recap last week's biggest economic news and take a look at what's in the cards for this week.
Economic Data Analysis
Last week was pretty well loaded with news, on several fronts. Chief among these data points, however, is confirmation of continued inflation. The release of the minutes from the most recent meeting of the Federal Reserve's governors indicates they're still plenty concerned about inflation. And, they should be. Friday's personal spending and personal income figures suggest prices rose 0.6% month-over-month. The Fed's going to have to keep fighting that kind of demand.
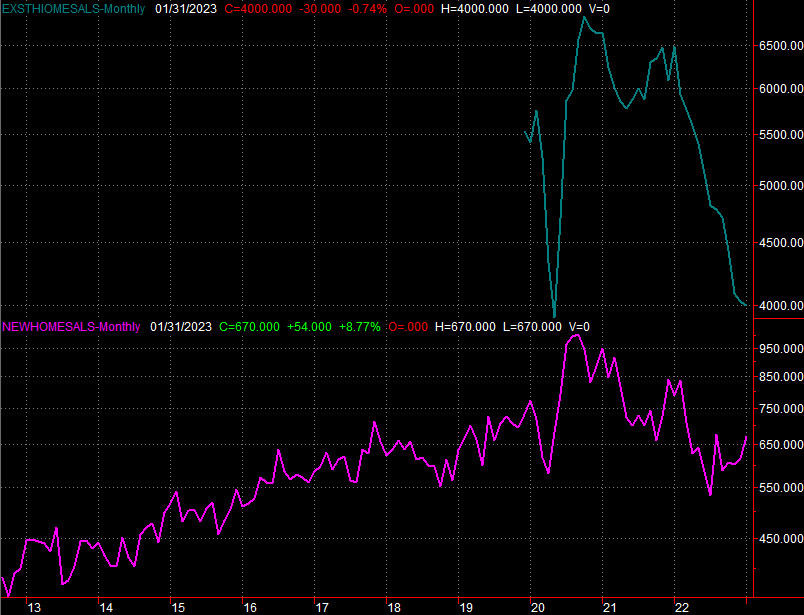
It was also a big week for real estate data, and homes sales data in particular. On Tuesday we learned sales of existing homes slipped just a bit in January, to an annual pace of 4.0 million. Sales of new homes, however, jumped from a yearly pace of 616,000 to 670,000. That rekindles the rebound effort that started un the middle of last year, but existing home sales remain comically weak. That's why the new-home sale bounce is actually a bit suspect.
New, Existing Home Sales Charts
 [1]
[1]
Source: Census Bureau, National Association of Realtors, TradeStation
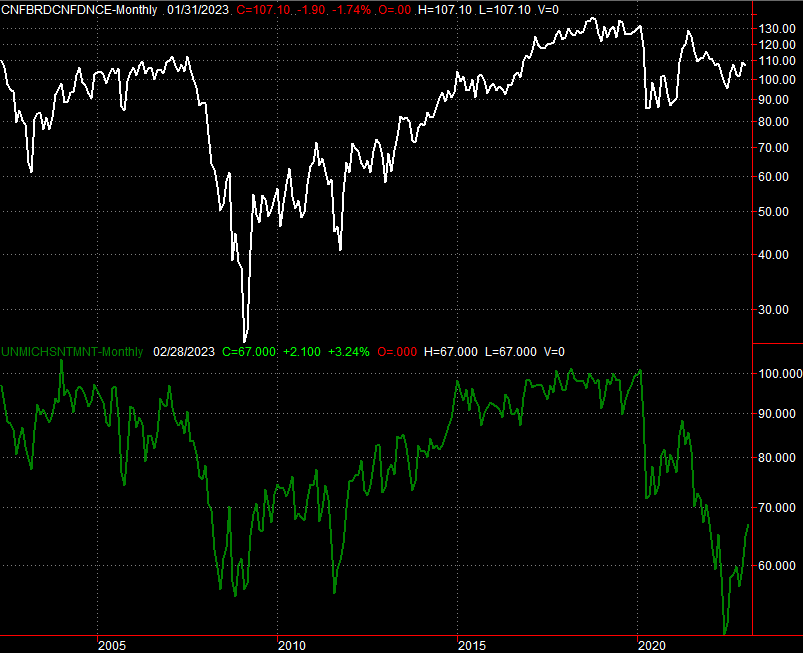
We also got the third and final reading for February's University of Michigan Sentiment Index on Friday. It was up — again — continuing its recovery from mid-2022. While still low on an absolute basis, the trajectory is the key.
Consumer Sentiment Charts
 [2]
[2]
Source: Conference Board, University of Michigan, TradeStation
Funnily enough though, the Conference Board's consumer confidence figure isn't showing us the same rebound. That's not completely outrageous, since the two indicators measure slightly different things. All the same, you'd expect them to move somewhat in tandem.
February's consumer confidence report will be posted on Tuesday of this week. Economists are looking for another shallow improvement.
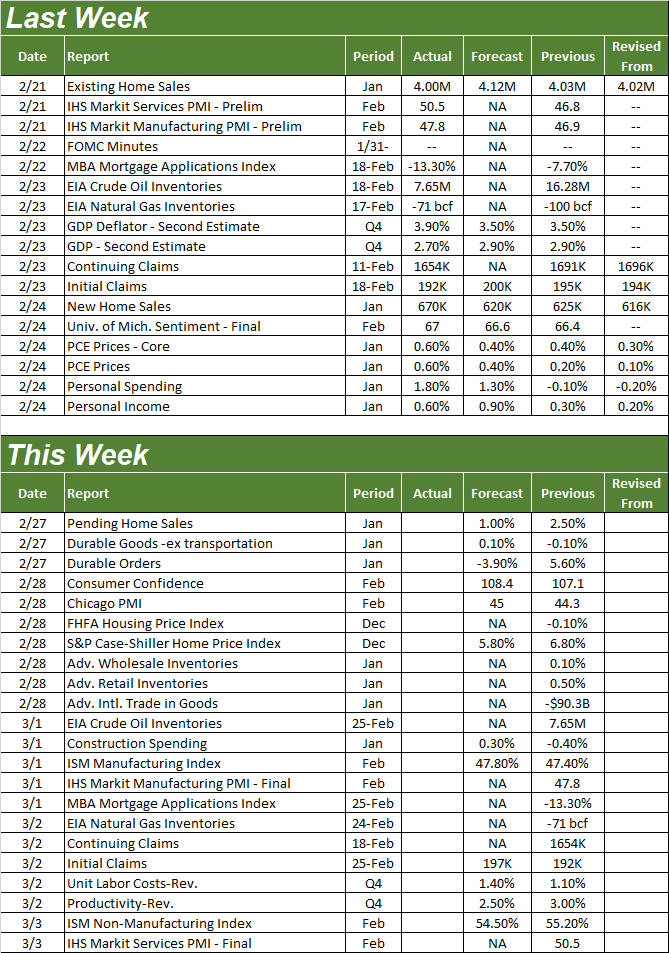
Everything else is on the grid.
Economic Calendar
 [3]
[3]
Source: Briefing.com
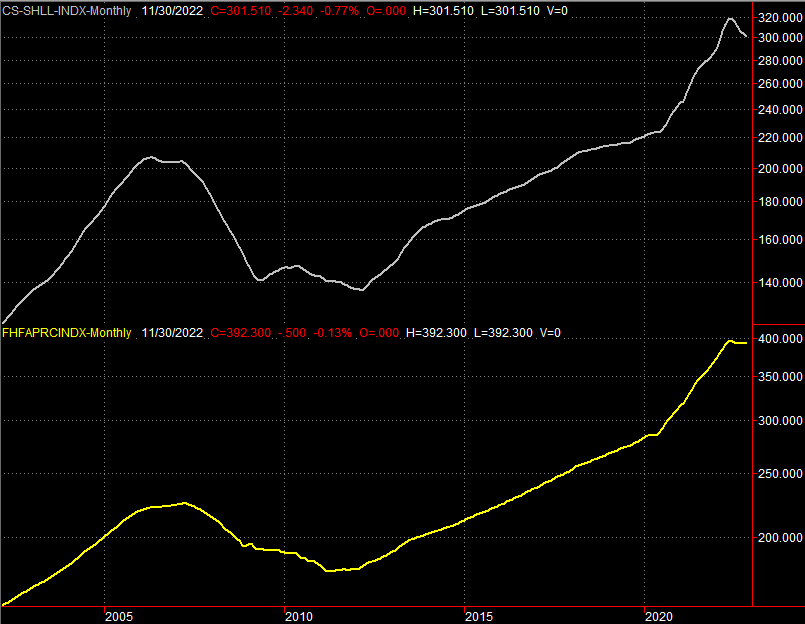
In addition to February's consumer confidence report from the Conference Board, this week is another big one for real estate. Look for the FHFA Housing Price Index as well as the S&P Case-Shiller Home Price Index to be updated on Tuesday as well. Both have been sliding lower since the middle of last year, and the pros don't believe this pressure has let up as of December… the month we'll be getting data for this week.
Home Price Charts
 [4]
[4]
Source: Standard & Poor's, FHFA, TradeStation
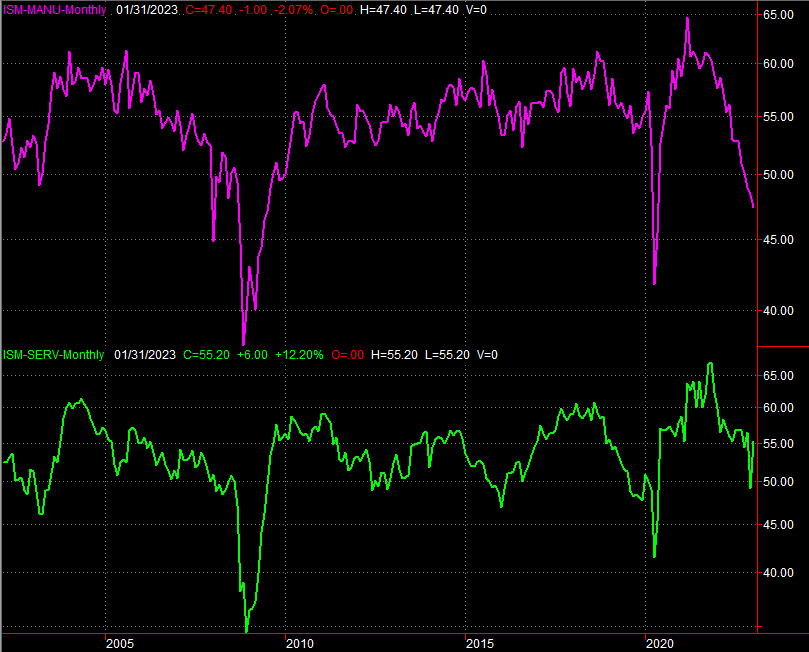
Finally, we'll also get February's ISM figures this week. The manufacturing index will be updated on Wednesday, with the services number coming on Friday. Economists believe manufacturing activity finally stabilized in February, but did so at sub-par levels. The services index has been above (and should remain above) the key 50 mark, but the forecast is still calling for a slight lull from January's level.
ISM Services, Manufacturing Index Charts
 [5]
[5]
Source: Institute of Supply Management, TradeStation
Both ISM indexes and bigger-picture trajectories are less-than-encouraging.
Stock Market Index Analysis
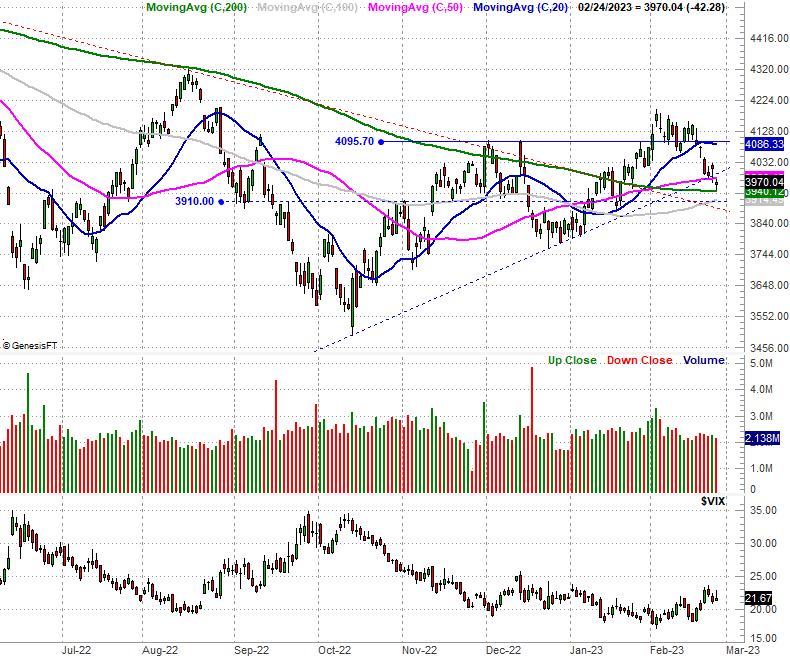
The budding bull market was almost broken last week… almost. Take a look. The S&P 500 peeled all the way back to its 200-day moving average line (green) at 3940. It only had to kiss it, however, for the bears to stop selling and the bulls to start nibbling again. And, although some other technical floors were broken, the support right around 3913 is still untested as well. Also notice that while Friday's losses were sizeable, the volume behind the move wasn't exactly staggering.
S&P 500 Daily Chart, with VIX and Volume
 [6]
[6]
Source: TradeNavigator
The NASDAQ Composite is in a similar – but not identical – scenario. It closed right at its 200-day moving average line on Friday after falling just a bit below it. But, the 50-day and 100-day moving average lines (pink and gray, respectively) at 11,190 and 11,062 (again, respectively) are still intact as prospective technical floors.
NASDAQ Composite Daily Chart, with VXN
 [7]
[7]
Source: TradeNavigator
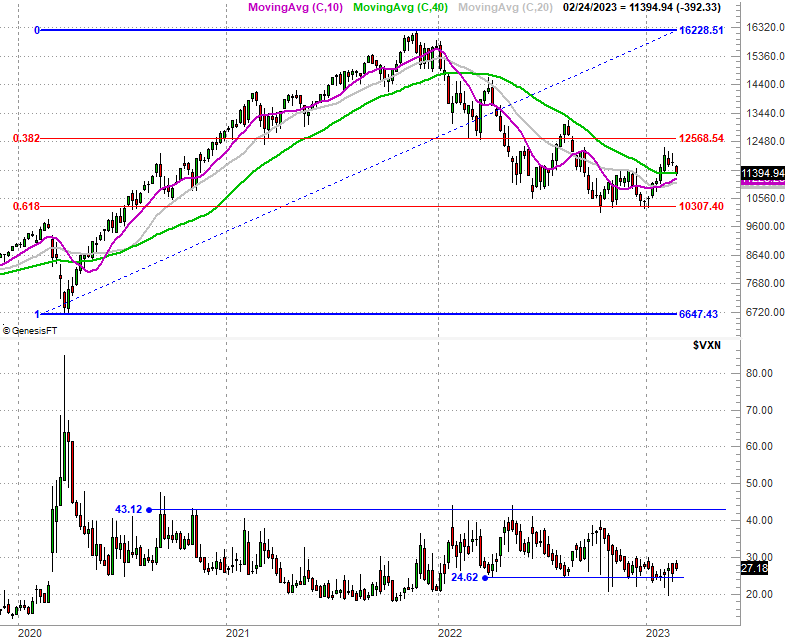
Here's the weekly chart of the NASDAQ for some added perspective. From this viewpoint we can see just how important the Fibonacci retracement lines (a retracement of the rally from early-2020 to late-2021) are at this time… particularly in terms of establishing the technical floor that started this new bull market effort. Mostly though, notice here how the 50-day moving average is oh-so-close to moving back above the 200-day line for the first time since early 2022. A cross of the former line over the latter line would be considered a "golden cross" that portends a bigger-picture bull trend.
NASDAQ Composite Weekly Chart, with VXN
 [8]
[8]
Source: TradeNavigator
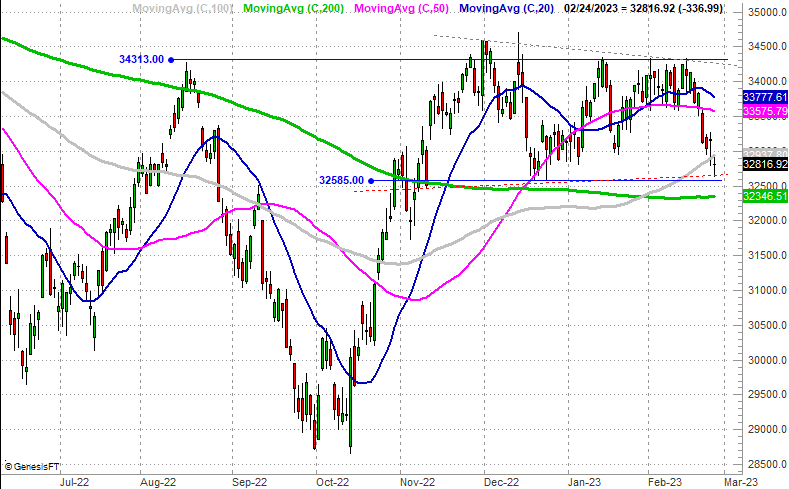
Even the Dow Jones Industrial Average is still holding the line. Friday's low of 32,643 lines up with the low from December as well as one of the more important daily lows from November (red, dashed). December's horizontal low at 32,585 has also not been broken, and the Dow itself remains well above its 200-day moving average line (green) at 32,347.
Dow Jones Industrial Average Daily Chart
 [9]
[9]
Source: TradeNavigator
Stocks are starting this week at a major crossroads. The current momentum is technically bearish, but the recent pattern of late is reversals rather than follow-through. The fact that all the indices bumped into technical floors last week — and even started to push up and off of them — only ups the odds that after a three-week selloff we're ready and ripe for a reversal.
Of course, this is also a scenario where we absolutely should wait to see which direction stocks are going to move from here. A little more downside from here could easily turn into a lot more downside, as there's no more technical floors a whole lot lower than where the indices ended last week.
On the flipside, it won't take a whole lot for all of these same indices to get back above all of the key moving average lines they fell under just within the past few days. Such moves would also be a bullish catalyst.