
 [1]What started out as a lousy week ended on a high note. Although the market lost 0.3% of its value last week, at one point it was in the hole to the tune of nearly 1.3%.
The rebound effort is far from a well-founded recovery, but it does buy some time for the bulls to regroup and maybe, just maybe, begin an unlikely summertime rally even after it's logged the best first-six-months of the year since 1997. A trade deal that pares back many of the newly-imposed tariffs could do the trick. That would skew an already skewed year thus far, which is 'supposed to be' tepid through August, then bearish in September and early October to set up a year-end rally. But, perhaps norms were meant to be defied.
Or, maybe we're getting ready to start a 'sell the news' phase.
We'll explore it all below, as always, after recapping last week's big economic announcements and previewing this week's news.
Economic Data Analysis
Last week was a big one for real estate, though a mixed one as well.
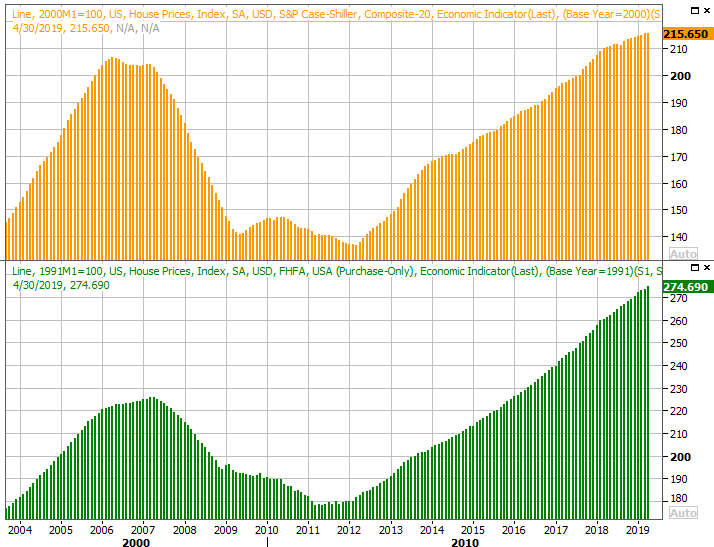
Home values continue to rise, though the pace of forward progress also continues to slow. The FHFA Housing Price Index indicated a 0.4% improvement from March's levels in April, while the Case-Shiller Index was up 2.5% year-over-year for April, versus expectations of a 2.6% increase.
S&P Case-Shiller and FHFA Home Pricing Index Charts
 [2]
[2]
Source: Thomson Reuters
It's not necessarily the end of the world. Steady increases rather than red-hot price growth may actually be good for real estate, making it more accessible to most people. It should also be noted that much has changed since April. Namely, interest rates are lower, making homes even more affordable. On the flipside…
New home sales fell in May, and rather dramatically at that. The annualized pace of 626,000 was markedly lower than April's 679,000, and nowhere near the 683,000 economists were expecting.
New, Existing Home Sales and Inventory Charts
 [3]
[3]
Source: Thomson Reuters
Curiously though, the lull wasn't matched by sales of existing homes. It's possible that a lack of inventory and relatively more affordable existing homes (homebuilding materials are costly right now) is the culprit. Starts and permits have also been suppressed of late.
Whatever the case, the housing market remains in a transitory state.
And, though it wasn't a data set we previewed a week ago, a look at last week's crude oil inventory levels would be time well spent. Breaking a fairly long growth stride, crude inventories fell by 12.8 million barrels, coinciding with a second week of gains for oil prices.
Crude Oil, Natural Gas Inventory Charts
 [4]
[4]
Source: Thomson Reuters
It's too soon to call this a game-changer; disrupted supply lines overseas has a lot to do with the price increase as well. But, this is a healthy step in the right direction for drillers and refiners, who have been tangling with prices that make it tough to turn a profit.
Everything else is on the grid.
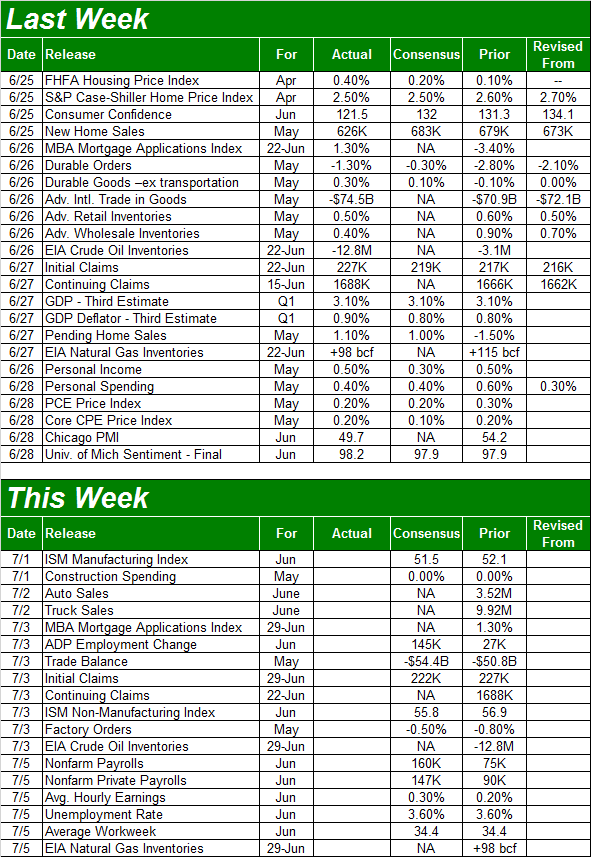
Economic Calendar
 [5]
[5]
Source: Briefing.com
This week is going to be a doozy, crammed into only four trading days.
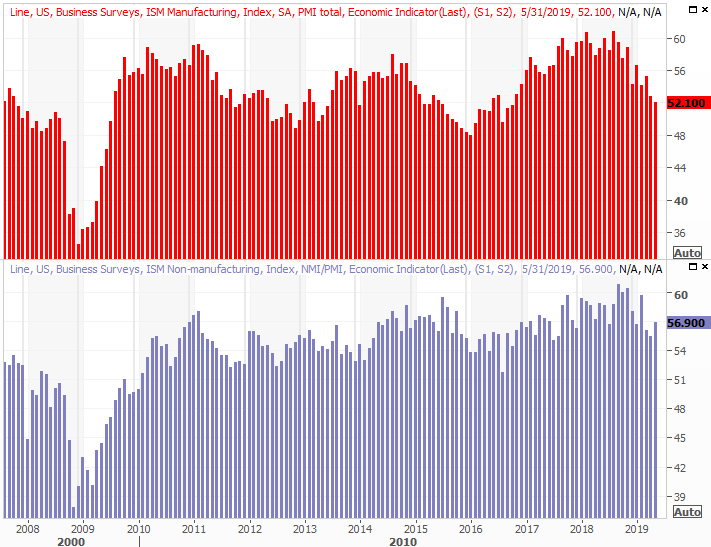
The party starts on Monday with June's ISM Manufacturing Index, which will be followed by the services version of the index on Wednesday. The pros are calling for dips in both data sets, though each should remain above the critical 50 level. Even so, both data sets are in the midst of measurable declines that could drag both below 50 in the foreseeable future.
ISM Manufacturing, Services Index Charts
 [6]
[6]
Source: Thomson Reuters
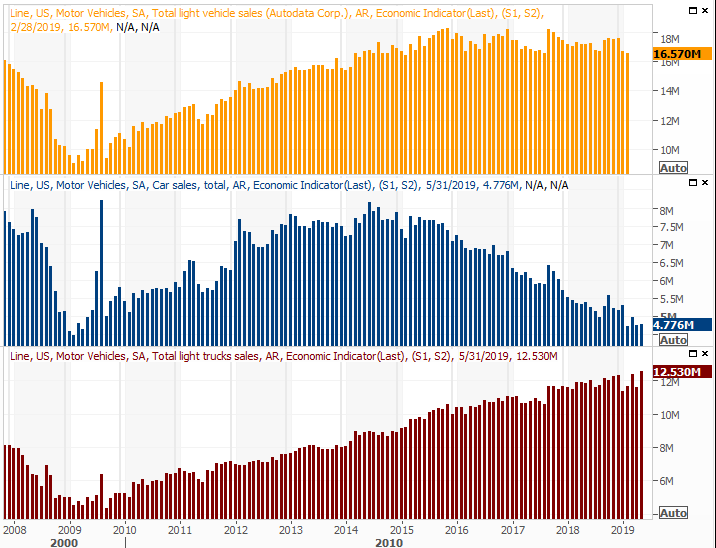
On Tuesday look for the major U.S. auto names to release sales data for June. While the totals won't be pieced together until after Tuesday, it's possible to get a feel with the initial reports.
We need a win here. While truck sales continue to improve, declines in passenger car sales are more than offsetting that progress. It's possible we may be poised for a new wave of cyclical buying, with 'peak' auto now four years in the past. That's not a resurgence etched in stone though.
U.S. Automobile Sales Charts
 [7]
[7]
Source: Thomson Reuters
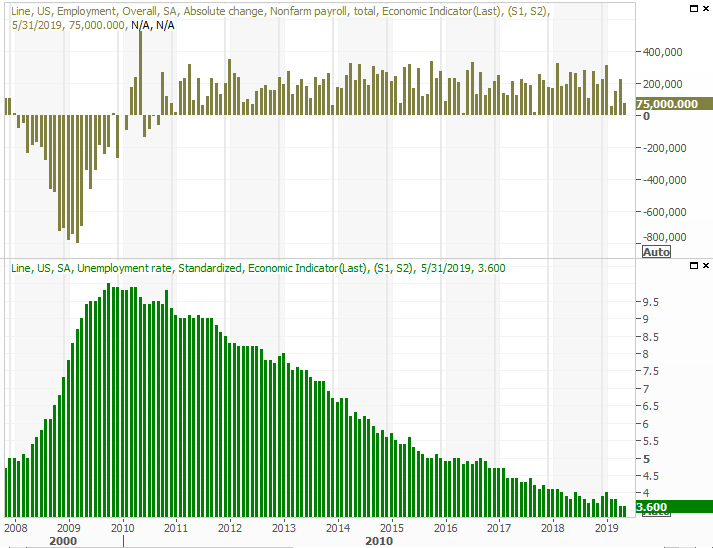
The biggie, of course, will be Friday's jobs report for June. Economists are calling for 160,000 newly-created payrolls to be filled. That won't be enough to lower the unemployment rate of 3.6%, though that unemployment rate is already about as structurally low as it can get.
Payroll Growth and Unemployment Rate Charts
 [8]
[8]
Source: Thomson Reuters
To that end, the more telling data will be the numbers not well-touted by the media… wages, participation rates and the raw number of people in and not in the labor pool. We'll have that full look for you at the website.
Stock Market Index Analysis
Indecision. The very next day after broaching record-high territory, the S&P 500 slipped into a nosedive. Four days later, it was on the mend again. While stocks ended the week on a high note, the market also ended the week on the fence. Anything could still happen here, and stocks are still more subject to headlines than a reflection of current (or even prospective) valuations.
Assume nothing here.
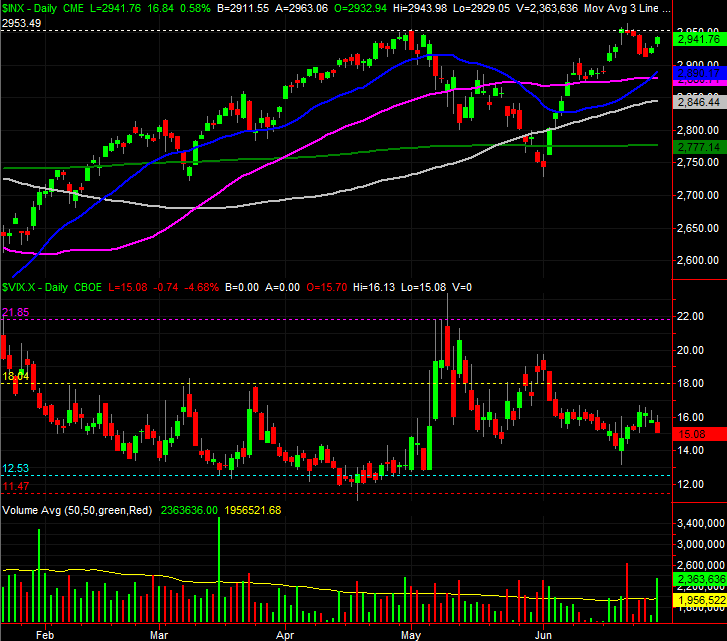
The ceiling in place for the S&P 500 is, of course, right around 2953.5… where it peaked in April, and where its highest close and best open was in June. It traded a little higher than that on June 21st, but hasn't opened or closed above there since. At the other end, the 20-day moving average line currently at 2890 is the floor to watch, though the 50-day line at 2880 may be more important. Either way, a test is coming. The bulls or the bears are going to have to take a stand. That stand should set the stage for a more prolonged move.
S&P 500 Daily Chart, with VIX, Volume
 [9]
[9]
Source: TradeStation
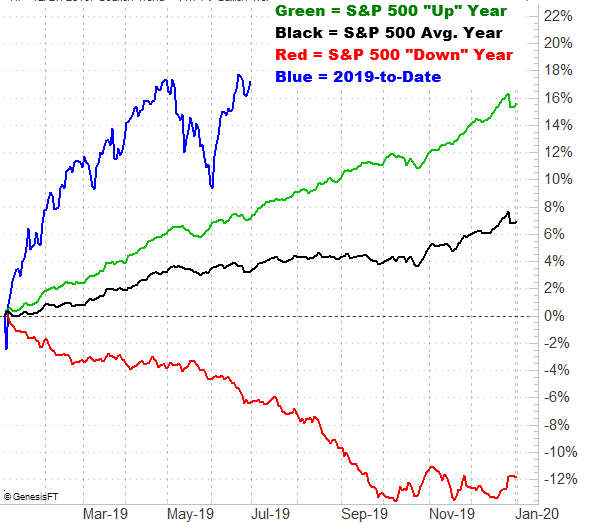
Here's the problem with the possibility of more bullishness… it's against the odds. Not only is the S&P 500 much higher than it should be at this time of year, the summer months are generally lethargic.
S&P 500 Daily Average Cumulative Performance
 [10]
[10]
Source: TradeNavigator
On the other hand, in a good (bullish) year, the S&P 500 is more than capable of making summertime progress. All the same, the market is starting out this year's summer further ahead than it would normally start it out.
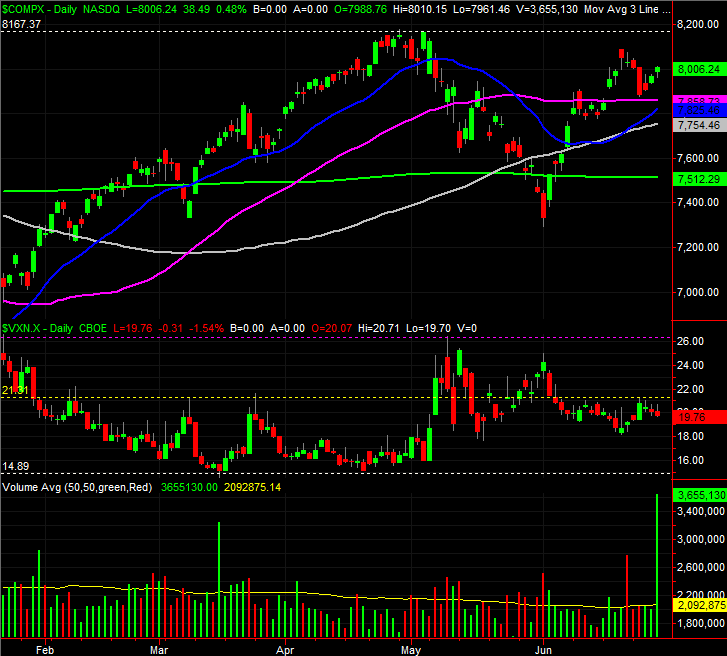
Interestingly – and this is the part that quietly taints the rally effort thus far – the NASDAQ Composite isn't leading the bullish charge. It's lagging, currently nowhere near its peak high from April. Generally speaking, the tech-heavy and growth-heavy NASDAQ should lead the way. The fact that it isn't indicates that investors may not have an overwhelming amount of faith in the advance effort that took shape late last week.
NASDAQ Composite Daily Chart, with VXN, Volume
 [11]
[11]
Source: TradeStation
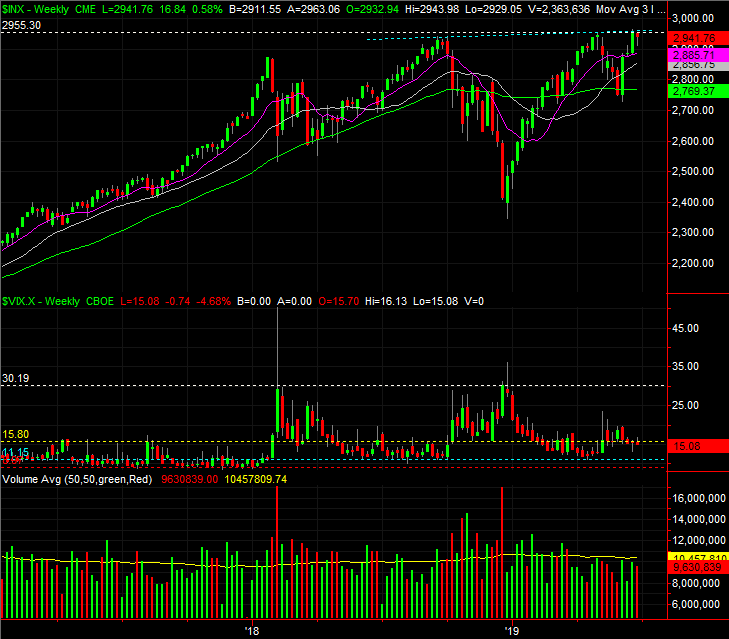
It takes a look at the weekly chart to really put things in perspective. The past four weeks, even with last week's lull, have been unusually strong, sidestepping what was very close to turning into a four-alarm meltdown. The rebound has carried the S&P 500 back to an inflection point, but no higher.
S&P 500 Weekly Chart, with Volume
 [12]
[12]
Source: TradeStation
All that being said, the key here is (still) the VIX. It's back to the 15/16 area where it's been gravitating to and from for the past few weeks. There's room for more downside from the VIX, which leaves room for the market to make gains. But, there's not a lot of room… and the market is overbought as is.
Ironically, the market's advance for the past four weeks brings it dangerously close to a point where there's little to no room left to keep climbing. A little bullish straightaway could actually be the worst thing for stocks, in the grand scheme of things. That peak could and should happen around the time the VIX tumbles back to the bigger support area around 11.
Conversely, if stocks somehow tip over here – if there's no trade deal reached anytime soon – there's lots of room and reason to expect a pullback. The 200-day moving average line around 2770 would be the first checkpoint floor, and the VIX's ceiling around 30 would be its first checkpoint target.
That's a lot of 'ifs' though. Problem is, there's very little uncertainty helping shape the foreseeable future.
Still, you have to like the fact that the momentum is bullish.