
Stocks may have logged a gain last week, quelling the downtrend that got going again two weeks ago, and perhaps rekindling a rebound effort that took shape three weeks ago. The major indices even knocked over a couple of technical resistance lines that had been holding them back.
They were stopped just short of a couple other technical ceilings though, and that may be just enough to put the bigger-picture pullback back into motion.
We'll look at these lines below in crystal clear detail. First though, let's look at last week's economic news and preview what's coming this week. A bunch of it has the potential to move the market if it hasn't already.
Economic Data Analysis
It wasn't the only economic data released last week, but it was certainly the most important.
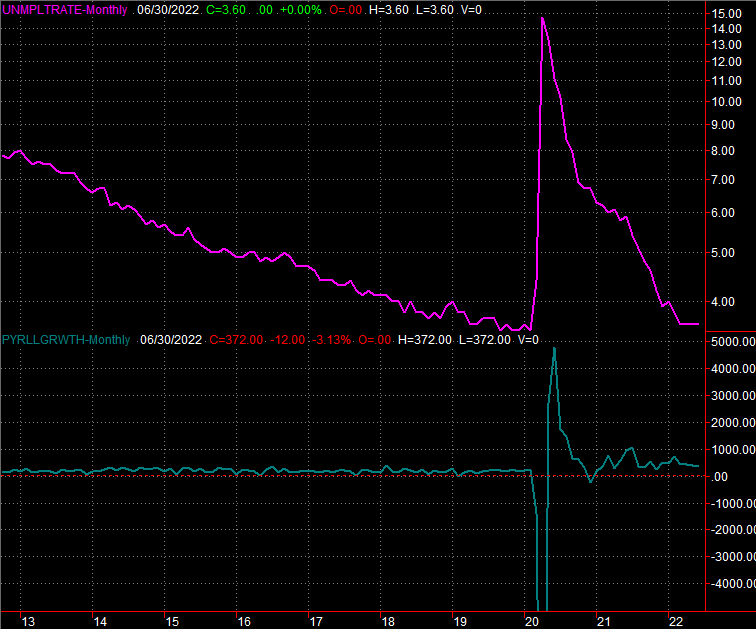
We're talking about June's jobs report, of course. The numbers were (mostly) better than expected. While the unemployment rate wasn't ratcheted lower, the 372,000 new payrolls added last month topped expectations for only 250,000, marking the third straight month that job growth came in around there. And, the unemployment rate of 3.6% is still plenty strong.
Unemployment Rate and Payroll Growth Charts
 [1]
[1]
Source: Bureau of Labor Statistics, TradeStation
This of course presents something of a problem. That is, given that at least the jobs part of the economy is on a firm enough footing for now, the Federal Reserve can proceed with its suggested plans to continue raising rates. Its next scheduled opportunity to do so is later this month.
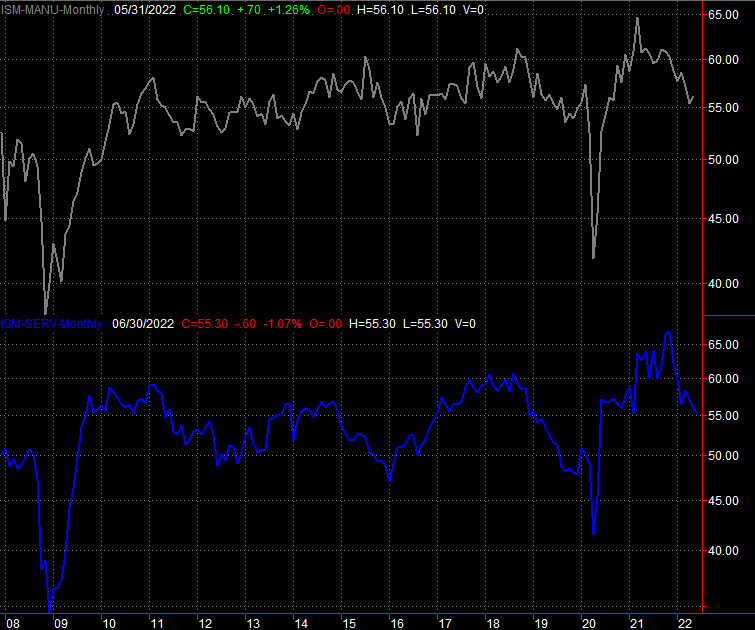
The only other item of real interest from last week was the Institute of Supply Management's look at the non-manufacturing (services) segment of our economy. It too was a pleasant surprise. Though down a bit from May's reading of 55.9, the ISM Services Index score of 55.3 was markedly better than expectations of 54.2. More than that though, that's still well above the critical 50 level that separates growth from contraction.
Institute of Supply Management Manufacturing and Service Index Charts
 [2]
[2]
Source: Institute of Supply Management, TradeStation
Everything else is on the grid.
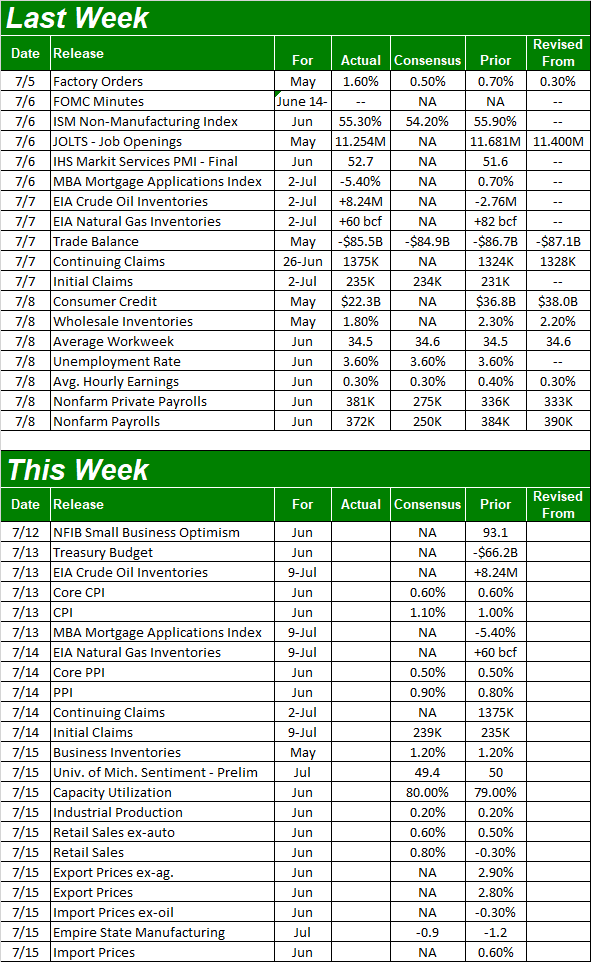
Economic Calendar
 [3]
[3]
Source: Briefing.com
This week's going to be a pretty busy one too, with several "buckle up" reports scheduled.
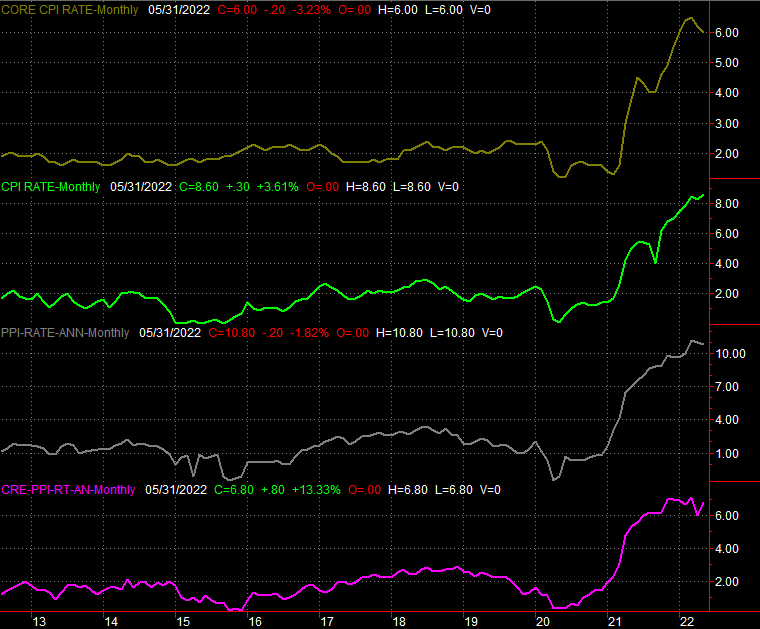
The party starts in earnest on Wednesday with a look at last month's consumer inflation rates, to be followed on Thursday with a look at June's producer inflation. Both have been sky-high of late with or without gas and food prices, and economists don't expect to see any relief this time around either.
Consumer and Producer Inflation (Rate) Charts
 [4]
[4]
Source: Bureau of Labor Statistics, TradeStation
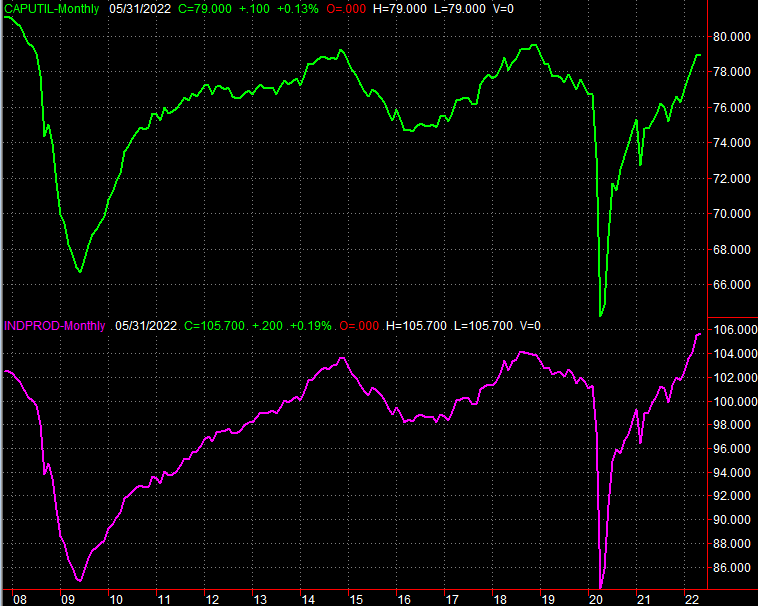
On Friday look out for last month's capacity utilization and industrial productivity figures from the Federal Reserve. Look for more of the same tepid forward progress, though bear in mind that progress is relatively tepid only because things were so strong by the latter part of last year and early this year.
Capacity Utilization and Industrial Productivity Charts
 [5]
[5]
Source: Federal Reserve, TradeStation
Perhaps the biggest report due this week, however, is Friday's look at June's retail sales. Spending hit a wall a couple months back mostly due to inflation. Economists are calling for somewhat renewed growth, though that's hardly an ironclad prediction.
Retail Sales Charts
 [6]
[6]
Source: Census Bureau, TradeStation
Stock Market Index Analysis
We kick this week's analysis off with a look at the weekly chart of the NASDAQ Composite, since that's where the biggest development from last week is most evident. That's the index's break above the falling resistance line (orange) that had been steering it lower since April.
NASDAQ Composite Weekly Chart, with VXN
 [7]
[7]
Source: TradeNavigator
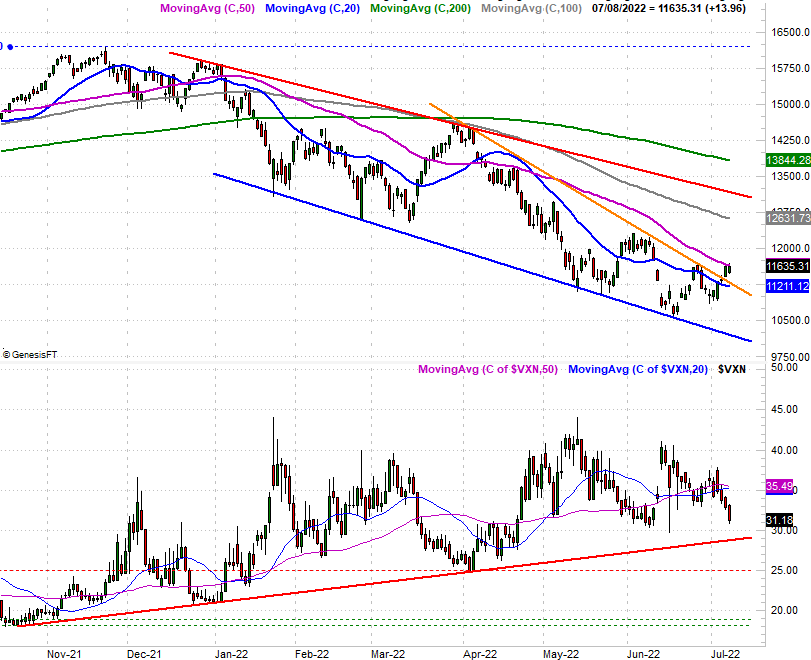
Unfortunately for the bulls, that's the only real "win" the NASDAQ Composite mustered last week… and it may not be enough. As the daily chart of the index below shows us, the rally effort was stopped cold at the 50-day moving average line (purple), and the volatility index – the VXN – didn't break under the rising technical support line that's been carrying it upward since October of last year. The daily chart also reminds us there's a whole zone of potential resistance ahead, between 11,650 and the 200-day moving average line (green) currently at 13,844. Any and all of those could up-end any further upside.
NASDAQ Composite Daily Chart, with VXN
 [8]
[8]
Source: TradeNavigator
Although not the same ones, the S&P 500 cleared some hurdles of its own last week. It failed to clear more than it moved past though.
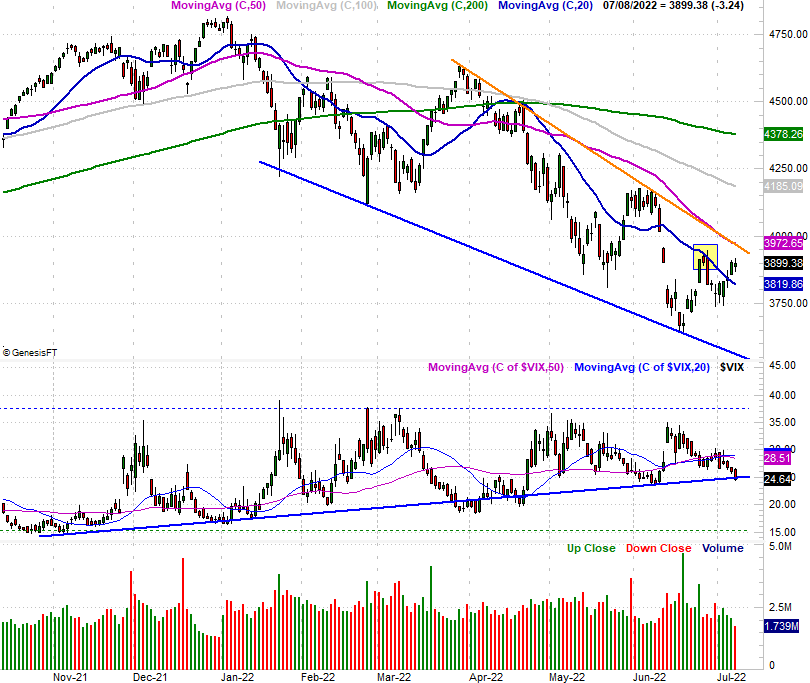
The big victory here is last week's move above the 20-day moving average line (blue) that halted the rally from three weeks earlier. The S&P 500 did not, however, clear the falling resistance line (orange) at 3965 that's been serving as a ceiling since late March; that line is now working in conjunction with the 50-day moving average line (purple). And, while it made a valiant effort, the S&P 500's volatility index — the VIX — wasn't able to fall below its rising support line (blue) that coincides with the S&P 500's falling technical ceiling. Both need to be breached before the market can really start to freely move higher.
S&P 500 Daily Chart, with VIX and Volume
 [9]
[9]
Source: TradeNavigator
Perhaps the most discouraging aspect of last week's gain, however, was the lack of volume behind the effort. Traders aren't filing back in as stocks climb. If anything they're dropping out of the effort, suggesting they don't believe it's built to last.
And that's even more true for the NASDAQ's listings than other exchanges or less growth/tech/aggressive indexes like the Dow or the S&P 500. When we break out the NASDAQ's daily bullish volume and daily bearish volume trends, we can see its bearish volume has been growing even with the market's recent rise, while its bullish volume has remained mostly below average, and below the exchange's recent bearish activity.
NASDAQ Composite Daily Chart, with Bullish Volume and Bearish Volume
 [10]
[10]
Source: TradeNavigator
It's an important detail simply because the NASDAQ tends to lead the market higher or lower. If its rally effort isn't built on a firm footing, it simply may not last. So, the market still remains in a "prove it to me first" state.
There is one prospective development, however, that could dramatically bolster the bullish argument. That's a move from the NASDAQ above last week's high of 11,690, which essentially aligns with the high of 11,677 from three weeks ago. That may be what's holding would-be buyers back, even if they don't realize it.
Either way though, the bulls have a lot to prove here if they want to put a rebound in motion. That's the lower-odds outcome at this time.