The market managed to hit new record highs last week. But, they weren't really able to hold onto those gains. Stocks pretty much ended the week where they started it, and traders have no clearer idea as to what's on the horizon.
 [1]The good news is, the lines in the sand we need to which remain rather clear (particularly the ones that could trigger a pullback). The bad news is, in that we're heading into a lethargic time of your in an overbought condition, the bulls are going to have an increasingly tough time tacking on more gains.
But hey… so far, Q2's earnings season seems to be justifying the year-to-date strength.
We'll look at the market from both angles below, as always, after painting the picture's broad brush strokes with last week's and this week's economic reports.
Economic Data
Last week was a rather busy one in terms of economic news, but it was a huge week for real estate. We got updates on both key real estate pricing measures — the Case Shiller index and the FHFA home price index — as well as a look at June's new-home and existing-home sales. Though they're all still moving forward, broadly speaking the previous measures weren't quite as good as expected.
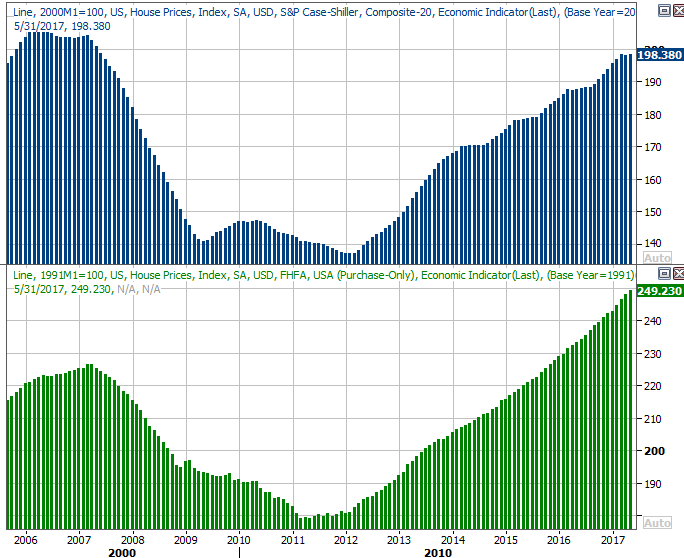
The specifics on the pricing front: The FHFA Housing Price Index for May was up 0.4% (month-to-month), down from April's growth of 0.6%, and missing expectations of 0.7% growth. The Case-Shiller Index grew was up 5.7% (year-over-year) in May, matching April's improvement, and matching expectations.
FHFA and Case-Shiller Home Price Charts
 [2]
[2]
Source: Thomson Reuters Eikon
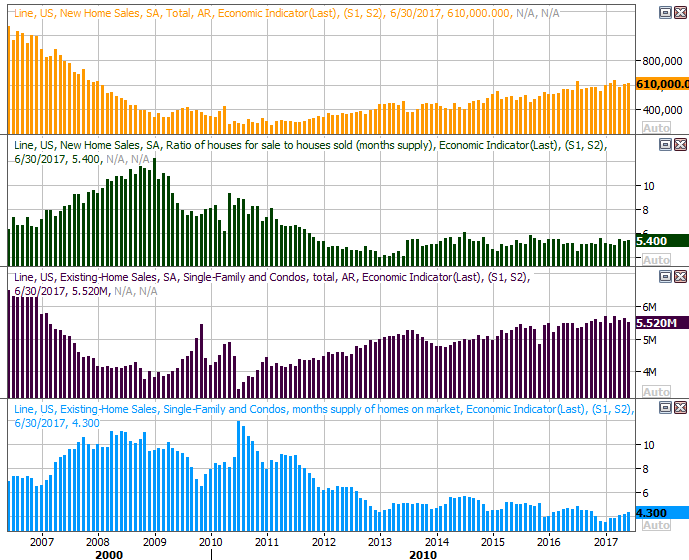
As for home sales, existing home sales grew at an annual pace of 5.52 million, down from May's rate of 5.62 million, while new homes sold at an annualized rate of 610,000 units. Analysts were modeling a pace of 610,000.
Home Sales (New & Existing) and Inventory Charts
 [3]
[3]
Source: Thomson Reuters Eikon
A slight slowdown this time of year isn't terrifying or terribly unusual, so don't sweat the lull. If we see the same decline for two or three more months, then you can get concerned.
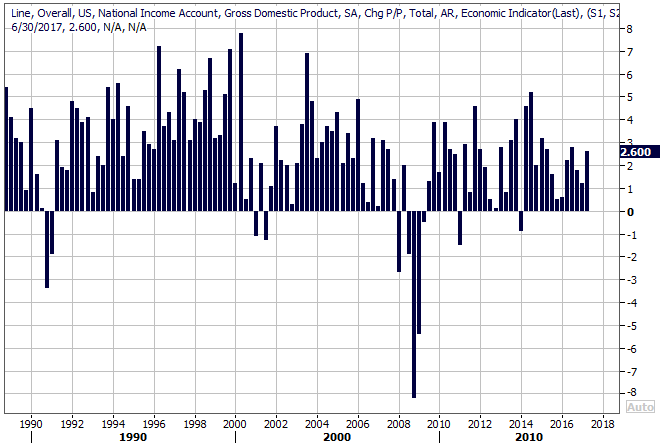
We also got the first (of three) looks at Q2's GDP growth — the economy expanded by 2.6% last quarter. Amazingly enough, as strong as that was, it fell a little short of expectations.
GDP Growth Charts
 [4]
[4]
Source: Thomson Reuters Eikon
The next two updates will certainly change the original GDP guess for Q2, though it usually doesn't change a great deal. Almost needless to say, that's the kind of reading that can support earnings growth.
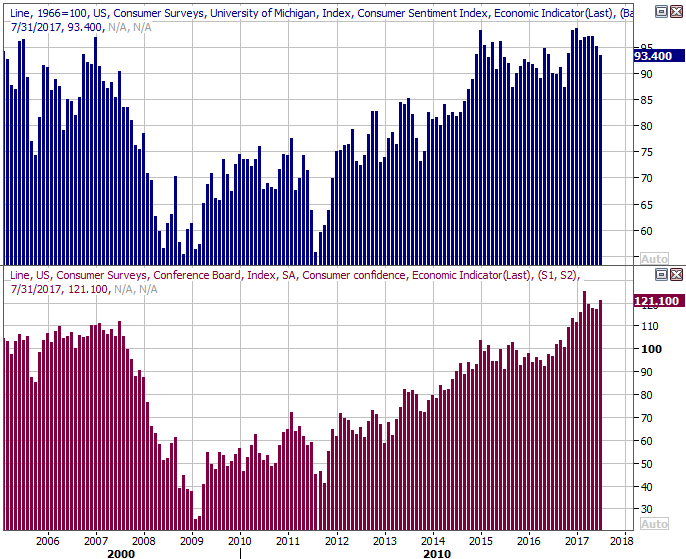
We also got a huge look at how consumers are feeling…. and they're feeling great. Despite ongoing turbulence in Washington D.C. , the Conference Board's consumer confidence measure jumped from 117.3 to 121.1 last month (exceeding expectations), and the third and final look at the Michigan Sentiment Index rolled in at 93.4, The Michigan Sentiment Index for July was lower than June's reading, but the broad trends from both measures remains pointed upward.
Consumer Sentiment Charts
 [5]
[5]
Source: Thomson Reuters Eikon
Finally, the most interesting and meaningful news from last week was the Federal Reserve's decision to not change the Fed Funds rate. Though the decision didn't come as a surprise, it did confirm that t he FOMC is satisfied with how well inflation has been tamed. The market isn't betting on a rate hike until March, and Janet Yellen didn't say anything to suggest she disagreed with that timeline.
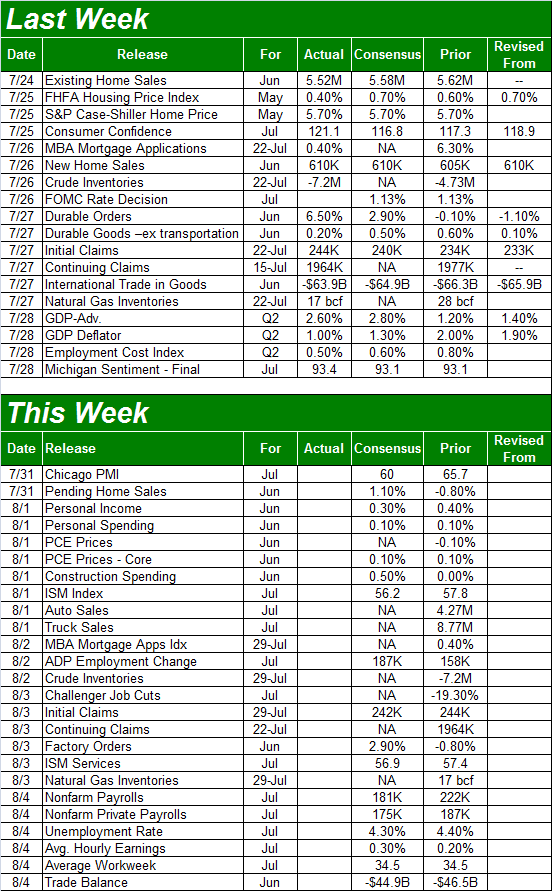
Everything else is on the grid.
Economic Calendar
 [6]
[6]
Source: Briefing.com
As busy as last week was, this week is going to be even busier; we'll have to limit ourselves to the highlights… the items most likely to move the market.
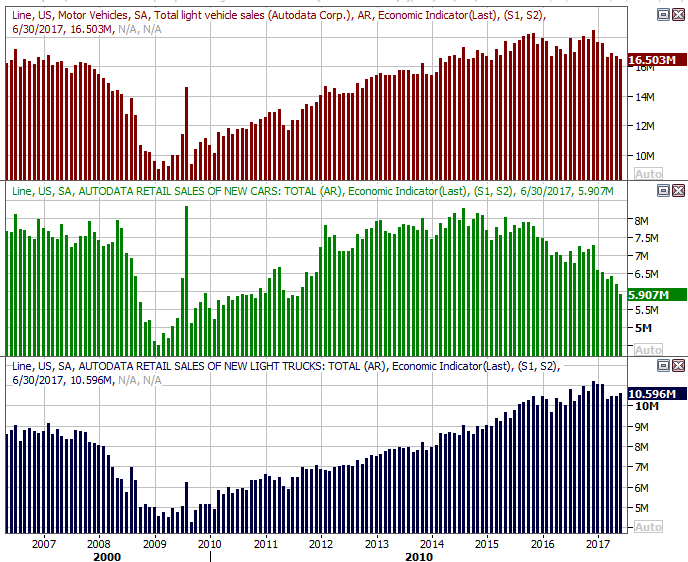
The party starts in earnest on Tuesday, with June's auto sales. They've been deteriorating for over a year now, and the pros are looking for the losing streak to continue. As of the latest look, analysts are looking for a 5% decline (year over year) in car sales for July.
Auto Sales (Monthly) Charts
 [7]
[7]
Source: Thomson Reuters Eikon
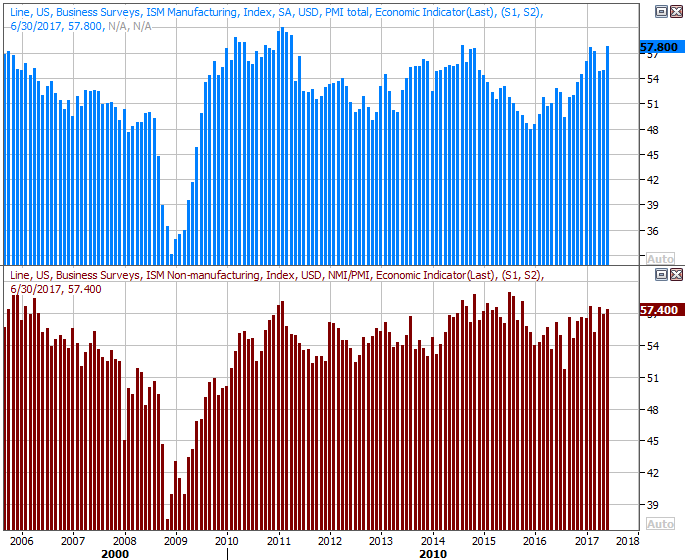
We're also going to hear about both ISM indices for July this week…. services and manufacturing. Both have perked up of late, but economists are looking for slight contractions on both fronts this time around.
ISM (Services and Manufacturing) Index Charts
 [8]
[8]
Source: Thomson Reuters Eikon
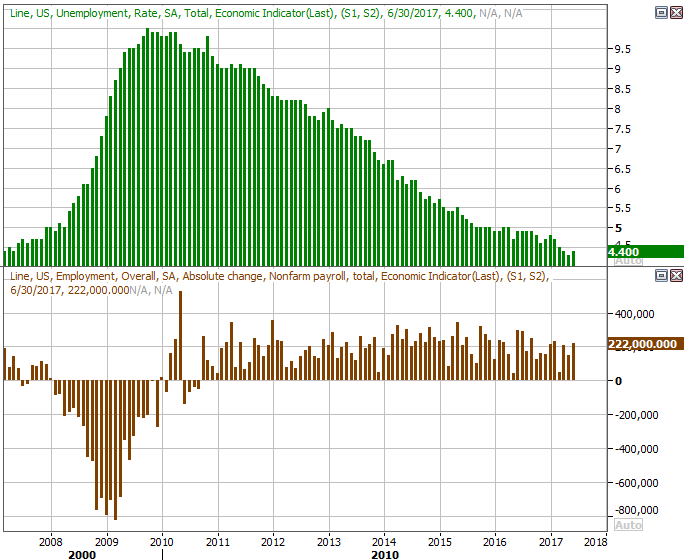
The big Kahuna, of course, will be Friday's unemployment report for July. Amazingly enough, though already at a very low 4.4%, economists expect the unemployment rate to slide to 4.3% on the heels of 181,000 new payrolls. That's good, especially in light of the fact that most people who want a job do indeed have one. The real measure of job progress from here will be indicated by the number of hours worked and their hourly pay… two data sets that aren't very well touted.
Unemployment Rates and Job-Growth Charts
 [9]
[9]
Source: Thomson Reuters Eikon
We'll be exploring that data in detail at the website on Friday.
Index Analysis
It's not that the bears are unwilling to take a swing at the market. It's that the bulls aren't willing to stay knocked down… at least not yet. Even with a string of disappointing earnings results on Thursday and Friday, the buyers took a small bite out of Friday's big loss by the time the closing bell rang. And, the fact that the VIX remains rather well contained says traders remain mostly unafraid of a meaningful pullback.
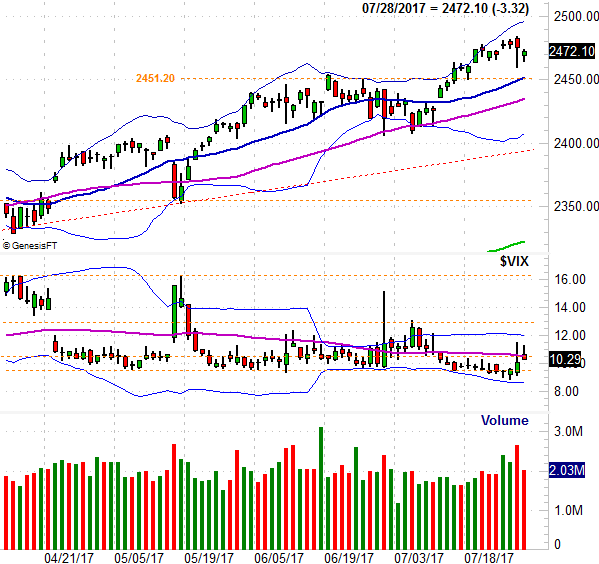
Take a look at the daily chart of the S&P 500. The index remains above the prior peak/ceiling at 2451, reaching a record high on Thursday before some profit-taking set in. In the meantime the 20-day moving average line (blue) has moved to that level and stands ready to play a support role.
S&P 500 Daily Chart
 [10]
[10]
Source: TradeNavigator
It's also clear on the daily chart of the S&P 500 that the VIX faces a myriad of ways to be held down.
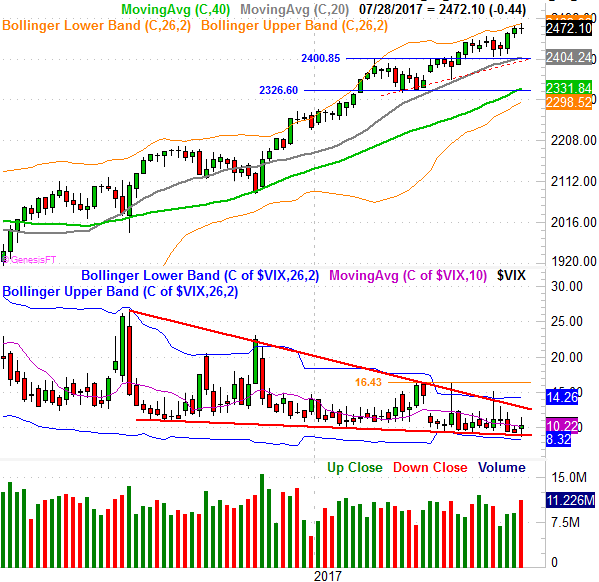
Taking a step back and looking at the weekly chart of the S&P 500 provides a little more perspective, though doesn't actually tell us anything new. It's on this chart we can see the VIX is being driven lower by a falling converging wedge pattern, and that the stock market's momentum is impressive.
S&P 500 Weekly Chart
 [11]
[11]
Source: TradeNavigator
The importance of the 2400 level becomes clear here as well, assuming the floor at 2451 ends up being broken. Not only was 2401 previously a key floor and a key ceiling, it's also where the 100-day moving average line currently is, and where a rising support line (red, dashed) presently rests. The bulls don't really need to sweat until the S&P 500 breaks under that mark. The VIX will/should be above at least some of its key resistance levels at the same time.
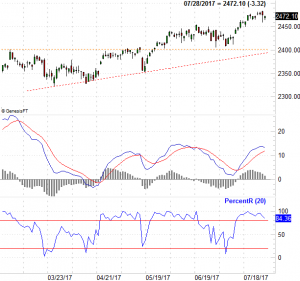
That being said, the red flags you really need to watch for lie in the S&P 500's MACD and PercentR indicators on daily chart of the S&P 500. If and when the PercentR line falls below — and stays under — the 20 threshold and the MACD lines fall below zero, that's going to be the best sign that a lull is turning into a full-blown pullback. As you can see, we're quite a distance away from that.
S&P 500 Daily Chart, with MACD and PercentR Lines
 [12]
[12]
Source: TradeNavigator
Clearly there's room for a small pullback, but that pullback won't necessarily break the bigger uptrend. Indeed, there's no particular reason to assume the weakness we saw at the end of last week is going anywhere. As the TrendScore above indicated, stocks remain in a hot uptrend despite last week's pre-weekend lull.
The one thing to fear more than weakness? A blowoff top. We'll talk more about that if and when the time comes.