The week didn't end on a particularly glorious note, but it ended with yet another step forward. It's sure better than a step back. And either way, for the full week the market made progress, rekindling the rally that stalled a week prior. The S&P 500 is now up 15% from its December low, logging its best close since early that month.
Maybe the future isn't so bleak after all.
Yes, the rally paused, but that's as (and where) it should be. On Friday, the S&P 500 finally bumped into a major resistance line and then slowed down. But, it didn't peel back. It still might, but even if it does, it's still not in trouble. Hurdles remain ahead, but the bulls have the wind at their backs. We'll show you why – and how – after a rundown of last week's economic news and a preview of this week's announcements.
Economic Data Analysis
A pretty busy week, actually, though not a whole lot of it was hard-hitting stuff. The couple of items that were heavy-duty, though, were VERY heavy-duty.
We're talking about January's jobs report, of course, and Wednesday's word from the Federal Reserve, As expected, the FOMC elected to stand pat with interest rates, and back the decision up with some mostly-dovish commentary.
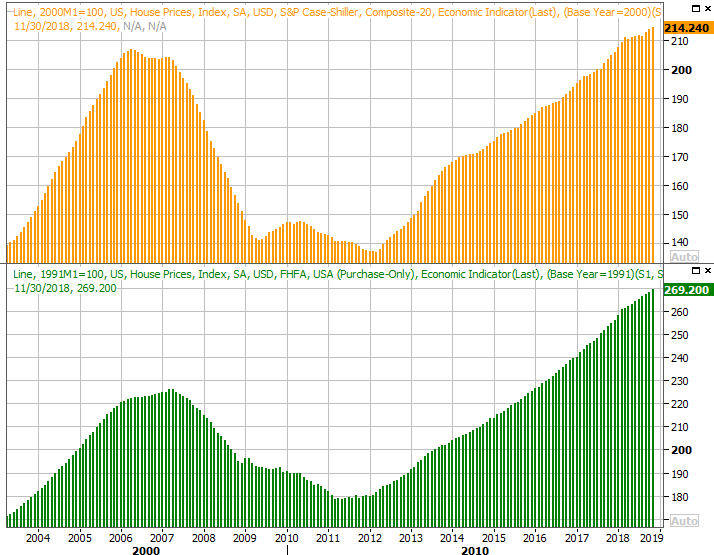
But, first things first. The week started with a look at the nation's real estate landscape via the S&P Case-Shiller Home Price Index update. In November, home values grew another 4.7%. The pace of progress is slowing down, though home prices continue to improve.
Home Price Charts
 [1]
[1]
Source: Thomson Reuters
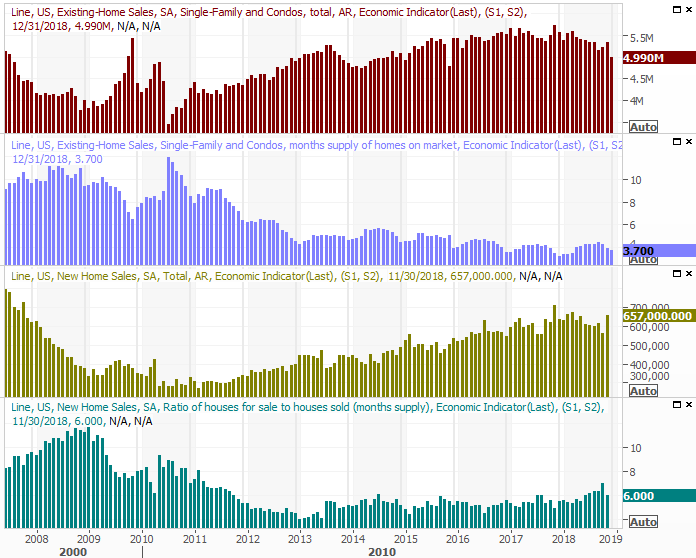
Note the FHFA data confirms home prices remain firm, even if they're not selling at the brisk rate they were just a few months back. In fact, last week's post of November's new-home sales confirms it. We finally heard the figure… 657,000 units. It's not a surge we can expect to last though. We saw a similar surge in existing home sales in November, only to watch them slide to multi-year lows in December.
New, Existing Home Sales and Inventory Charts
 [2]
[2]
Source: Thomson Reuters
Note that December's new-home sales report could be posted at any time now that the government is up and running again.
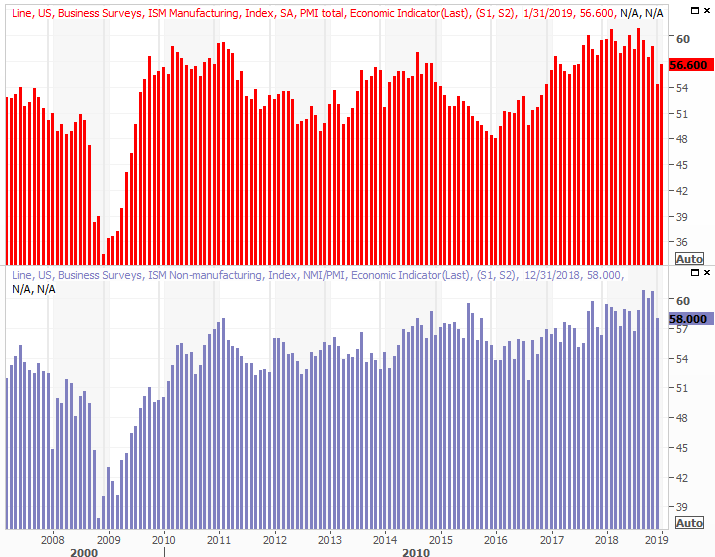
On Friday we heard the ISM Manufacturing Index update for January. Incredibly, it was up from December despite plenty of reason not to be. We'll get the services side of the ISM date this week. Economists are calling for a modest dip. Either way, both figures remain above the critical 50 level.
ISM Index Charts
 [3]
[3]
Source: Thomson Reuters
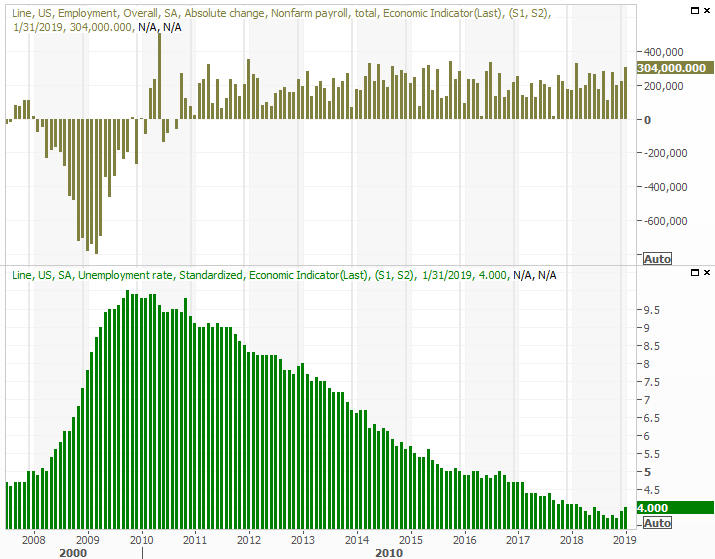
Finally, Friday's jobs report was everything it was expected to be, in a good way. Though we took some steps back by certain measures, on the important fronts we took big leaps forward. Most importantly, we saw big-time net payroll growth of 304,000 and clear upticks on the labor force participation rate and the employment/population ratio.
Payroll Growth and Unemployment Rate Charts
 [4]
[4]
Source: Thomson Reuters
We took a detailed look at the labor force participation rate and the employment/population ratio at the website, along with other less-touted aspects of the monthly jobs report. You can see it here: https://www.bigtrends.com/stocks/january-jobs-report-was-far-more-impressive-than-it-should-have-been/
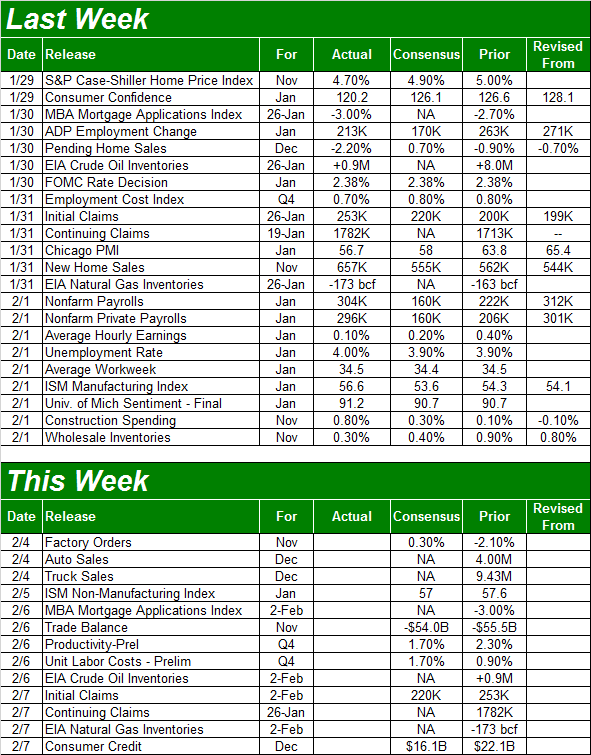
Everything else is on the grid.
Economic Calendar
 [5]
[5]
Source: Briefing.com
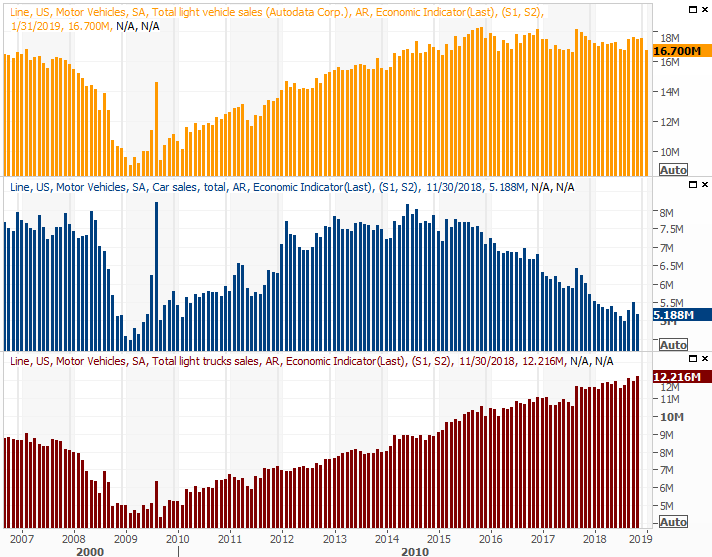
This week won't be quite as exciting, but there are a couple of items of interest. The first one will be Monday's auto sales figures. Passenger car sales continue to dwindle, though that's being offset by pickup truck sales. Overall though, the industry's sales have already leveled off, and appear to be toying with a decline.
Auto Sales Charts
 [6]
[6]
Source: Thomson Reuters
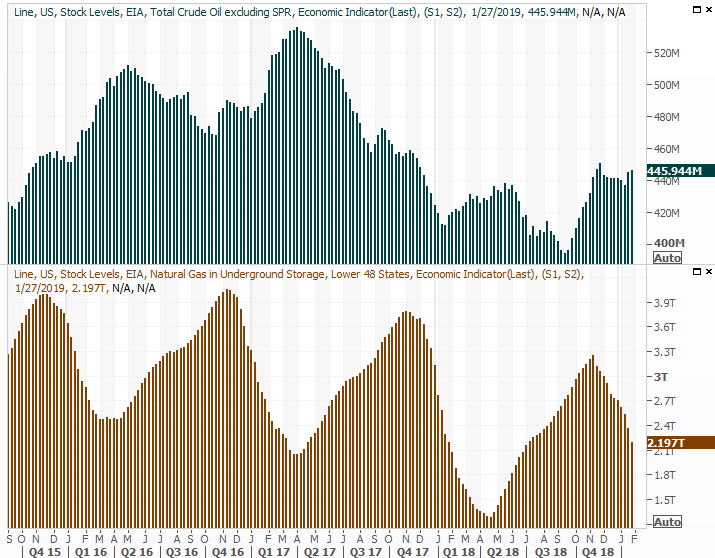
Finally, given the reprisal of geopolitical tensions that can impact the global oil supply, the nation's stockpile trend is again of interest. A week ago, natural gas inventories fell, though that's only due to normal winter-time consumption. Oil, meanwhile, perked up three weeks ago – reversing a modest downtrend – and held its ground two weeks ago. The inventory reports weren't mattering as much, but they're going to again now.
Crude Oil, Natural Gas Inventory Charts
 [7]
[7]
Source: Thomson Reuters
Last week's inventory levels will be posted on Wednesday.
Stock Market Index Analysis
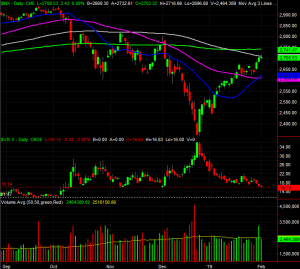
The rally took a break right where it was supposed to be, for a couple of different reasons.
One of them is the encounter with the 100-day moving average line, plotted in gray on the daily chart of the S&P 500 below. The advance slowed there on Thursday, and that line was verified as a technical ceiling on Friday. None of this is surprising, though none of it is a red flag for a reversal either.
S&P 500 Daily Chart, with Volume
 [8]
[8]
Source: TradeStation
The other reason? Notice where the VIX has paused its downtrend that began in late December. Friday's low was right around 16.0, in line with the lows made between mid-October on. There's something about that line, and though the VIX's interaction with prior lows and highs isn't as telling as the way stock indices uses prior peaks and bottoms again, it's not something to be ignored.
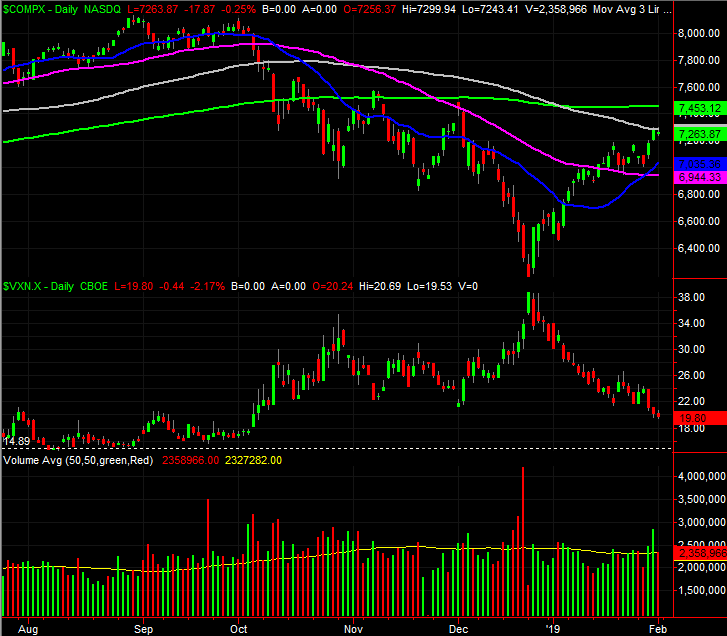
Curiously, the NASDAQ Composite is going through the exact same thing. It tested its 100-day moving average line late last week, but ultimately failed to break above it.
NASDAQ Composite Daily Chart, with Volume
 [9]
[9]
Source: TradeStation
It's not the end of the world. In fact, in many ways it's actually better for the bull market to hesitate again, like it did a week earlier.
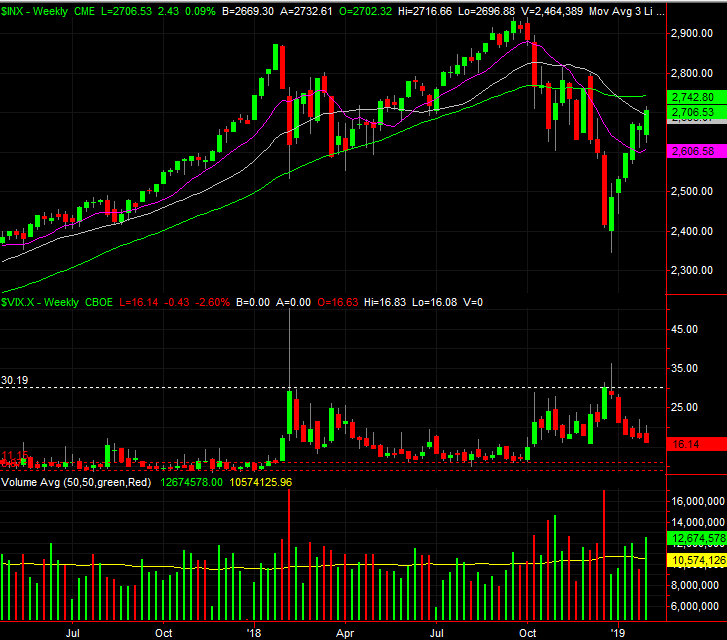
The reversal that got rolling six weeks ago has been impressive, but arguably overheated. In fact, it's one of the best six-week stretches the market has ever seen. It's mostly deserved too, if only because the December meltdown wasn't merited… it was rooted in unjustified fear. Nevertheless, big gains invite big profit-taking. There's room for a little, but not a lot. The worry is, a little profit-taking could easily turn into a lot of profit-taking given traders' fragile nerves here. Better to let stocks pass a test now then let stocks race even higher and then not even get a fair chance at passing a test. The weekly chart of the S&P 500 puts things in perspective.
S&P 500 Weekly Chart, with Volume
 [10]
[10]
Source: TradeStation
The weekly chart also illustrates why we're probably not at a major top yet. Although the VIX is at a minor floor and may edge a little higher from here, it's not yet to a more absolute floor between 9 and 11. Until that happens, there's room for more upside. The put/call ratio (not shown) is telling the same basic story.
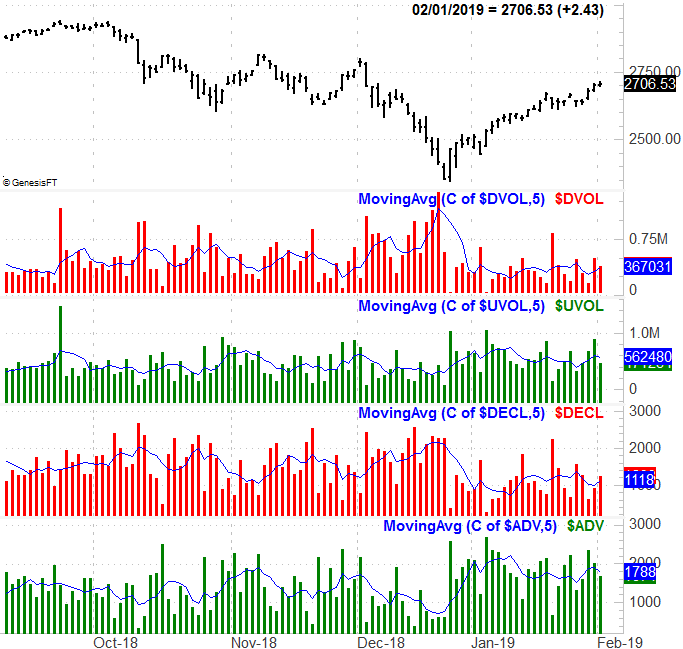
So too is a look at the market's breadth and depth, or advancers/decliners and up/down volume. There remain more rising stocks than falling ones, and there remain more buyers than sellers. This rally effort thus far has the foundation it needs.
S&P 500 Daily Chart with Breadth and Depth
 [11]
[11]
Source: TradeStation
Though healthy, there's room and reason for a slight pullback here. The S&P 500 could readily slide back to the 20-day or 50-day moving average lines (blue and purple, respectively), regroup and then renew the rally. Bolstering the odds of some weakness in the near future is the fact that February is generally a flat month, and the market is starting the month well ahead of where it would normally be at this point in the year. That's actually, however, the more palatable outcome here as it will validate the rally's underlying strength. The trick, of course, is making sure those short-term moving average lines actually act as support.
The next cross above the 100-day line could easily trigger another big bullish leg.