
 [1]Yikes. Last week's setback was the worst weekly loss for the market since March… a factoid made even more alarming by the fact that we only saw four trading days last week. One more day could have upped the ante on the "worst since" accolade.
And yet, it can't be ignored that last week's lull also followed an oddly strong finish to August; there was lots of profit-taking potential on the table. In fact, there was so much froth, even with the 1.0% tumble the S&P 500 took last week, it's still not worked its way into real technical trouble… not that September is the month in which the bulls want stave off a selloff.
We'll look at what the market did right and wrong last week below, as always. First, however, let's run down last week's and preview this week's economic announcements. With no major earnings announcements in store, investors will be grasping onto other data nuggets.
Economic Data
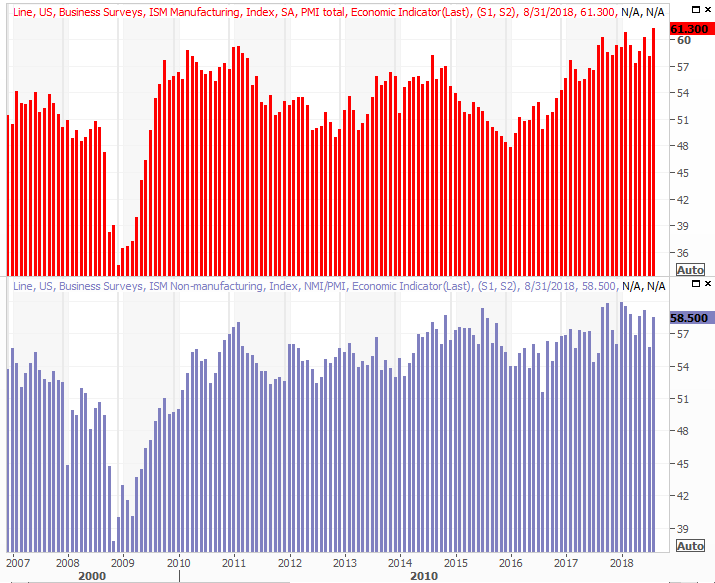
Last week was chock full of economic reports, with the biggest of them being the grand finale… Friday's jobs report for the month of August. There was plenty of other information worthy of recapping though, beginning the ISM data. Tuesday's ISM Manufacturing Index rolled in at 61.3, well above expectations and up to a multi-year record. Thursday's ISM Services Index report wasn't quite as impressive, though the print of 58.5 was still up, and better than forecasted.
ISM Index Charts
 [2]
[2]
Source: Thomson Reuters
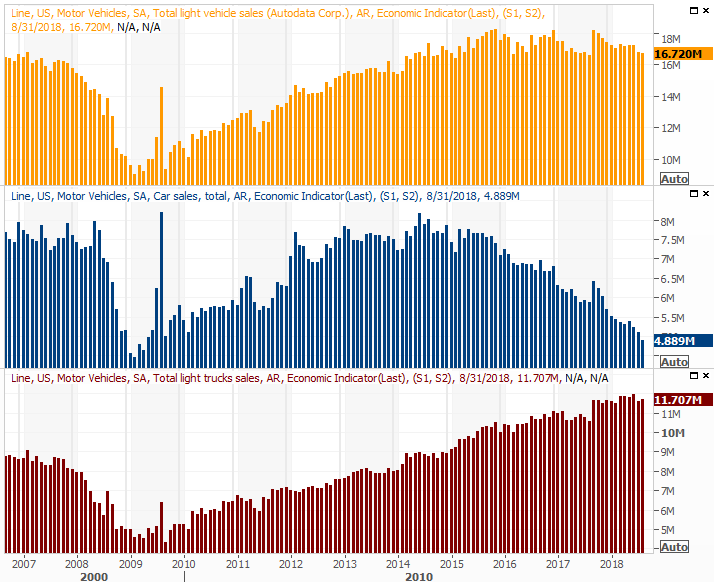
Also on Tuesday we heard about August's automobile sales… a mixed bag. Passenger vehicle sales fell (again), though truck sales grew. In total though, the annualized pace fell again, to 16.72 million. That's the second-lowest reading in a couple of years, and the broad downtrend is still in place. It's also not as if truck sales are blistering.
Automobile Sales Charts
 [3]
[3]
Source: Thomson Reuters
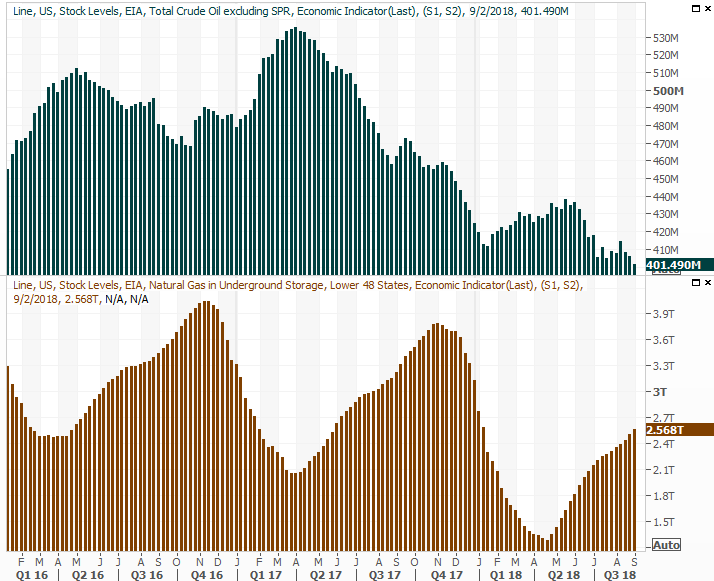
Friday's natural gas and crude oil stockpile data confirms the industry is practicing production restraint, which in turn is keeping prices firm. The 401.5 million barrels of stored oil is the lowest measure in years, and is still falling. Meanwhile, though natural gas in storage continues to rise as we build up for winter weather, it's still building at lower year-over-year levels.
Crude Oil, Natural Gas Stockpile Charts
 [4]
[4]
Source: Thomson Reuters
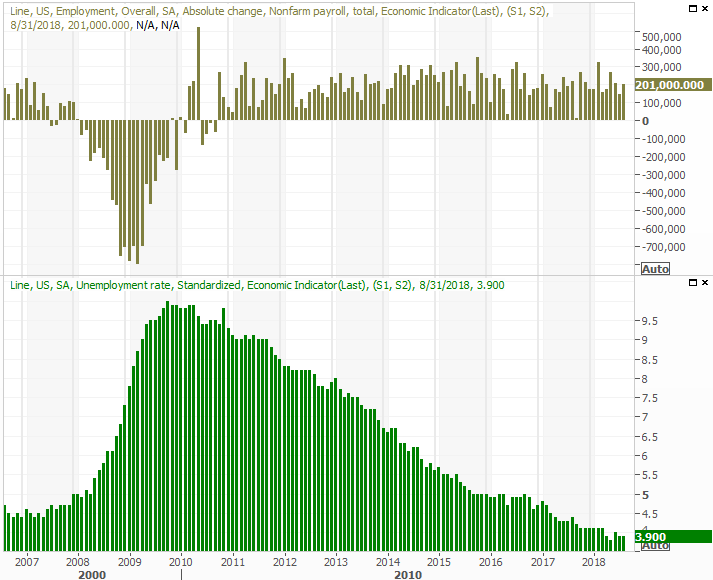
Finally, the employment picture remains a pretty one. Not a flawless one, as we explained in detail at the site. But, a pretty good one. The unemployment rate remains at an absolute low of 3.9%, and we managed to add 201,000 new payrolls versus expectations of only 187,000 jobs.
Unemployment Rate, Payroll Growth Charts
 [5]
[5]
Source: Thomson Reuters
Here's the deeper dive into the jobs report: https://www.bigtrends.com/stocks/august-jobs-report-was-good-but-not-flawless/
Everything else is on the grid.
Economic Calendar
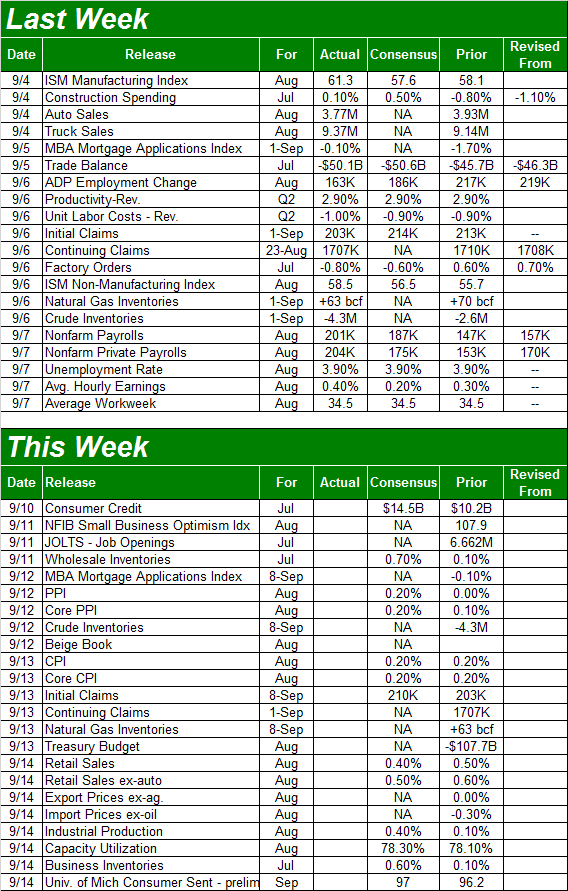 [6]
[6]
Source: Briefing.com
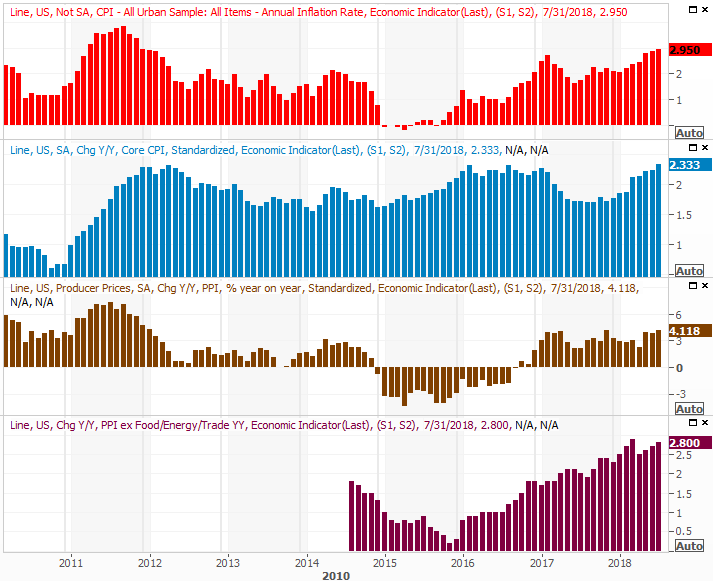
This week will be almost as busy, with the biggie being a snapshot of the economy's inflation story. Producer prices will be unveiled on Wednesday, and consumer inflation rates will be announced on Thursday. All of them are expected to rise, on a core and non-core basis, at the same pace we've seen of late. It's a prescription for the Federal Reserve to carry on as previously described with its rate-hike plan.
Inflation Rate Charts
 [7]
[7]
Source: Thomson Reuters
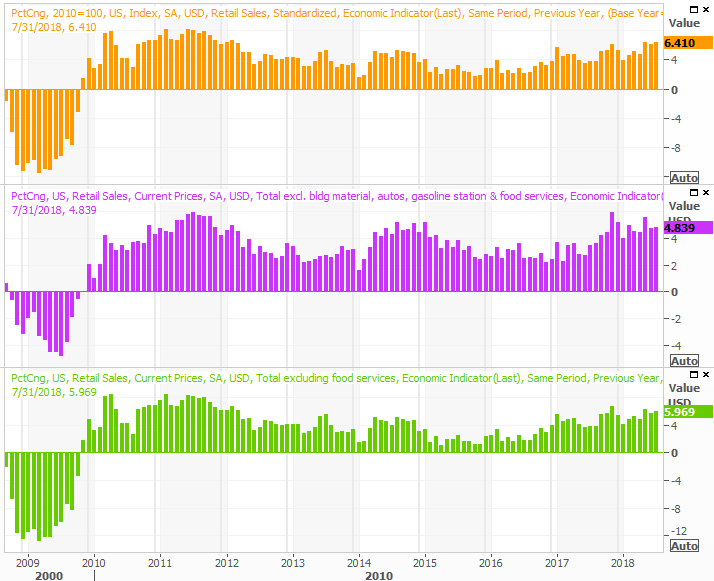
On Friday we'll get August's retail sales reports. Look for more of the same on that front too. Consumers are willing and able to shop, fanning broad economic growth.
Retail Sales Growth Charts
 [8]
[8]
Source: Thomson Reuters
Finally, also on Friday keep your eyes peeled for the Fed's industrial productivity and capacity utilization numbers. These are important data nuggets! Economists are looking for a little forward progress on both fronts, extending what's become long-standing uptrends.
Industrial Production and Capacity Utilization Charts
 [9]
[9]
Source: Thomson Reuters
The correlation between corporate earnings, the long-term direction of the market and this capacity-utilization and productivity data is very high, though it can't stave off short-term counterswings.
Index Analysis
Sure, last week was rough. As was noted above, it was the worst weekly performance since March. Put it in perspective though. Last week's 1.0% setback came after the prior week's 1.4% advance. And, it came after the market rallied more than 8% between June's low and August's high. In the grand scheme of things, a little profit-taking can't be a huge surprise. And, it certainly didn't do any serious damage to the broad uptrend.
On the other hand, all big trends start out as small ones.
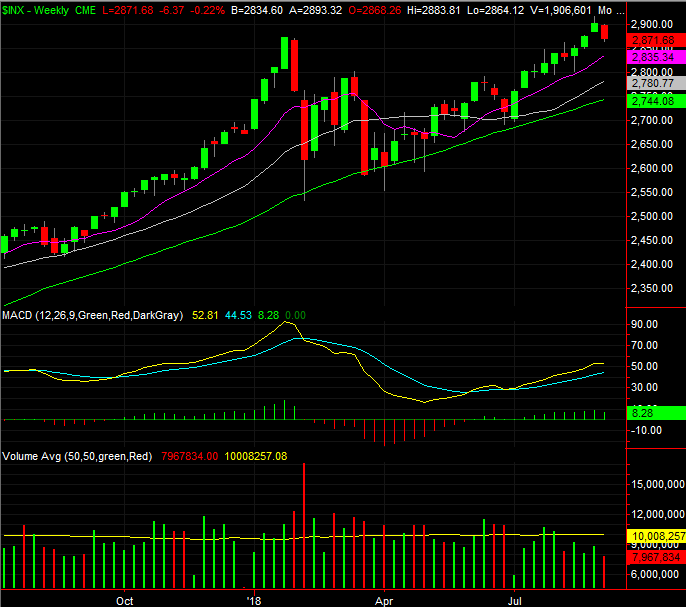
The weekly chart of the S&P 500 below says a lot with just a quick glance. There's room for the index to keep falling without breaking the bigger-picture rally.
S&P 500 Weekly Chart, with Volume
 [10]
[10]
Source: TradeSation
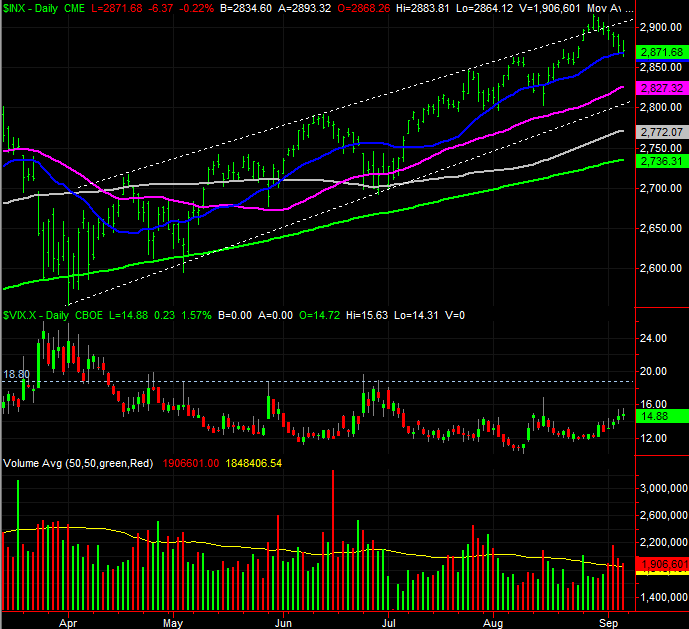
A look at the more detailed daily chart of the S&P 500 lets us make a mental plan. Notice that not even the 20-day moving average line (blue) was willing to let the S&P 500 break below it as a technical floor, even though there's room and reason to do so. The S&P 500 is still about 5% above the 200-day moving average line (green), which is an unusual degree of divergence.
S&P 500 Daily Chart, with VIX and Volume
 [11]
[11]
Source: TradeStation
Notice that the pullback seen over the course of the past few days has been on above-average volume, yet no part of the rally since July has been on lasting, above-average volume. It's a subtle sign that despite the persistent advance, there aren't a lot of believers in it. A bunch of people are ready and willing to bail out at a moment's notice.
From here, given last week's action, we have to give credence to the trend at hand and assume the market will continue to drift lower; the month of September is certainly the ideal time for the bears to make some noise.
At the same time though, we have to recognize just how many places the bleeding could stop.
We're mostly watching the VIX here, waiting to see if it will break above its recent ceiling at 18.8. If it does, that's a biggie. At the same time, until (and unless) the S&P 500 breaks below the 200-day moving average line at 2736.3, the overall uptrend is intact. Conversely, if the 200-day moving average line fails to hold up as a floor, we may finally get that much-needed, overdue correction.
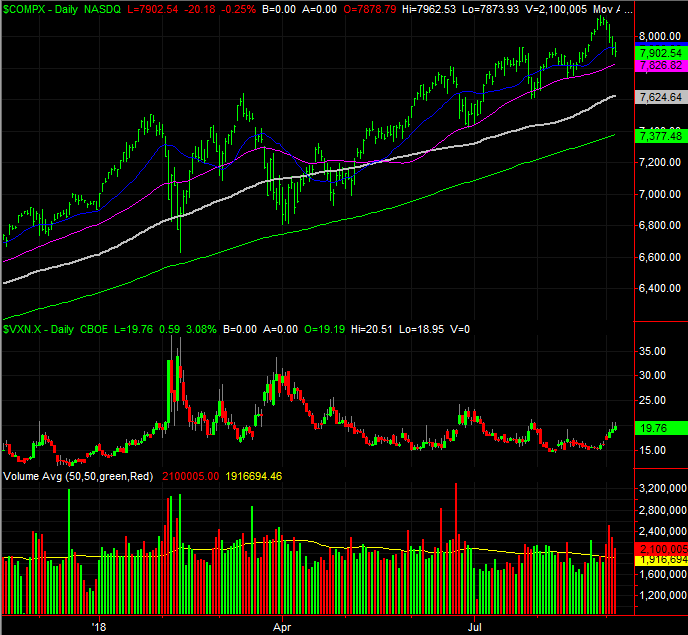
By the way, the same basic outlook applies to the NASDAQ Composite.
NASDAQ Composite Daily Chart, with VXN and Volume
 [12]
[12]
Source: TradeNavigator
Or, maybe the market will once again do the unlikely thing and shrug off this threat of a pullback and trek on to new record highs.
That's been the big challenge for the last several months. Headlines and sentiment have done more pushing and pulling than valuations and common sense have. It's a recipe for danger, but as the old saying goes, the market can remain irrational longer than you can remain solvent. In other words, don't fight the tape. If this isn't the beginning of at least a partial correction, we'll know soon enough. The S&P will push up and off the 20-day moving average line and press on to higher highs. That strength may well carry us into the usual year-end bullishness that generally begins in October.
This remains a market environment you simply can't turn your back on.