
Kaboom. Just like that, when many traders were "buying on the dip," the market reminded everyone why they can't afford to get cocky or presumptuous. Last week's 7.9% setback was the biggest weekly loss since 2009. Nobody was really ready for the sheer scope of it, though plenty of traders had a sneaking suspicion something like it was coming sooner than later.
 [1]The $64,000 question is, now what? Was that the bottom? Will a dead-cat bounce rekindle the rally we all came to know and love going all the way back to 2016, or is a dead-cat bounce just the calm before the next bearish storm?
We'll hash it out below, as always, after a run-down of last week's and this week's economic news.
Economic Data
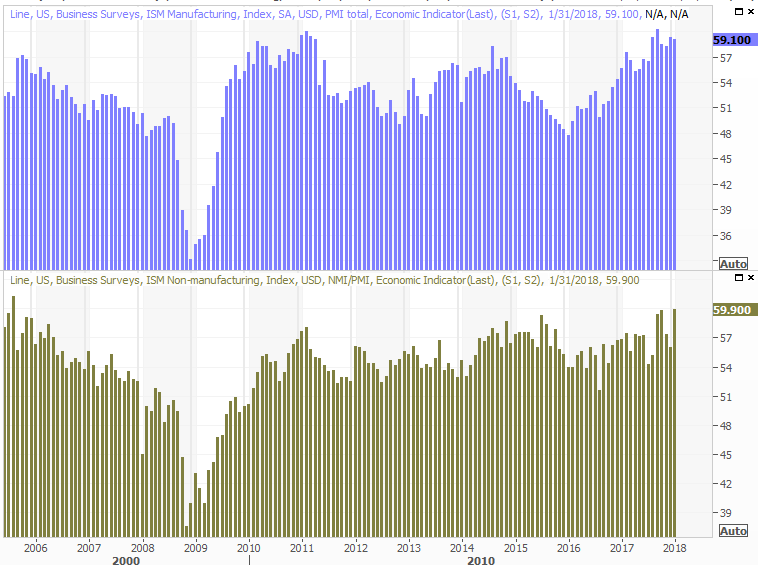
For better or worse – or maybe it wouldn't have mattered – we didn't get much in the way of economic news last week. There were a handful of items of moderate interest though. Chief among those was a look at January's ISM Services report, rounding out the prior week's look at the ISM Manufacturing Index. It was great, surging above expectations to a multi-year high of 59.9.
ISM Index (Service and Manufacturing) Charts
 [2]
[2]
Source: Thomson Reuters Eikon
Both measures are rock-solid, even if the market isn't.
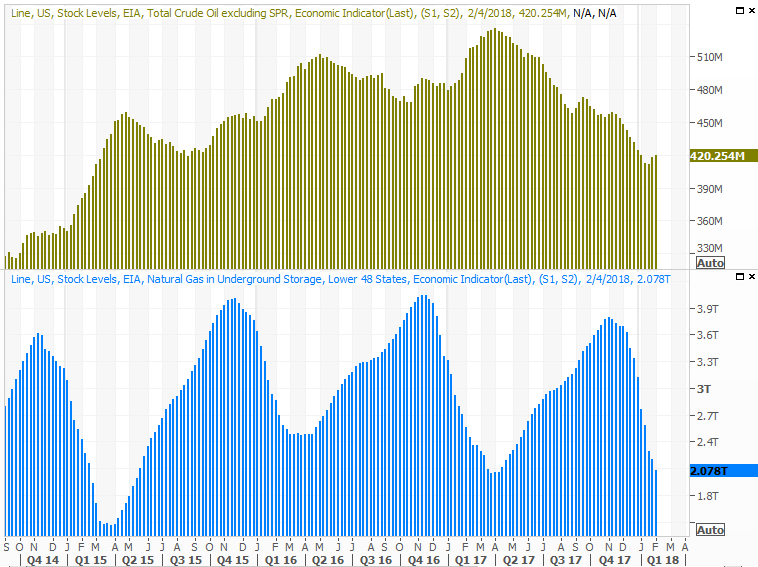
We also got another update on the nation's crude oil stockpiles. As we suspected a couple of weeks ago, it rose again, even if just slightly.
Crude Oil, Natural Gas Inventory Charts
 [3]
[3]
Source: Thomson Reuters Eikon
While this may not hint of surging inventories, it does point to stabilization. That stabilization (against a backdrop of the market's meltdown was just enough to tip already-wobbly oil prices low.
There's no need to chart it, but December's job openings (the JOLTS report) was a still a strong 5.81 million, down slightly from November but still rather high.
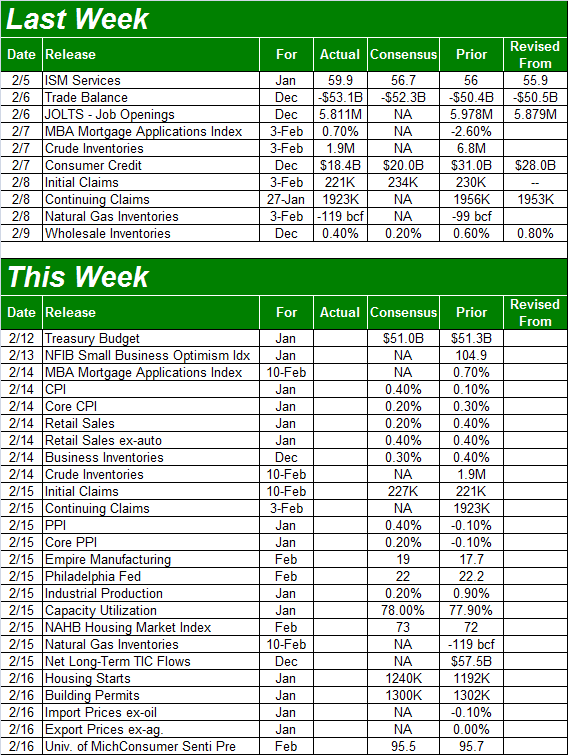
Everything else is on the grid.
Economic Calendar
 [4]
[4]
Source: Briefing.com
This week will be remarkably busier in terms of economic news, which could either exacerbate the selling or end it.
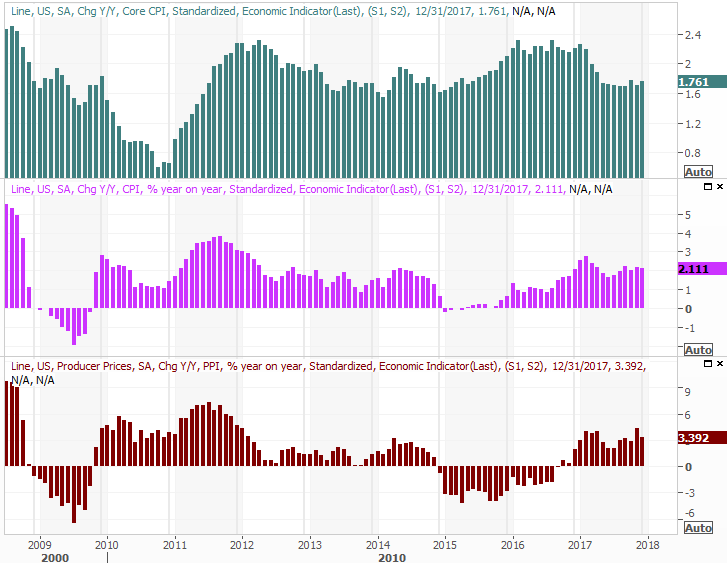
The party starts on Wednesday with last month's consumer inflation data, which will be followed up on Thursday with the producer inflation report. As the graphic below illustrates, inflation has been swelling, even if not soaring. Better for the Fed to nip it in the bud, if it's going to persist, than let it reach uncomfortable levels first.
Consumer and Inflation (Annualized) Charts
 [5]
[5]
Source: Thomson Reuters Eikon
That said, the Fed had a chance to raise interest rates a couple of weeks ago, but chose not to just yet.
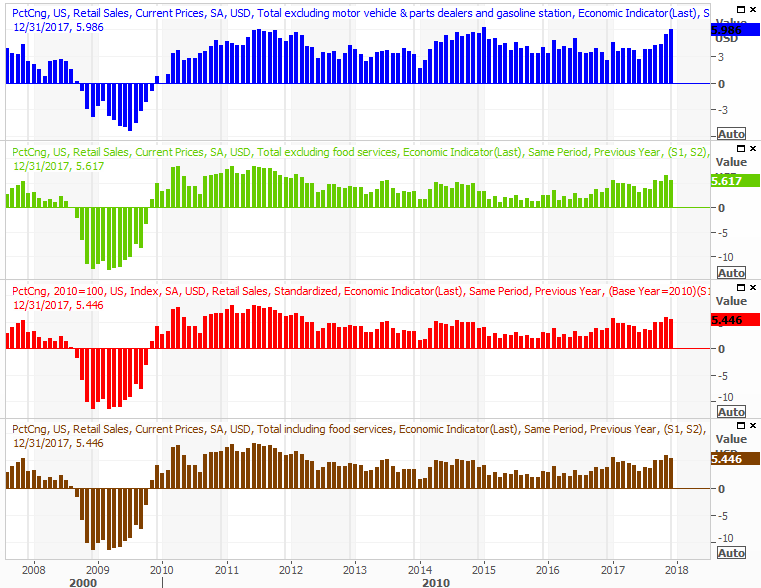
We'll also hear about last month's retail spending. It should be a pretty good number, as the market didn't unravel in earnest until February started.
Retail Sales Growth (Annualized) Charts
 [6]
[6]
Source: Thomson Reuters Eikon
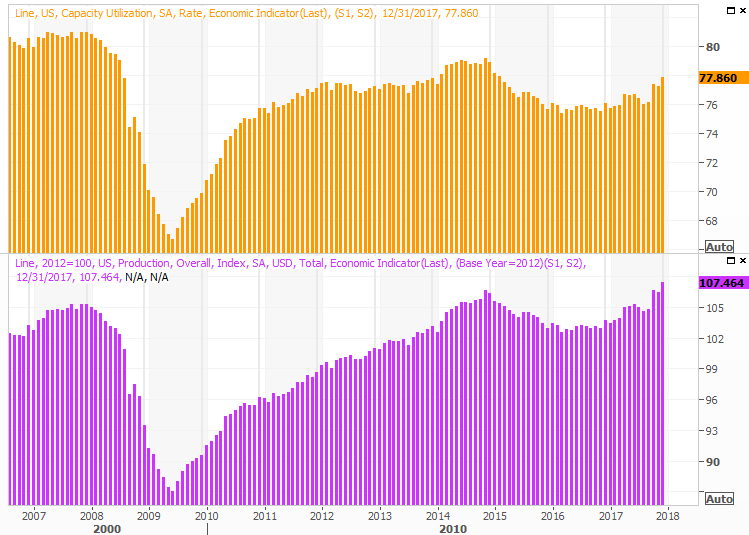
Be sure to keep your eyes and ears open on Thursday for last month's capacity utilization and industrial productivity reports as well. Like retail spending though, much has seemingly changed since the end of last month. Still, a slumping market doesn't inherently mean business activity is slowing down. Indeed, a strong report here on Thursday could convince investors that the market is going to be just fine.
Capacity Utilization and Industrial Productivity Charts
 [7]
[7]
Source: Thomson Reuters Eikon
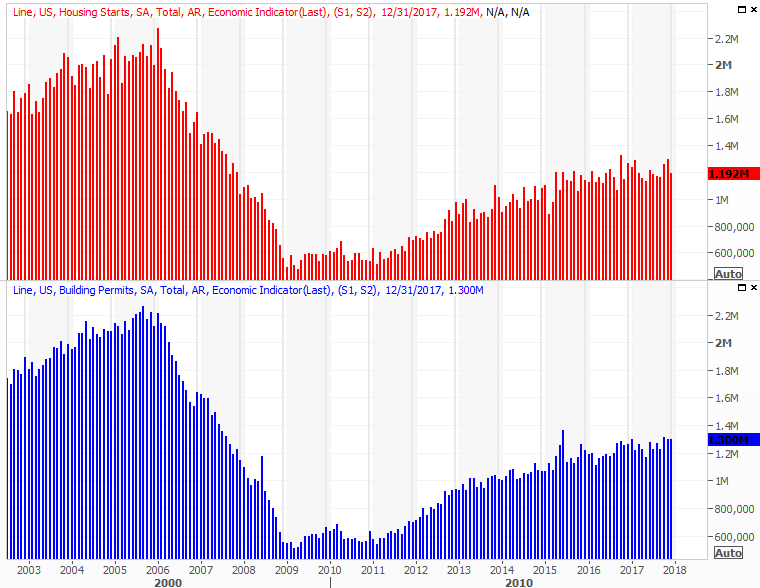
Finally, look for January's housing starts and building permits on Friday. Both have leveled off of late, which isn't the end of the world, but it certainly doesn't bolster the broad bullish argument (and especially not for the home construction market).
Housing Starts and Building Permits Charts
 [8]
[8]
Source: Thomson Reuters Eikon
Index Analysis
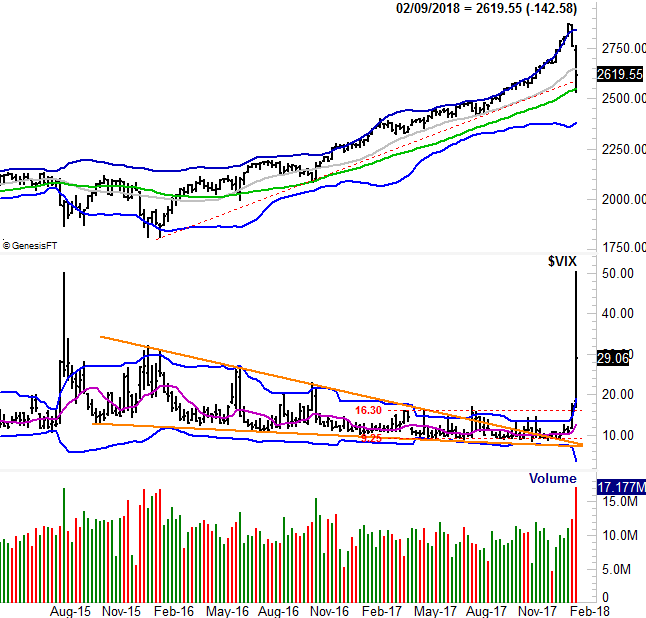
Once again, we have to start this week's analysis with a weekly chart of the S&P 500, just to offer some much-needed perspective on how far we came since early 2016, and how far we fell in just the past two weeks. Last week's pullback was the biggest one-week loss since 2009.
S&P 500 Weekly Chart, with VIX and Volume
 [9]
[9]
Source: TradeNavigator
(Almost) needless to say, many investors are freaking out. That's what happens when they're allowed to forget — or never knew — that corrections are just a part of bull markets. This one has unfurled faster than most, but as far as corrective moves go, the 12% lull from the recent high to last week's low was a fairly typical wave of profit-taking.
As far as "what's next?", that's anyone's guess. In a normal market environment we'd suggest this dip is a buying opportunity. We're not in a normal environment though. People are still spooked, for the first time in a long, long time. They may or may not dismiss this lull as they might in the past when the VIX has surged to 50.
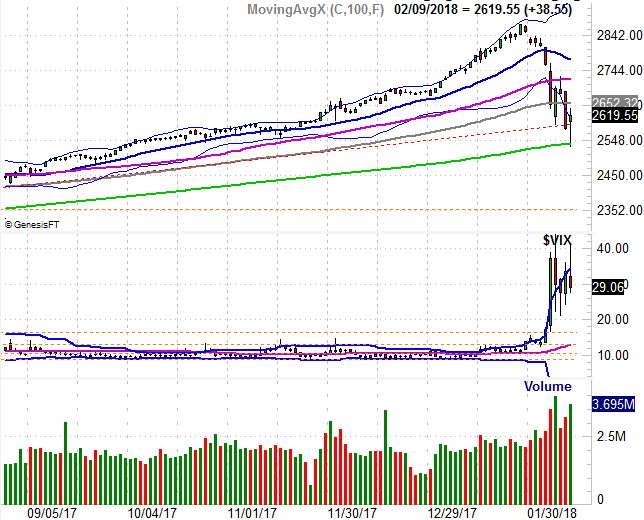
To that end, take a look at the daily chart of the S&P 500.
S&P 500 Daily Chart, with VIX and Volume
 [10]
[10]
Source: TradeNavigator
Friday's kiss of, and then push off of, the 200-day moving average line is encouraging. Not even support at the 200-day moving average line on Friday, however, is a guarantee that the selling is over. It may have just been the first wave. Once the sellers get a chance to regroup, it's possible we could end up seeing the 200-day line fail as a support level.
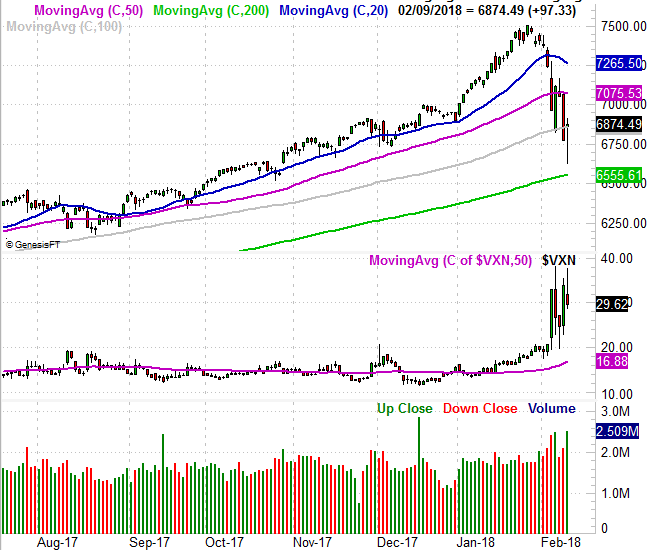
For what it's worth (which isn't much), the NASDAQ Composite's chart doesn't tells us anything else about what's likely to be next. Friday's doji bar suggests we should see a bullish bounce, but that rebound effort may not last long. The market's undertow is still being driven by fear and greed more than anything else, and most traders aren't sure which they should be yet.
NASDAQ Daily Chart, with VXN and Volume
 [11]
[11]
Source: TradeNavigator
This week is going to be a test. It's also a coin toss, and not one really worth betting big on. We do expect the bulls to push back, but that effort may be nothing more than a dead-cat bounce. The S&P 500 — and the NASDAQ Composite for that matter — need to get back and above and stay above their 20-day moving average lines to really trust any bounce.
And even then, it's difficult to trust the rally would be a prolonged one. Remember, the S&P 500 rallied 58% between February of 2016 and the high from two weeks ago. There's still a lot of profit-taking to be done, and valuations remain something of a headwind.
Conversely, another good-sized breakdown should be the last one for the market, as it would drive a true and complete capitulation that would be a great entry point for long-term and short-term positions. The hard part is remaining patient.