
Never let it be said the bulls were good at pacing themselves. But, they did the work they needed to. Last week, both of the indices hurdled the technical ceilings we feared they wouldn’t be able to just a week earlier. Problem? It was just a little too good, leaving yet-another opening gap behind with Monday’s strong open. The bears might try to close this gap… which is exactly where nobody wants it to be.
We’ll dissect what’s become a complicated problem below, as we always do. First though, let’s look at last week’s top economic reports, and preview what’s in the lineup for this week.
Economic Data Analysis
What a week! And, it was mostly good/encouraging news.
Take inflation for instance. Inflation levels continue to cool across the board, with the overall consumer inflation rate sliding to a new multi-year low of 2.3%… roughly in line with the Fed’s long-term target.
Consumer, Producer Inflation Rate Charts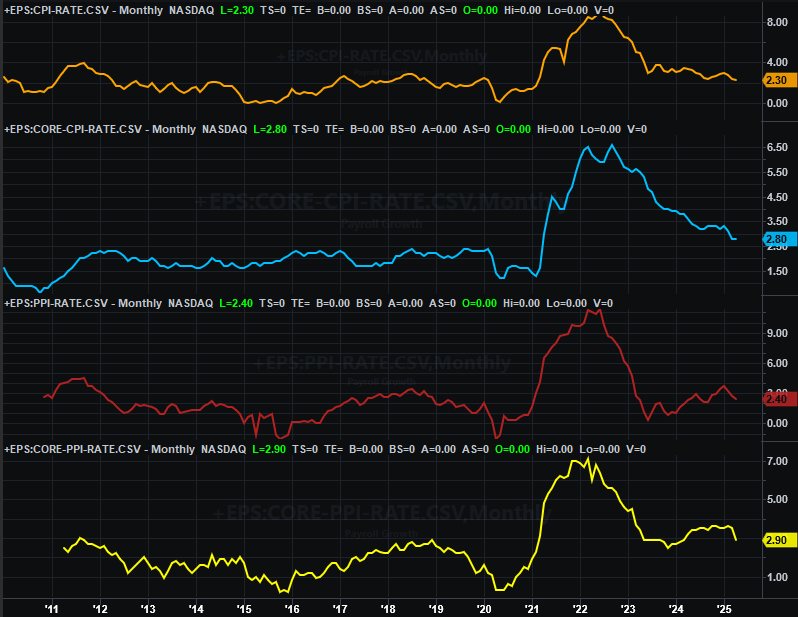
Source: Bureau of Labor Statistics, TradeStation
This of course means the Federal Reserve has room to lower interest rates, which it’s been seemingly hesitant to do. This may well seal the deal, so to speak.
And the FOMC may not want to tarry much longer, if a rate cut is on its radar. Although consumers tried to beat then-impending tariffs that were to go into effect in April by front-loading purchases in March, it’s still suspicious that retail spending leveled off a bit in April.
Retail Sales Charts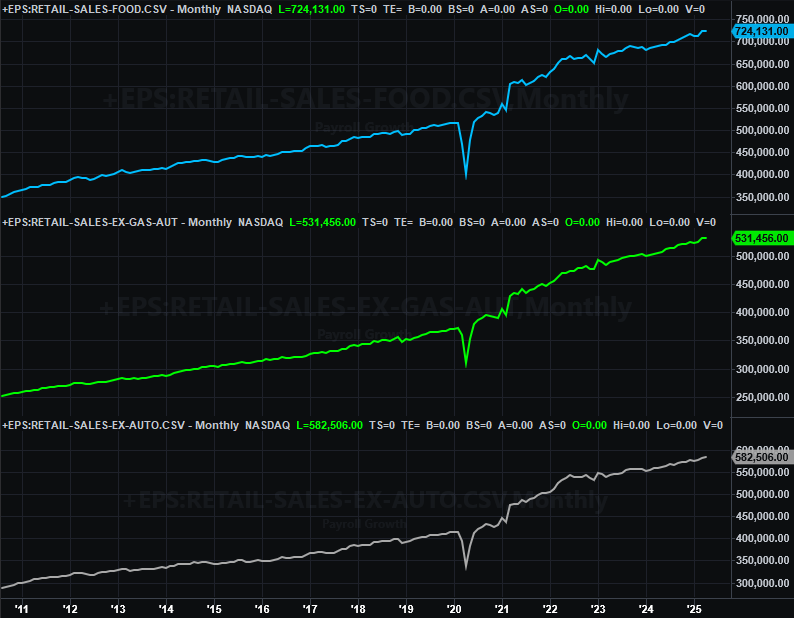
Source: Census Bureau, TradeStation
Underscoring this worry is the lull we saw in the amount of factory-production capacity the country was utilizing as of April, and how much stuff was actually produced. Both fell last month, quelling budding hopes for a rebound.
Industrial Production, Capacity Utilization Charts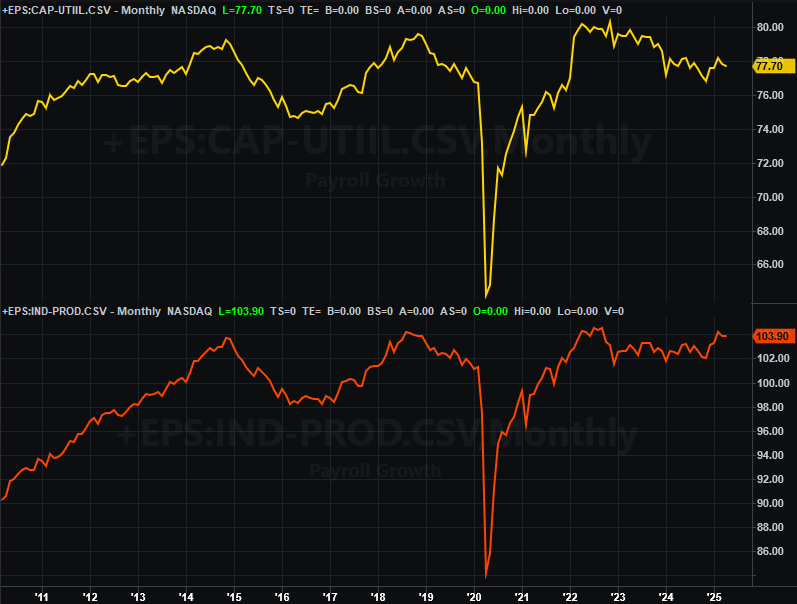
Source: Census Bureau, TradeStation
It’s still too soon to say industrial production or capacity utilization is in steep decline. But, it would be better to spur both higher sooner than later. A rate cut could help in this regard.
Ditto for housing starts and building permits. The former edged just a bit higher last month, but at 1.36 million (annualized) units, it’s still quite low. Meanwhile, the number permits issued slumped once again, and is knocking on the door of multiyear lows.
Housing Starts and Building Permits Charts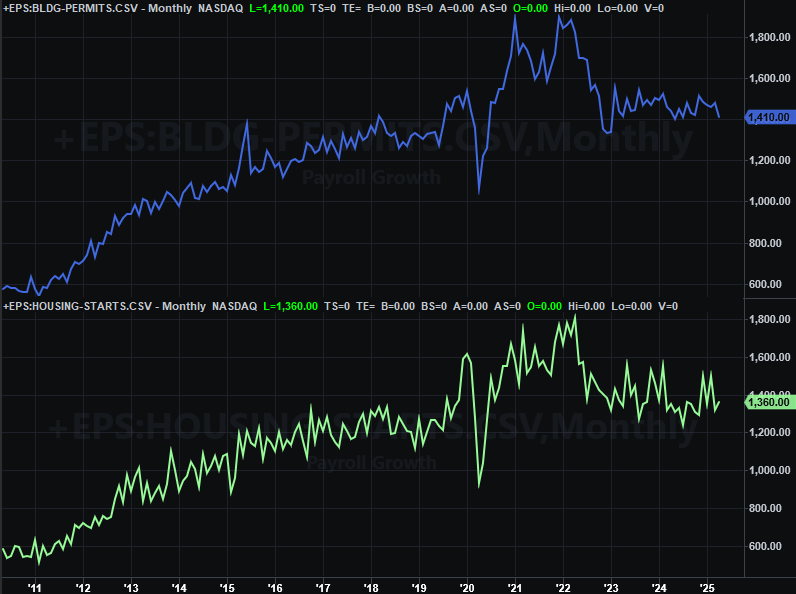
Source: Census Bureau, TradeStation
Again, lower interest rates could help shore up these numbers.
Everything else is on the grid.
Economic Data Report Calendar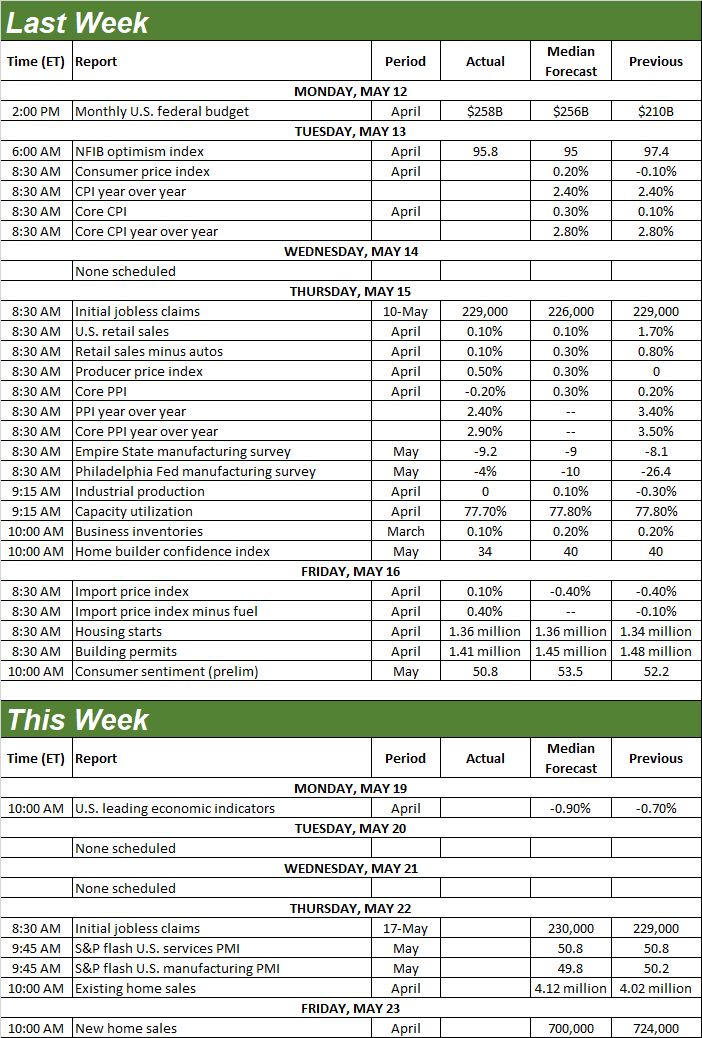
Source: Briefing.com, TradeStation
A very light week this week, with only home sales on tap. April’s new-home sales report from the Census Bureau will be posted on Thursday, with last month’s sales of existing homes due on Friday. As has been the pattern for some time now, the prior month’s pullback in existing home sales will likely tick up, while March’s bounce in new home sales likely peeled back. In both cases though, the numbers remain at clearly-depressed levels.
New, Existing Home Sales Charts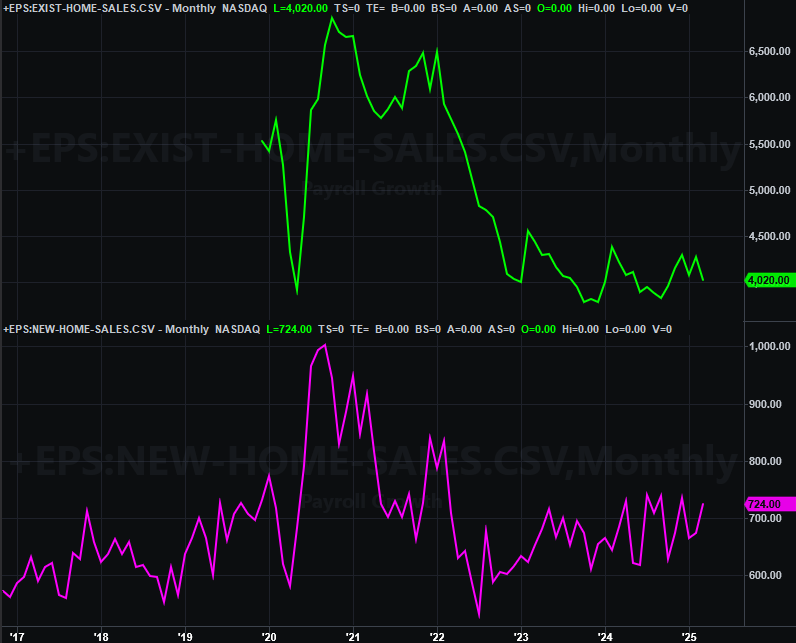
Source: Census Bureau, Natl. Assn. of Realtors, TradeStation
Stock Market Index Analysis
When all was said and done, the S&P 500 got back on its bullish horse last week, rallying 5.2%, and hurdling the 100-day (gray) as well as the 200-day (green) moving average line thanks to Monday’s explosively-bullish jump. And there’s the rub. As the daily chart of the index below shows us, the move left behind a sizeable gap (circled), and never really looked back. Stocks ended up closing at their high for the week.
S&P 500 Daily Chart, with VIX and Volume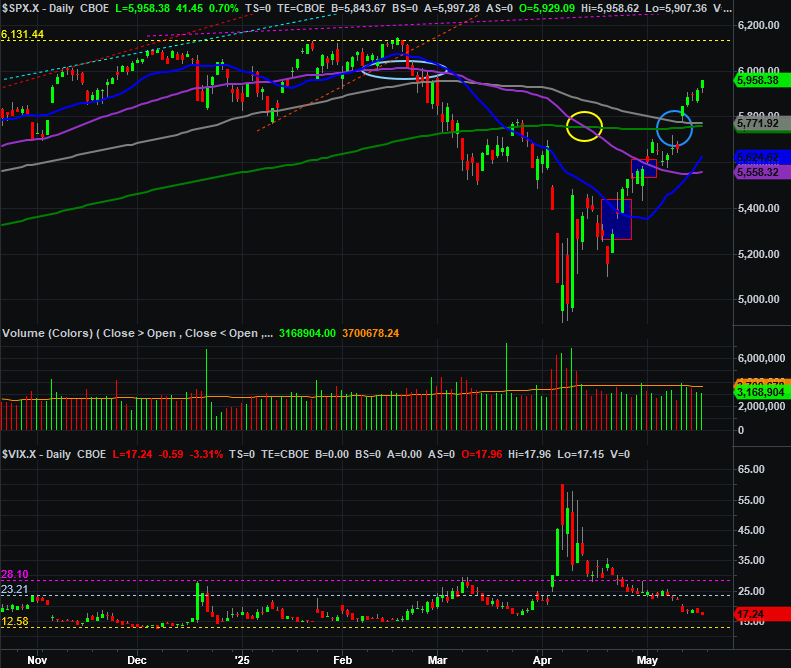
Source: TradeNavigator
Do we trust this move as a hint of more bullishness ahead? It’s certainly tough to do. While we’re momentum traders (trend followers), we have to acknowledge the market has moved too high, too fast, and too soon. The index is now 21.4% above its early April low, and there’s still subpar volume behind the advance.
That doesn’t the bulls didn’t do what they needed to do. It just means they did so in a way that leaves behind too many questions. We don’t want to presume too much until the index’s gain is tested. The problem is, that test could end up starting a selloff that isn’t easily stopped. For now we’ll use the 100-day and 200-day moving averages as our make-or-break mark.
The NASDAQ Composite’s daily chart looks similar, by the way. It hurdled its 100-day and 200-day moving average lines (gray and green, respectively) we thought might act as a ceiling with Monday’s big jump. The goods news is, the volume here is getting stronger as the rally moves forward. The bad news is, the composite’s daily gains seemed to lose steam as the week wore on.
NASDAQ Composite Daily Chart, with VXN and Volume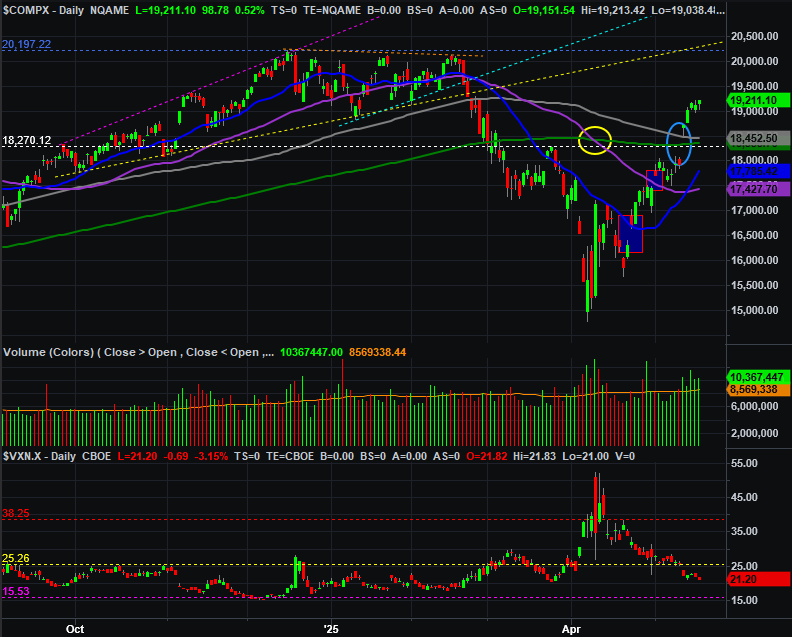
Source: TradeNavigator
That’s not necessarily a bad thing though. Honestly, the best thing for the bulls and the rally at this point would be a manageable dip that can be easily resisted. Ideally, the 100-day and 200-day moving averages will serve as the floor of a small pullback, rekindling the rally effort at a more sustainable pace. The problem of course is stopping any such selloff before traders stumble into a panic.
That move would still leave Monday’s gap unfilled though.
By the way, although this isn’t the case for the NYSE’s stocks, the NASDAQ’s up and down volume and advancers-versus-decliners are both clearly leaning in a bullish direction, and increasingly so. This gain does have more support than it seems like it does on the surface, even if it’s not the technically-soundest and ideally-sustainable move.
NASDAQ Composite Daily Chart, with Up/Down Volume and Advancer/Decliner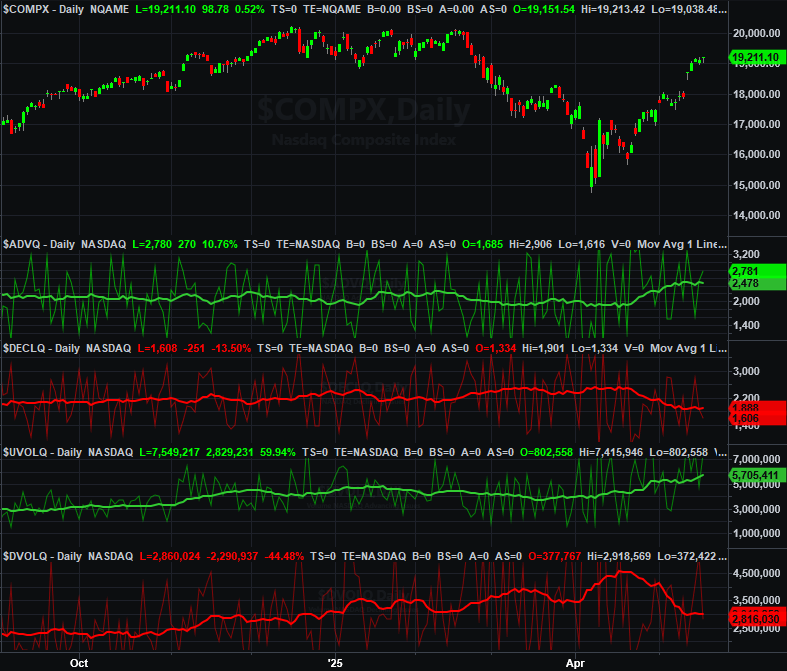
Source: TradeNavigator
Here’s the weekly chart of the S&P 500, for a little better perspective on the rebound since early April. It’s big. Like, real big. Almost the entirety of the steep selloff from February’s high has now been reclaimed, although perhaps a bit too quickly. The volatility index (VIX) of course is making the mirror image move, but again, perhaps has fallen too far, too fast. Although we technically saw a bullish MACD cross take shape last week — which of course is bullish — this chart still says we need a healthy test to prove the rally’s actual mettle.
S&P 500 Weekly Chart, with VIX and MACD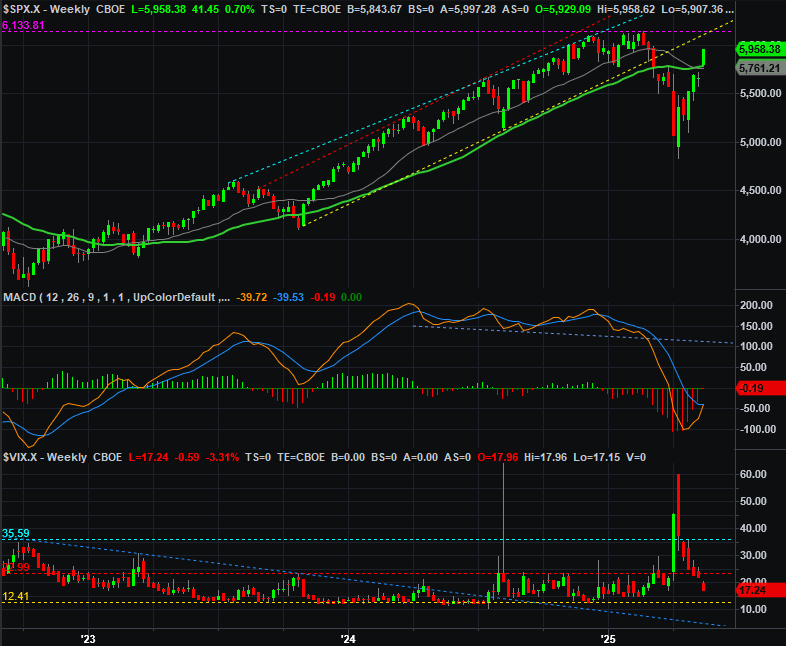
Source: TradeNavigator
So what’s the call? We’re anticipating the aforementioned test of the 100-day and 200-day moving average lines, but not necessarily any more than that. That is to say, as it stands right now, we believe in the recovery. We also just believe it needs a bit of a cool-off and reset before continuing.
Now let’s see if our presumed technical support actually holds up as a floor.