
It was down, then up, then basically back to a breakeven on Friday, mirroring the volatile indecision we saw the whole week. Yes, the stock market technically logged its seventh weekly loss in a row last week, and the most recent one was anything but modest. Between Friday's headfakes and what looks like the forming of technical support though, it's not crazy to entertain the possibility that we're finally at a trade-worthy bottom.
Before we get to that can of worms though, let's recap last week's biggest economic announcements, and then look at what's coming this week.
Spoiler alert: Inflation hasn't been curbed yet.
Economic Data Analysis
Although the market is pricing in trouble, at least on the economic front we didn't see any real problems last week. In fact, the economy is seemingly still going strong, save for one unsurprising arena.
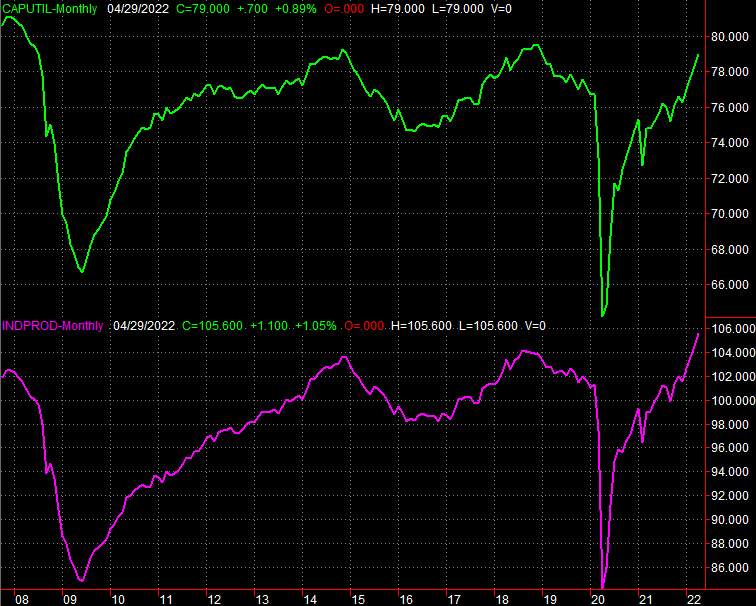
Factories are still plenty busy. April's capacity utilization edged a little higher again, moving to 79.0%. That's above where it was right before the pandemic struck, though still not quite back to the highs seen in late-2018 when the economy was in high gear. Meanwhile, the Federal Reserve did say that outright industrial production moved deeper into record territory. Part of that can be chalked up more people consuming more goods. Either way, the economic undertow is moving firmly in the right direction… at least through April. Much could have changed just this month. We just can't assume it has yet.
Capacity Utilization, Industrial Productivity Charts
 [1]
[1]
Source: Federal Reserve, TradeStation
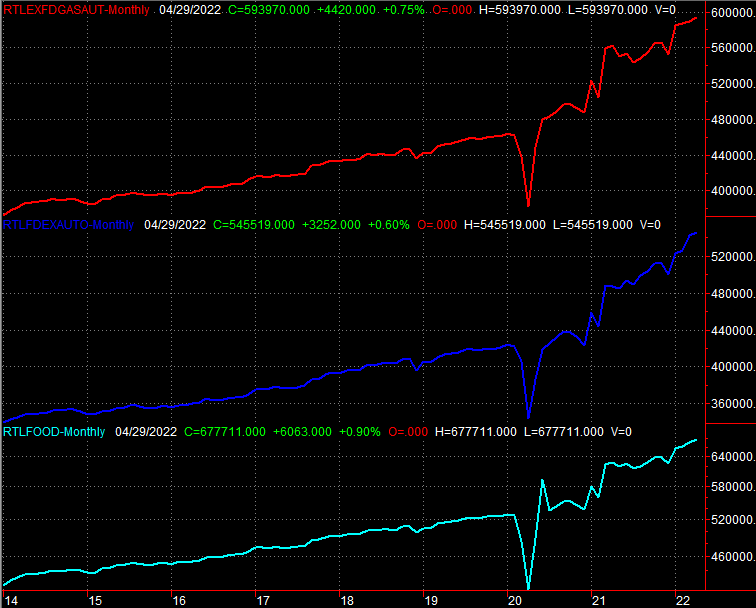
Retail sales through April also remained brisk, in all stratifications. Even car sales are humming again, although the comparison is relatively low. Inflation — higher prices — boosts overall retail spending, but it's pretty clear consumers are buying even though they're grumbling.
Retail Sales Charts
 [2]
[2]
Source: Federal Reserve, TradeStation
Even starts and permits are reasonably healthy through April. Building permits fell a little bit to a pace of 1.82 million, while housing starts of 1.72 million more or less matched March's levels, though fell short of expectations for an annualized pace 1.77 million. Those figures both extend a well-established trend that got going all the way back in 2010. If higher rates are a problem, the construction industry doesn't know it yet.
Housing Starts, Building Permits Charts
[2] 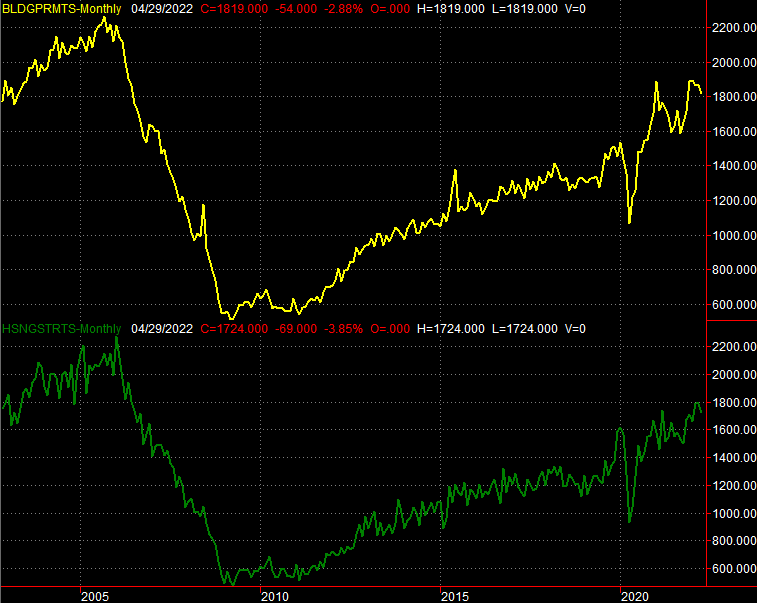 [3]
[3]
Source: Census Bureau, TradeStation
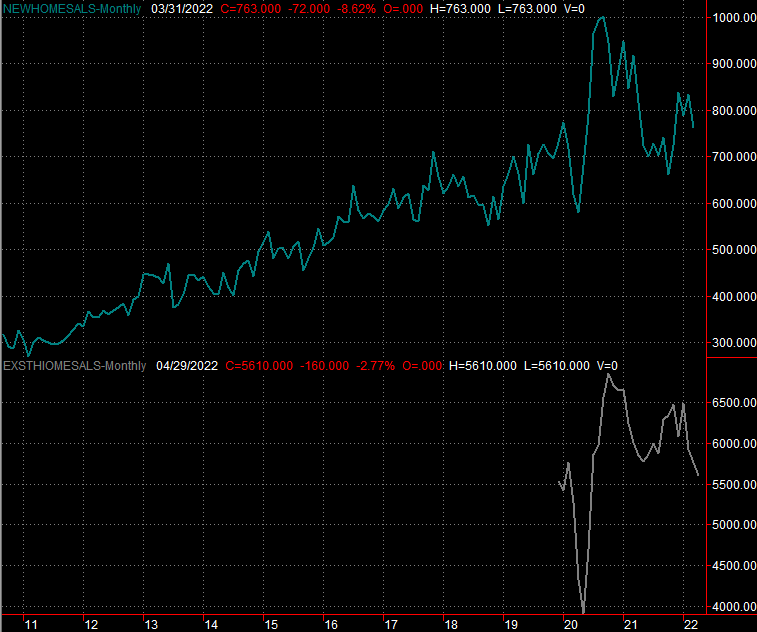
Higher rates, however, may be a growing problem for would-be buyers. Sales of existing homes slipped to a pace of 5.61 million in April, which is the lowest level seen since the point when the pandemic first arrived in the United States in early 2020.
Home Sales Charts
 [4]
[4]
Source: National Association of Realtors, Census Bureau, TradeStation
We don't have April's sales of new homes yet. That report is coming this week. It's expected to slip a little, from a pace of 763,000 to 750,000. That's still reasonably healthy though, jibing with resilient starts and permits. Though housing prices are uncomfortably high, there's still a shortage of places to live.
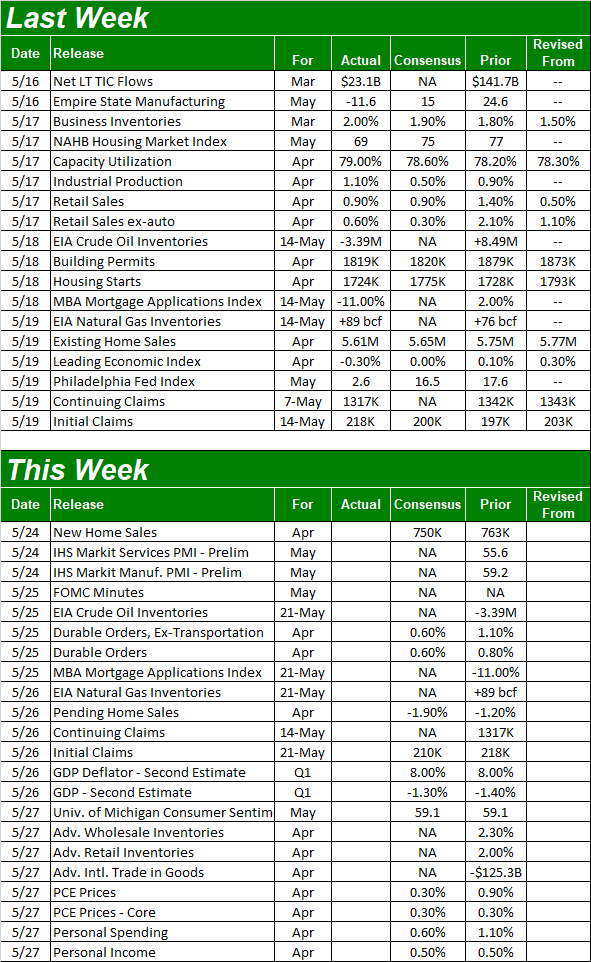
Everything else is on the grid.
Economic Calendar
 [5]
[5]
Source: Briefing.com
In addition to last month's new home sales data due on Tuesday, keep your eyes peeled for the reaction to the release of the minutes from the Fed's most recent meeting on Wednesday. On Thursday we'll get the second estimate of the first quarter's GDP growth pace, though economists still suspect it slumped on the order of 1.3%. This contraction isn't showing up in any other data yet, although investors are clearly pricing it into stocks.
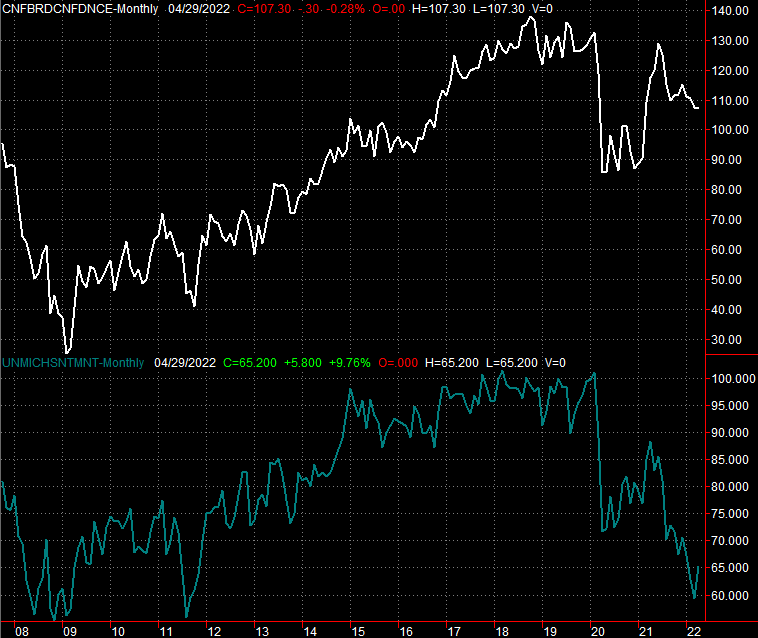
To this end, the only preview chart we want to look at this week is of consumer sentiment. The third and final look at the University of Michigan Sentiment Index is coming on Friday, and unsurprisingly, it's expected to reach the lowest level it's hit in years.
Consumer Sentiment Charts
 [6]
[6]
Source: University of Michigan, Conference Board, TradeStation
The Conference Board's consumer confidence report isn't coming out until next Monday, and forecasts aren't posted yet. It's sliding too though, and given the market's continued freefall, it's apt to move lower for May as well.
Stock Market Index Analysis
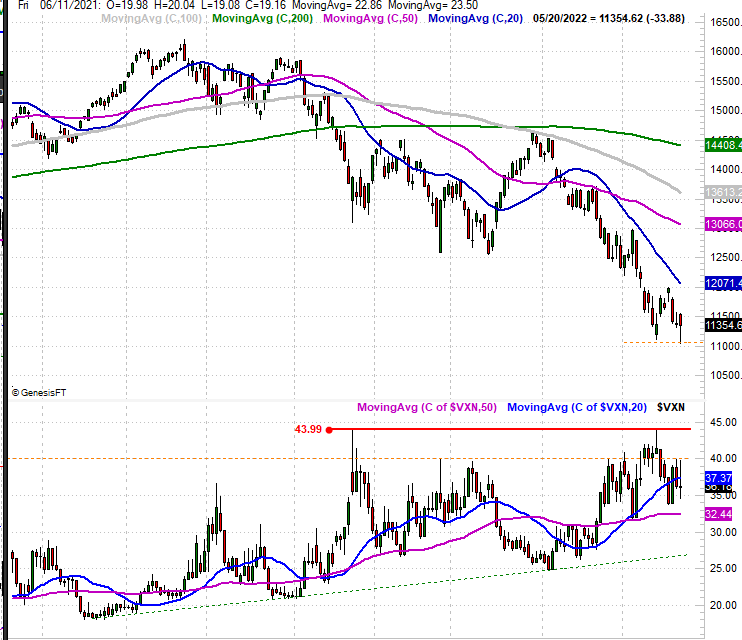
We kick this week's analysis off with zoomed-in look at the daily chart of the NASDAQ Composite, as this is where the market's most interesting nuance from last week becomes crystal clear. That is, the index more or less matched the previous week's low of 11,108 with a low of 11,035… inches away, by market index standards. The bulls may have drawn their line in the sand there, particularly given the intraday reversal that took shape after that low was made on Friday.
NASDAQ Composite Daily Chart, with VXN
 [7]
[7]
Source: TradeNavigator
It's not just the NASDAQ's recent lows though. The volatility index (or VXN) is playing along too. The peak of 44.0 from two weeks ago matched the high from January (red, solid), but more than that, it seems to be bumping into resistance around 40.0 (orange, dashed). Although we'd like to see more "spikiness" to mark a bottom, we can leave with a more gradual, rounded shift from up to down.
This isn't a call for new-found bullishness… at least not yet. But, it's a possibility we have to consider, and start watching for.
And the S&P 500 is doing its bullish part. Though not with as much precision as the NASDAQ, the S&P 500's low from Friday only briefly eclipsed the low of 3859 from a couple of weeks ago before snapping back to a slight gain for the day… a wide swing that shows a big change of heart headed out of the week and into the weekend. That's a bullish sign, as it indicates commitment to stocks for a two-day stretch during which investors are stuck with them.
S&P 500 Daily Chart, with VIX and Volume
 [8]
[8]
Source: TradeNavigator
The S&P 500's volatility index (or VIX) is starting to lean in a bullish direction too, even if only by virtue of not being bearish. Although it's had ample opportunity and reason to do so, the VIX just isn't moving above 37.50 (dashed) even though stocks have been ravaged since January. In fact, the high from two weeks ago didn't even test that ceiling. One could argue that if we're going to see a peak in fear that we'd expect to see at a major bottom, we'd at least start seeing it take shape by now. What we're seeing instead suggests that traders are taking their beatings in stride, anticipating things will take a turn for the better soon enough. (Contrarian theory, of course, says they won't get that as long as they confidently expect it.)
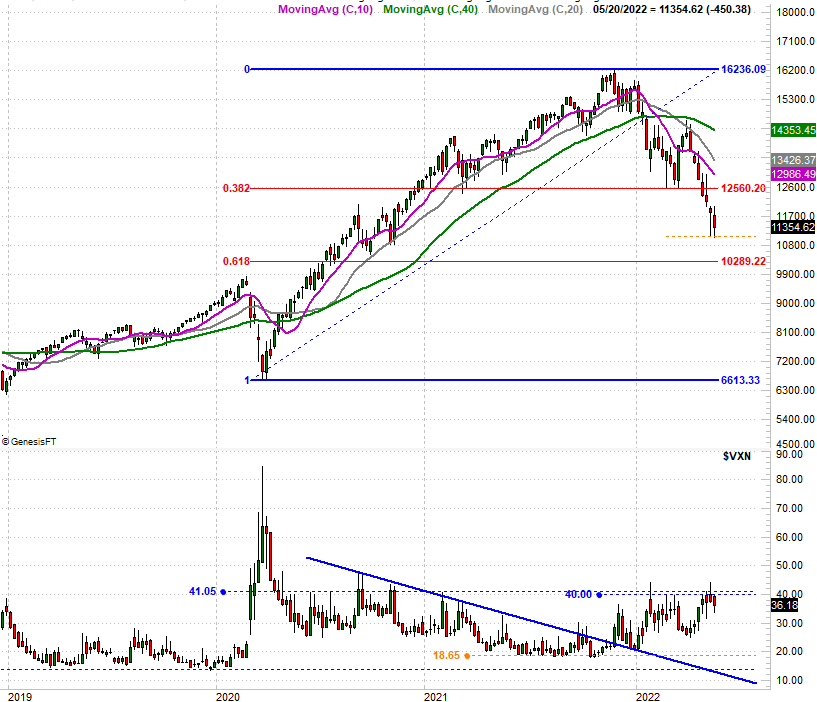
Here's the weekly chart of the NASDAQ Composite, which doesn't tell us anything new, but does put the rout suffered over the course of the past six weeks — and now five months — into perspective. From peak to trough the index is now down 30%. That's huge, though it's so huge it seemingly sets the stage for a sharp rebound. This vantage point also shows us just how strong the VXN's ceiling at 41.0 is.
NASDAQ Composite Weekly Chart, with VXN
 [9]
[9]
Source: TradeNavigator
By the way, the horizontal lines are Fibonacci retracement lines… major psychological lines in the sand that help out when there's no other technical trading framework to latch onto. While the 12,560 floor has already been breached, it's still in play. The "next stop" so to speak, though, is 10,289. That would mark a 36% pullback from January's high. It's tough to imagine things getting significantly worse than that, even if we do slip into a recession.
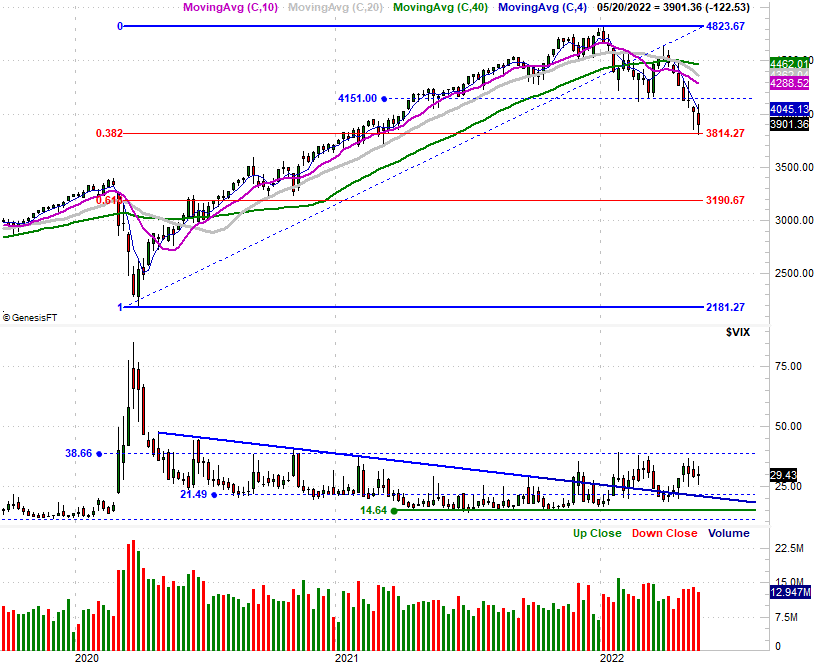
Here's the weekly chart of the S&P 500. Note that last week's low is almost a perfect 38.2% Fibonacci retracement of the span between the early March low and January's high. This is where you'd expect a bottom to be made when there are few other clues helping mark a potential bottom.
S&P 500 Weekly Chart, with VIX and Volume
 [10]
[10]
Source: TradeNavigator
DO NOT JUMP THE GUN HERE! Stocks may be finding support and the volatility indices may be finding resistance, while the S&P 500's touch of the Fibonacci floor is encouraging. None of the indices are actually moving higher here, however, and Friday's intraday reversal isn't particularly unusual in the current environment. Both the indices will need to clear their 20-day moving average lines (blue) before we can even start to trust any bullish clues. The volatility indices will also need to start trending lower.