The market may have started the week with a less, and the holiday may have given stocks one less day to make up for it. But, it didn't matter. By the time the week's closing bell rang on Thursday, the market was up nearly 2.3% from the prior Friday's close, ending the session at a record-high close. Not bad… not bad at all.
Don't read too much into the advance, however. Stocks typically rally this time of year. The volume behind the gains was minimal as well, suggesting there weren't actually many buyers behind the effort. Translation: Stocks could still be up-ended here, crumbling under the weight of gains logged since the early part of last year.
We'll take a detailed look at the lines the market's indices didn't cross last week in a moment. First, let's review last week's most important economic news, and take a look at what's coming this week.
Economic Data Analysis
Not a terribly big week, but there are a couple of items worth a look.
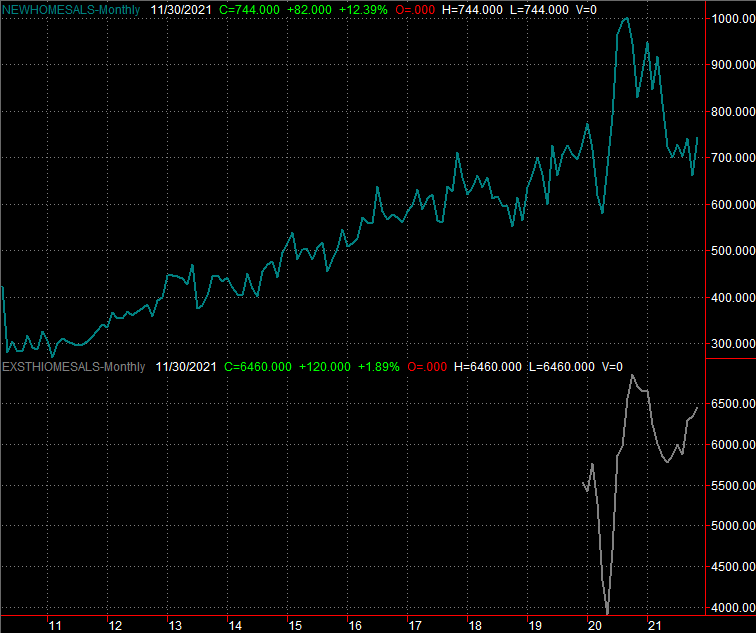
We added to the real estate picture with a look at last month's sales of existing homes on Wednesday and sales of newly-built homes on Thursday. Both improved, though both figures come with a major footnote. New homes sales only grew because October's figure was revised dramatically lower, and existing home sales — like new home sales — didn't live up to expectations.
Home Sales Charts
 [1]
[1]
Source: Conference Board, University of Michigan, TradeStation
As the chart illustrates, there's room for improvement on both fronts. At the very least though, both sets of homebuying data aren't falling.
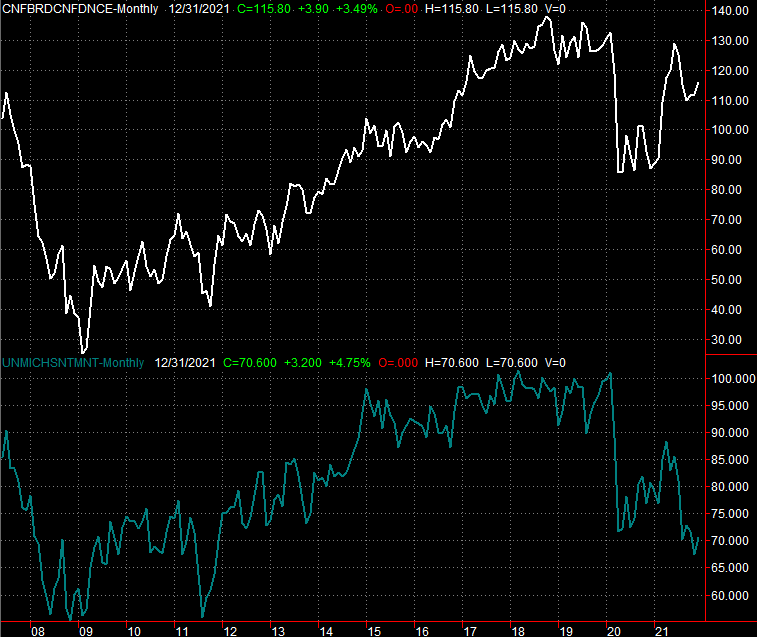
It was also an important week for looks at sentiment. We heard the one and only report of the Conference Board's consumer confidence score on Wednesday, with the third and final look at the University of Michigan's sentiment index being posted on Thursday. Both rolled in a little better than expected, but even so, neither is firmly impressive at this time.
Consumer Confidence Charts
 [2]
[2]
Source: Conference Board, University of Michigan, TradeStation
Finally, though there's no chart of it, note that the third estimate of Q3's GDP growth rate has been upped from 2.1% to 2.3%. Everything else is on the grid.
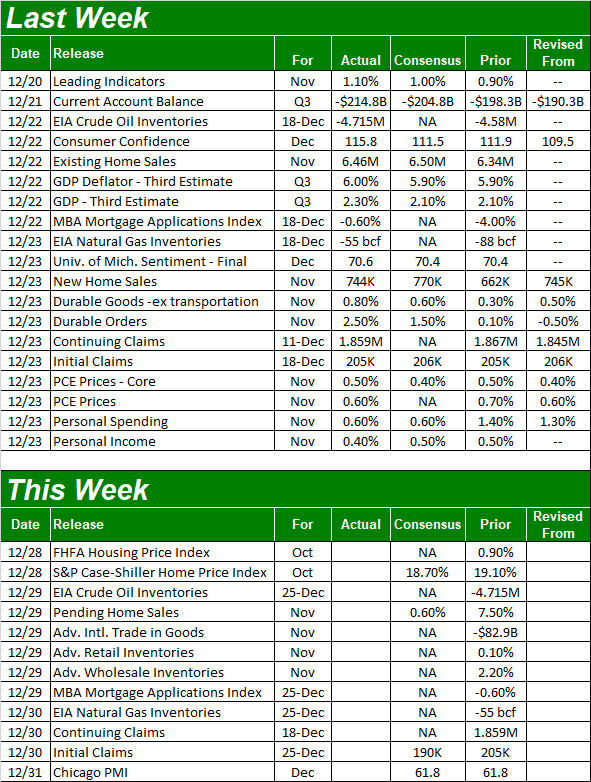
Economic Calendar
 [3]
[3]
Source: Briefing.com
The only thing in the lineup this week we're really interested in is this week is Tuesday's report from the FHFA about home prices, and the housing price update from Standard & Poor's and Case Shiller. The Case Shiller figure's growth rate is expected to cool off, but the expected year over year growth of 18.7% is still phenomenal. Just bear in mind that both figures due this week are for October. Much could have changed in the meantime.
Home Pricing Charts
 [4]
[4]
Source: Standard & Poor's, Case Shiller, FHFA, TradeStation
The recent, meteoric rise has been incredible to say the least. But, it would be shortsighted to ignore that the rate of gain has been too rapid to be sustainable. It may be so rapid, in fact, that a sharp course correction is due.
Stock Market Index Analysis
The S&P 500 may have logged a record-breaking close on Friday, but it was hardly the victory the bulls would have liked to have seen. The index still retreated after bumping into a well-established technical ceiling (blue) near 4741. And, the volume behind last week's advance started out modestly, and then weakened all week long. The gains don't have a lot of "umph" behind them. Take a look.
S&P 500 Daily Chart, with VIX and Volume
 [5]
[5]
Source: TradeNavigator
In some ways the NASDAQ Composite fared batter, but mostly, fared worse.
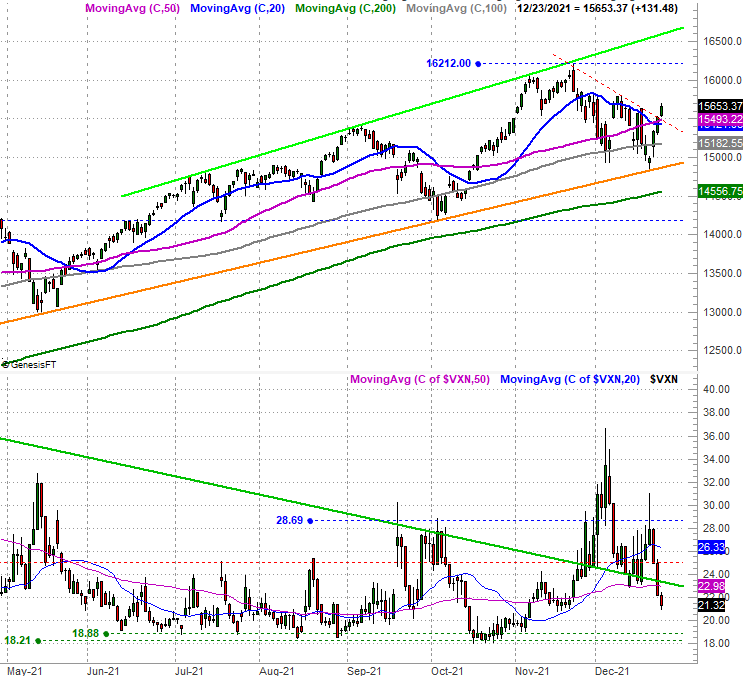
The NASDAQ's biggest victory was the push above the falling resistance line (red, dashed) that had been steering the index lower since November's high. It's also encouraging to see it only took a kiss of the rising support line (orange) that's been in place for months to rekindle the bigger-picture rally.
NASDAQ Composite Daily Chart, with VXN
 [6]
[6]
Source: TradeNavigator
Still, the composite clearly failed to even test its prior highs… unlike the S&P 500.
Zooming out to the weekly chart of the NASDAQ Composite shows us something telling that's not readily evident in looking at the daily chart. That is, on a weekly basis, the NASDAQ has been and still is trapped in sort of box, between 14,920 and 15,710. It's tested that floor and ceiling (more or less) every week for the past four weeks, but has never really broken out of that confinement.
NASDAQ Composite Weekly Chart, with VXN
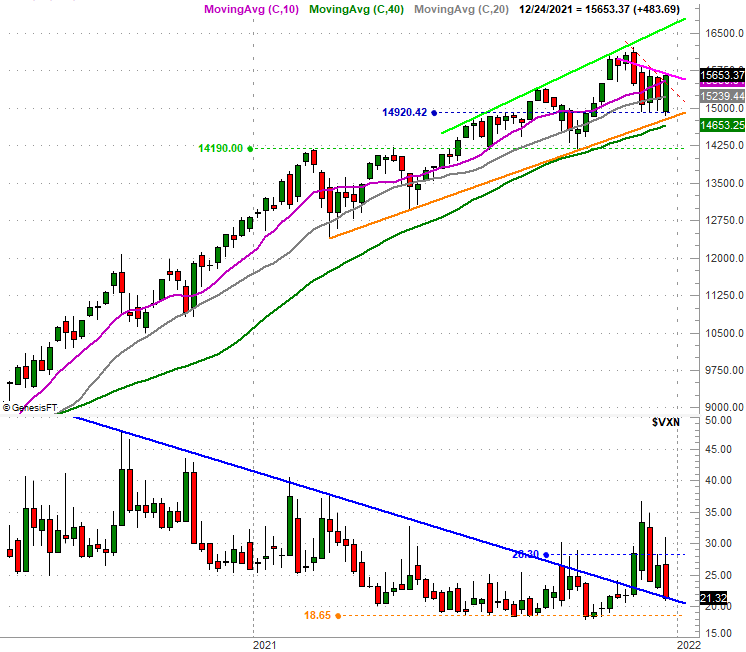 [7]
[7]
Source: TradeNavigator
The S&P 500 is in a similar (though not identical) situation. That is, in the weekly timeframe the index remains capped by a well-established ceiling around 4724 (blue, dashed). The same weekly chart also tells us that the floor, while not horizontal, is also well established by the convergence of the 100-day moving average line (gray) and the straight-line support (pink) that connects all the key lows going back to late last year.
S&P 500 Weekly Chart, with VIX and Volume
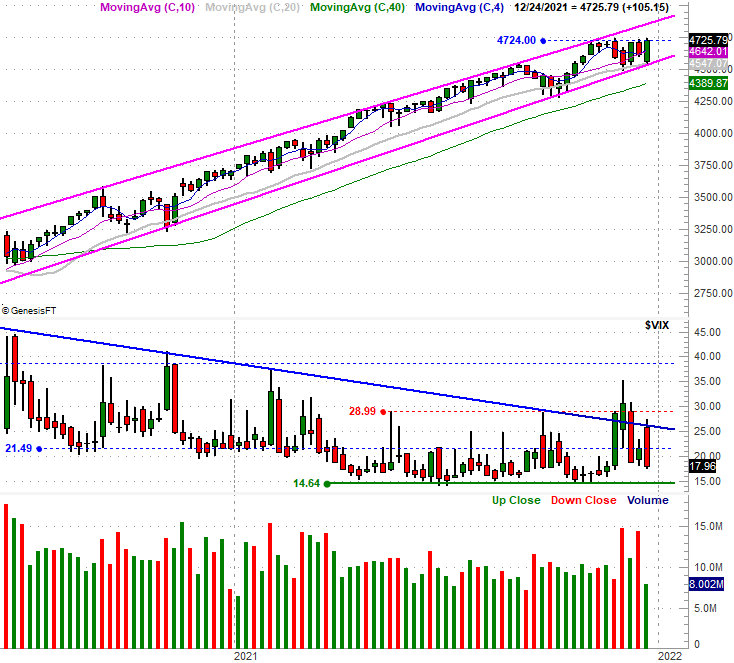 [8]
[8]
Source: TradeNavigator
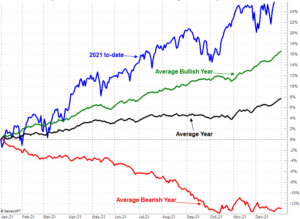
On balance, the trend is bullish. That's because the momentum is bullish despite all the technical resistance above; you'll notice the technical floors are holding up better than the ceilings. You'll also see that both the VIX and the VXN still have some room to keep moving lower. And, bear in mind that we're in what's almost always a bullish period of the year… even if only modestly bullish.
S&P 500 Day-by-Day Full-Year Average Performance
 [9]
[9]
Source: TradeNavigator
Of course, the day-by-day performance chart also makes clear that this year's gains put the S&P 500 well ahead of where it would normally be at this point in time, setting the stage for prospective profit-taking.
Just tread lightly.