Weekly Market Outlook - Nothin' Was Ever Going To Be Easy From Here
We knew headed into last week things were going to be tough. Stocks were already overbought, and traders were really relying on another round of stimulus checks coming through. That didn't happen, and traders flinched. The peak happened right where it should have happened too, suggesting traders had psychologically (and perhaps even unconsciously) actually planned a pullback here a while back.
Stocks are still overbought and ripe for at least a little more downside, which isn't the typical tide we see around this time of year. The market is in something of a tug-of-war as a result. That's one of the reasons we're treading lightly here, so to speak.
All things considered though, the weakness could have been worse.
We'll drill into the specifics below, pointing out how last week's lull may have been pre-ordained weeks ago. First things first though. Let's recap last week's economic news and preview what's coming this week.
Economic Data Analysis
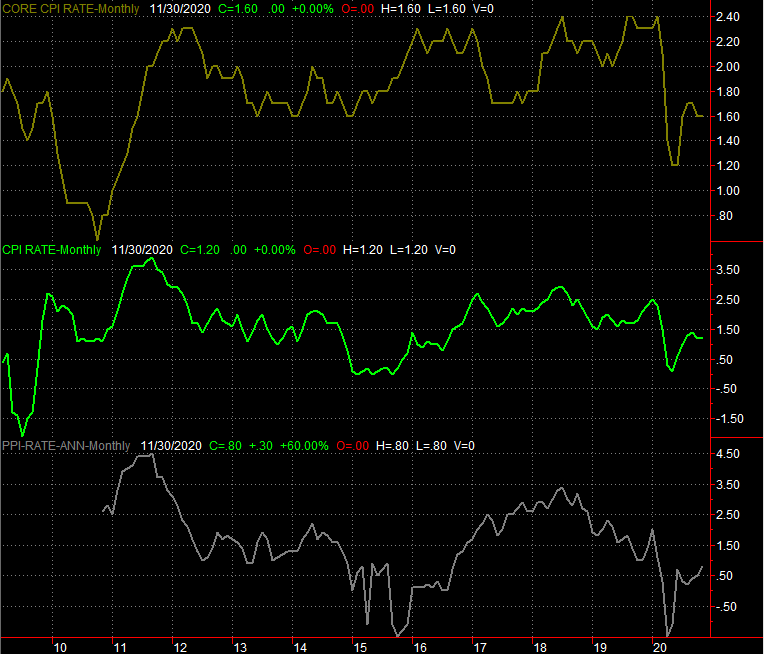
The only item of real interest from last week an updated look at the nation's inflation. Despite the boatloads of cheap money in circulation right now, inflation remains surprisingly tame. The overall consumer inflation rate (annualized) stands at 1.6%, flat with October's level, and down slightly from September's rate.
Consumer, Producer Inflation Rate Charts
Source: Bureau of Labor Statistics, TradeStation
Yes, producer inflation is rising rapidly. Keep it in context though. IT plunged dramatically early this year. It's still a very modest 0.6% as of last month, which actually alarmingly weak.
Everything else is on the grid.
Economic Report Calendar

Source: Briefing.com
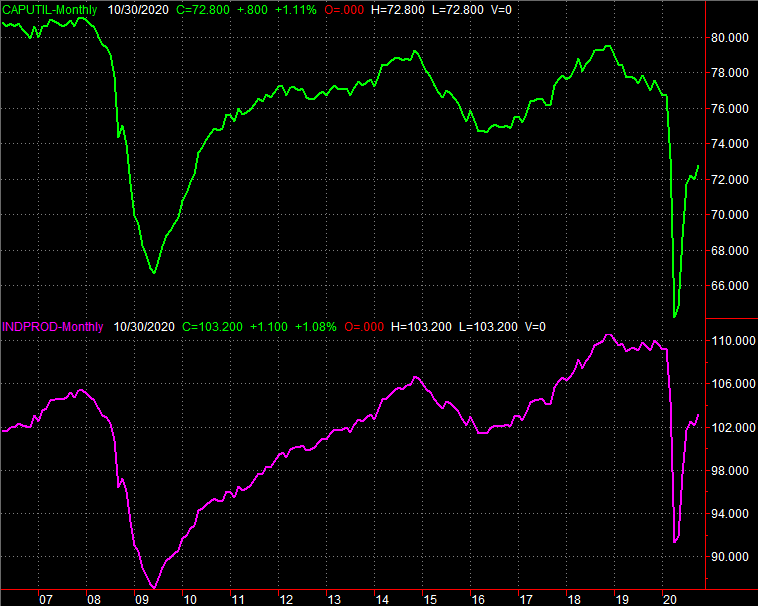
This week's going to be considerably busier, with the Federal Reserve's look at capacity utilization and industrial productivity being the first big item in the lineup. These measures remain well below their pre-COVID peaks, but importantly, both are rising rapidly. The trajectory is the key. That said, economists are predicting this ascension is slowing down.
Industrial Production, Capacity Utilization Charts
Source: Federal Reserve, TradeStation
Topping those production and capacity utilization forecasts would be a big win for stocks.
Economists are also calling for a relative slowdown of the nation's retail spending for November, though it's worth noting that consumerism has been better than expected for months now. Don't be surprised if we beat November's estimates. Retail has been one of the economy's surprising bright spots of late, rolling in at levels suggesting consumers haven't been even a little bit crimped by the pandemic. They're just finding different ways to spend.
Retail Sales Charts

Source: Census Bureau, TradeStation
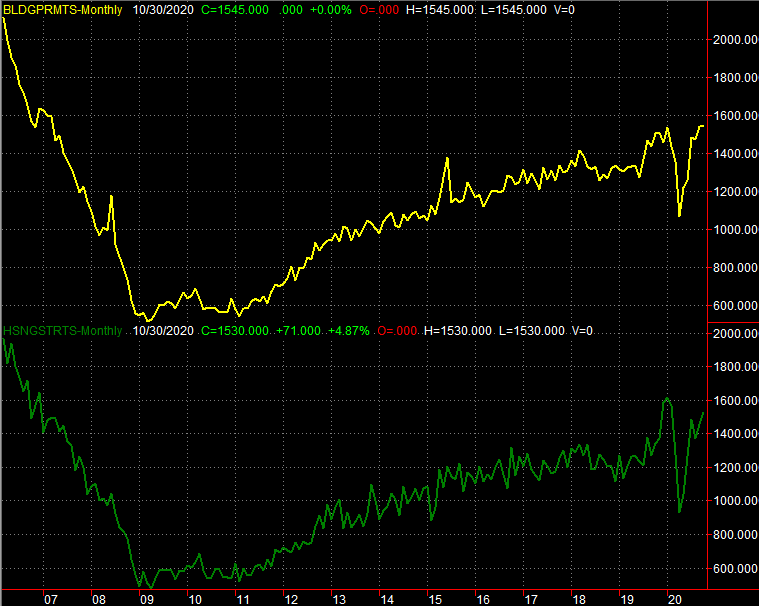
Finally, look for last month's housing starts and building permits data for last month to be reported late in the week. This too has been a surprising bright spot, with people taking advantage of ultra-low interest rates to purchase new real estate. Economists believe the red-hot growth has leveled off, but they don't think starts and permits are poised to contract from firm levels just yet.
Building Permits and Housing Starts Charts
Source: Census Bureau, TradeStation
Stock Market Index Analysis
Stocks might have lost ground on Thursday and Friday, following Wednesday's rather sweeping reversal from an all-time high. But, the weakness we well-contained. The S&P 500 closed closer to its high than its low both days, staging decent recovery efforts from bearish opens. Friday's intraday recovery move may have been at least partially sparked by a kiss of the 20-day moving average line (blue). It's encouraging to the bulls to see a rebound effort take shape with relative ease.
S&P 500 Daily Chart, with VIX and Volume
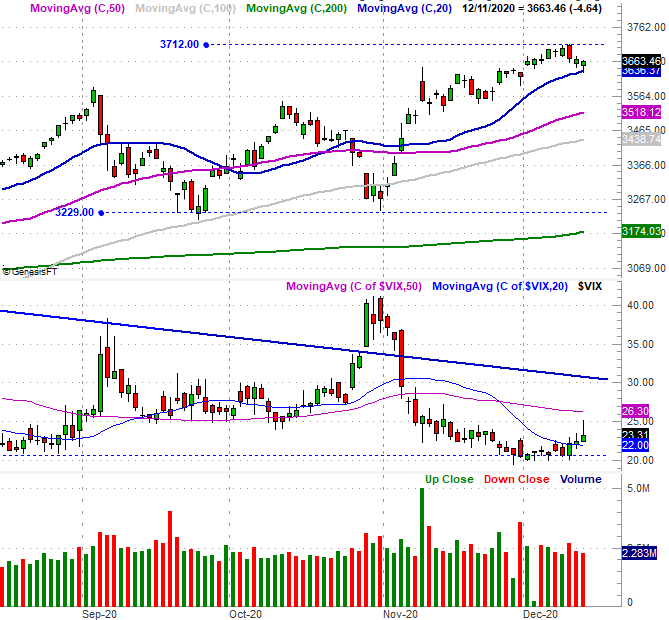
Source: TradeNavigator
That doesn't necessarily put the S&P 500 back into full-blown bullish mode though, for a couple of different reasons.
One of those reasons is the shape of Wednesday's bar. What started out as yet-another bullish day with an open above Tuesday's high quickly soured, leading to a decidedly bearish close below Tuesday's low. The bearish action from Wednesday completely engulfed the previous day's bullish bar, creating what it literally called an engulfing "outside" day bar... a big sign of traders' change of heart. While not painfully so, stocks did lose ground the following two days. That's a clue that the apparent change of heart is for real.
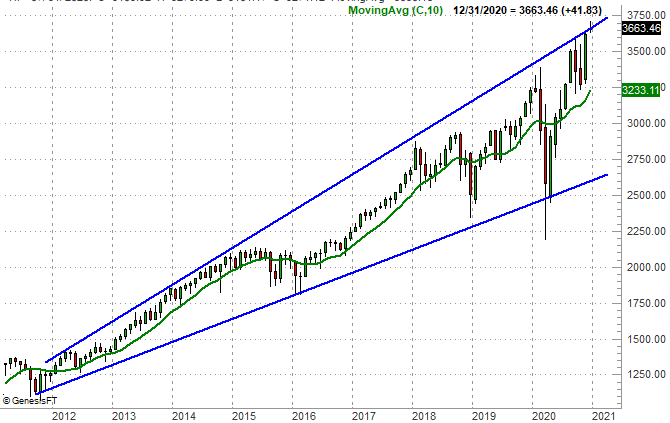
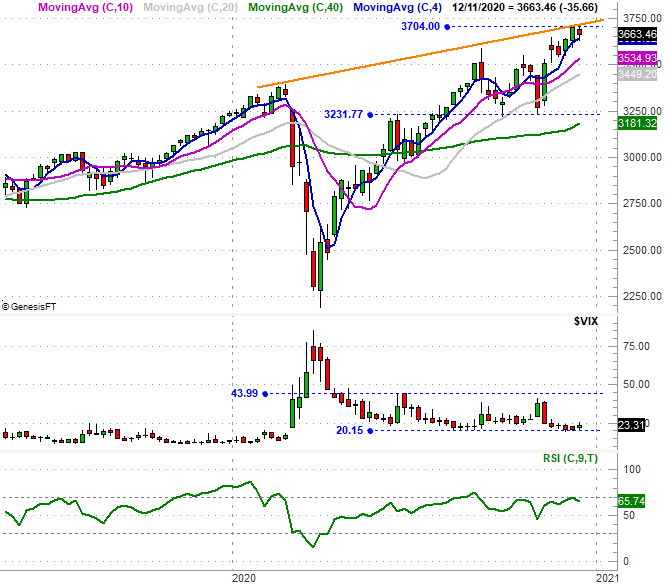
The other reason the S&P 500 isn't a particularly compelling buy still is only evident when you take a big step back and look at not just a weekly chart of the S&P 500, but a monthly chart that goes all the way back to 2012. In this timeframe we can see the index is at the upper end of an expanding trading range pretty well (though not perfectly) framing all the key highs and lows since then. This chart also shows us just how incredible the past ten months have been. We've completely traversed the entire span of this range, plus a little more. There may not be a great deal of room left for more upside...at least not at the pace we've been making gains.
S&P 500 Monthly Chart
Source: TradeNavigator
The weekly chart of the S&P 500 shows us a slightly different (though related) picture of just how difficult more forward progress could be from here. The ceiling we've been bumping into for the past couple of weeks more or less aligns with the peaks from September and February (orange). You'll also clearly see in this timeframe that not only has the S&P 500 raced oddly far away from its mean/average, but that the VIX itself has stopped moving lower. Rather, the VIX's floor established at 20.1 several weeks ago is still holding up. Traders aren't making options-based bets suggesting they expect more upside, even though stocks have continued edge higher.
S&P 500 Weekly Chart, with VIX and RSI
Source: TradeNavigator
Never say never. The market loves to defy norms and do the unexpected, just to keep traders honest. If you're playing the odds though, these aren't charts that scream "buy" anymore. On the flipside, none of these charts say stocks are falling apart yet either. Until the S&P 500 breaks below its 100-day moving average (gray) currently at 3439, the bulls will remain in the hunt, so to speak.
On a barely-related note, have you noticed the only sector doing well right now is energy? Telecom is doing alright, but oil and gas stocks are raging higher after getting crushed in the middle of this year. Broadly speaking, it seems the sectors that have done the best since March's low are starting to wane more than the areas that were subpar performers coming out of the March drubbing.
Sector Performance Comparison Chart
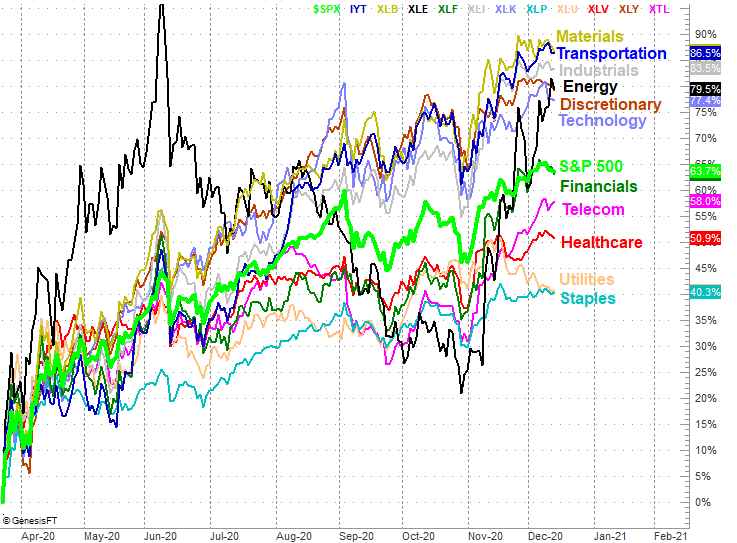
Source: TradeNavigator
It's an interesting move, though it's arguable that energy stocks have come too far, too fast. They may be due for a breather, or even a slight pullback. If they are revived and nothing else perks up, however, there could be a bullish trade there. We're also interested in telecom names, which have been able to buck off the recent weakness. In fact, they've been abnormally strong for a few weeks now. There may be a trade there as well.