Despite a lackluster end to a lackluster week, a surprisingly bullish September mean we ended the third quarter on a high note. For the three-month stretch the S&P 500 advanced 7.2%.
It's something of a two-edged sword. The end of September and the beginning of October are usually soft spots for stocks anyway, and the market is arguably overbought and ripe for profit-taking here. But, the momentum and the sheer fear of missing out on any more upside (perhaps if new tariffs start to be unwound) is intoxicating. It's not like the market hasn't done stranger things.
We'll weigh the odds below, but first, let's review last week's economic announcements and preview this week's news.
Economic Data
There was a good amount of economic data unveiled last week, but none as important as Wednesday's interest rate decision from the Federal Reserve. The FOMC went ahead and dished out the expected quarter-point hike, but perhaps more interesting is the fact that it removed the 'accommodative' language from its rationalization. That's good and bad, in that it means the Fed likes the way economic strength has become self-sustaining, but it also means future rate hikes are guaranteed for a while.
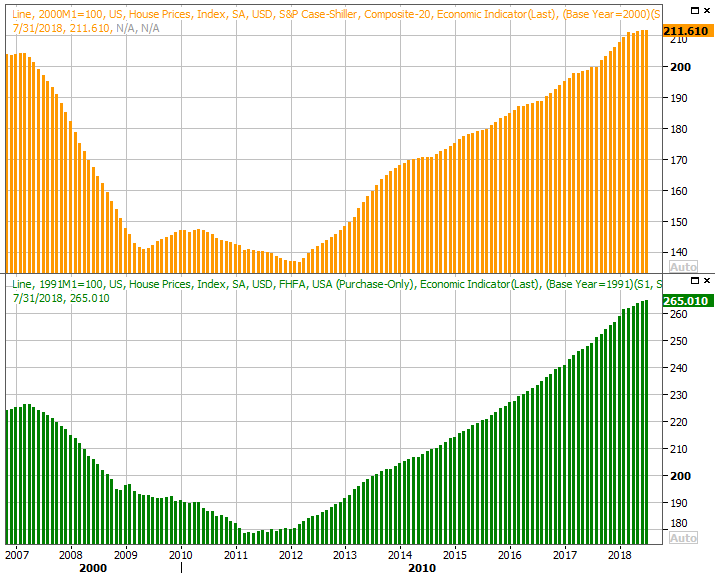
It was also a relatively important week for real estate, as a couple of home price reports were logged along with the new-home sales figures for August.
You'll recall that the sheer number of home-purchase transactions has been fading, but also that prices were still in a firm uptrend. It's a sign that for the fewer buyers and sellers out there, the market is (relatively) solid.
That dynamic didn't change in July. The Case-Shiller Home Price Index as well as the FHFA Housing Price Index continued their slow but reliable uptrends. Do notice, however, that even that uptrend seems to be slowing.
Home Price Index Charts
 [1]
[1]
Source: Thomson Reuters
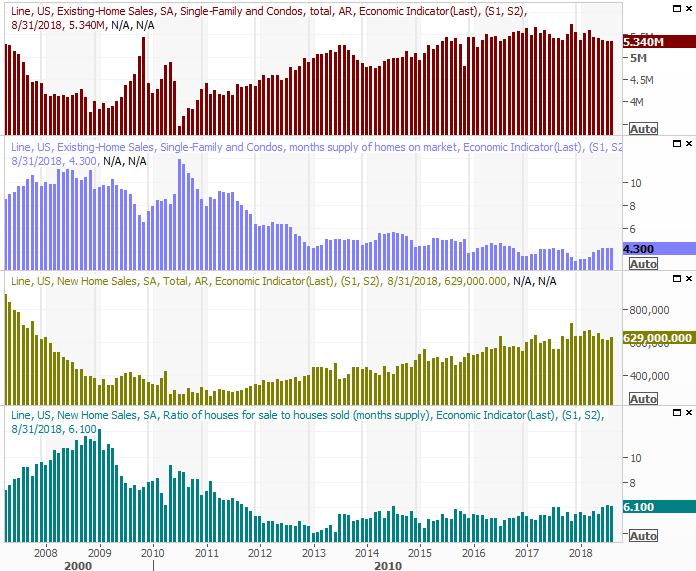
Sales of new homes were also up from July's levels, essentially on target, and at least temporarily quelling a budding downtrend. Even so, sales of existing homes are still flat – at best – while new homes are hardly in an uptrend. Inventory levels appear to be in a new uptrend to boot.
New and Existing Home Sales Charts
 [2]
[2]
Source: Thomson Reuters
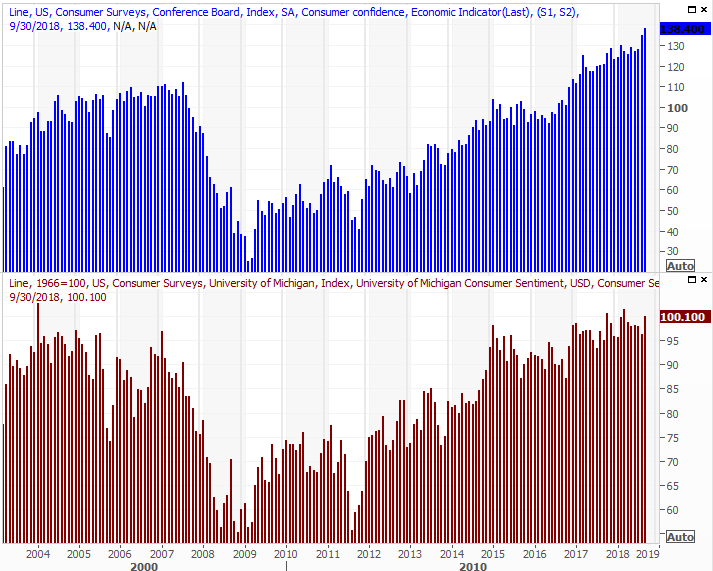
And, it was a huge week for consumer sentiment measures. It's still good. Though the third and final reading for the Michigan Sentiment Index was well up from August's final score, it wasn't at multi-year highs. The Conference Board's measure of consumer confidence, however, did race to multi-year high levels.
Consumer Sentiment Charts
 [3]
[3]
Source: Thomson Reuters
To the extent it matters, this optimism is not only a sign of what consumers see, but how much they're willing to spend and invest.
Everything else is on the grid.
Economic Calendar
 [4]
[4]
Source: Briefing.com
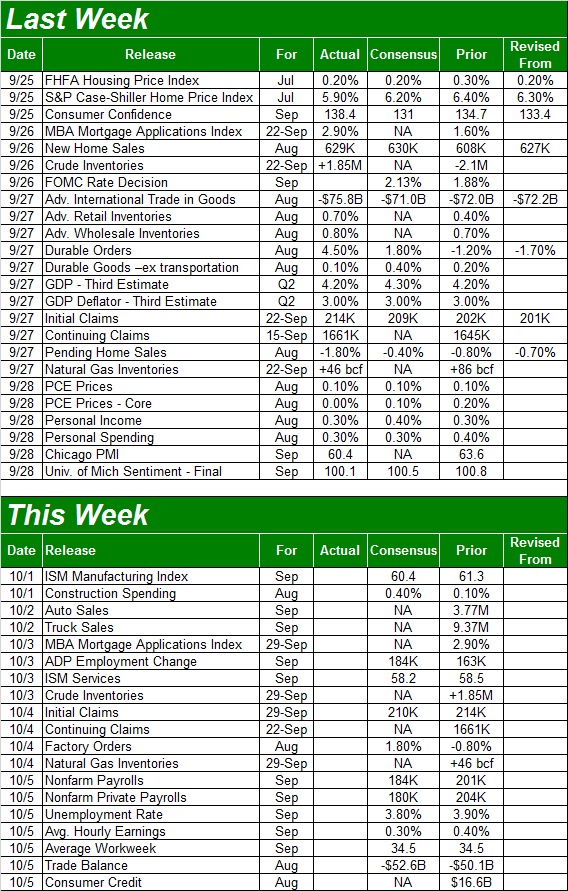
This week won't be quite as busy, but it will be an important one. On Friday we'll get the employment report for September. Before that though, on Tuesday we'll hear about September's auto sales. We desperately need a jolt here, though it's not likely to happen.
Automobile Sales (Annualized) Charts
 [5]
[5]
Source: Thomson Reuters
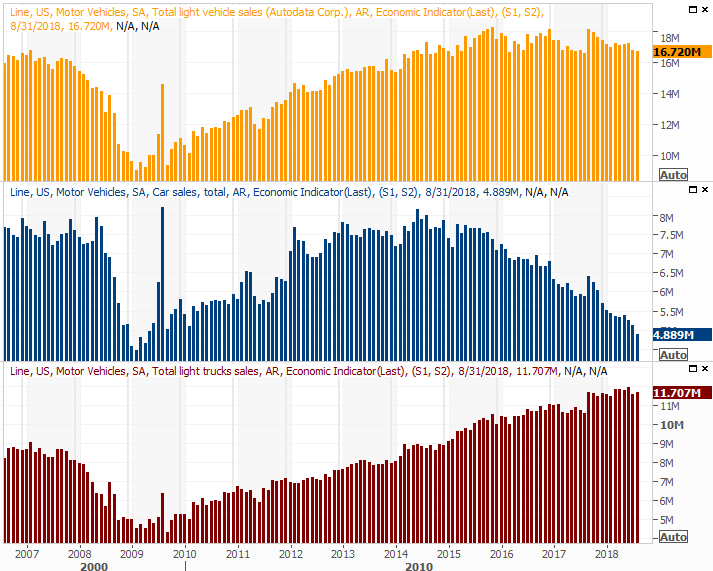
Also this week we'll get September's ISM Services report, though we won't get the Manufacturing version of the report until next week. Either way, both remain above the pivotal level, and are expected to remain above that mark through this month's readings.
ISM Index Charts
 [6]
[6]
Source: Thomson Reuters
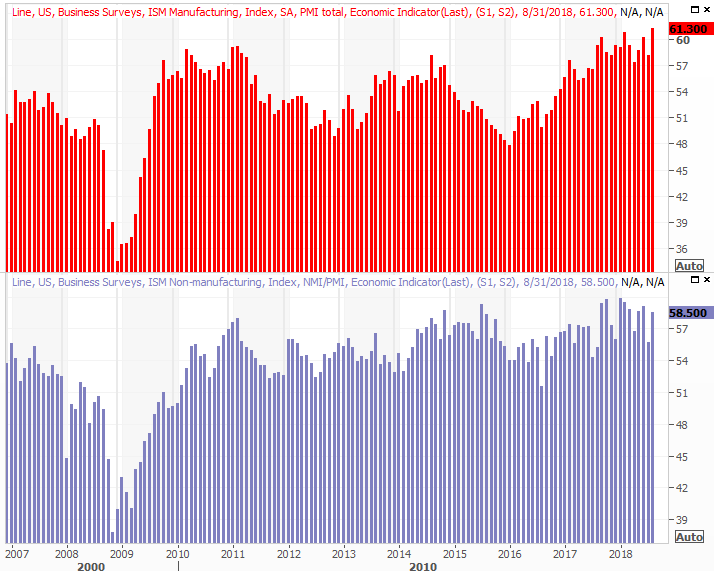
The big Kahuna, of course, will be unveiled on Friday. As of the latest look, economists expect the unemployment rate to edge a little lower, from 3.9% to 3.8%, on the heels of 184,000 newly-created jobs.
Payroll Growth, Unemployment Rate Charts
 [7]
[7]
Source: Thomson Reuters
As has been noted before, take the touted numbers with a grain of salt. In a full-employment scenario, it's difficult to maintain an unemployment rate let alone lower it. And, job-growth tallies will look low because most everyone has a job. In this situation it's higher wages and better jobs that are most indicative of economic growth. We'll explore that data in-depth at the website the day of the report.
Index Analysis
One bad week doesn't necessarily end a long-term uptrend. So, don't read too much into last week's 0.5% setback for the S&P 500. On the other hand, if there was ever a time to be concerned the profit-takers are ready to crawl out of the woodwork, this is it. The latter half of September is usually bearish, and that bearish momentum generally lasts well into the heard of October.
On the other hand, if there was ever a time to count on the market doing something completely unpredictable, this is it.
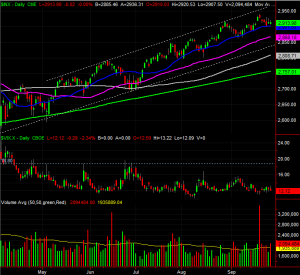
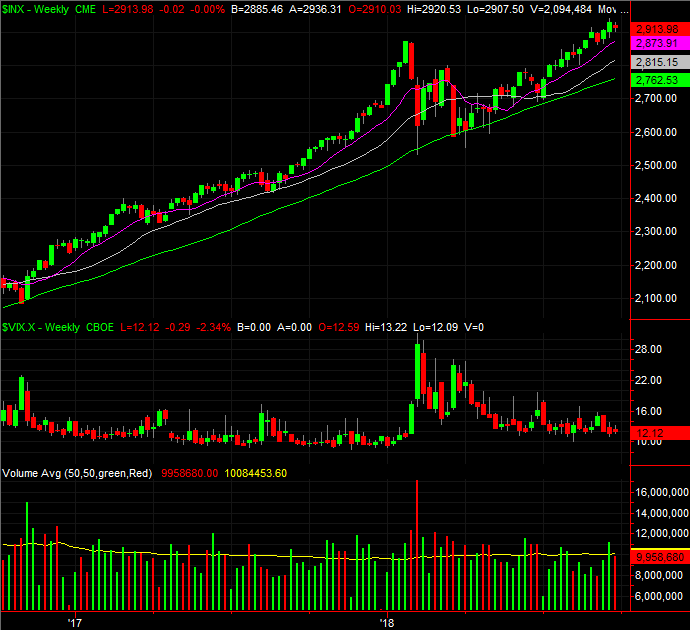
We'll start this week's visual analysis with a look at the weekly chart of the S&P 500, just because this view gives us the most perspective. As you can see, the 14% advance from the early April low leaves the market in an overbought condition, but one only has to look back t0 2017 to see that the index has been more than able to continue rallying – and even accelerate – through more overbought conditions.
S&P 500 Weekly Chart, with Volume
 [8]
[8]
Source: TradeStation
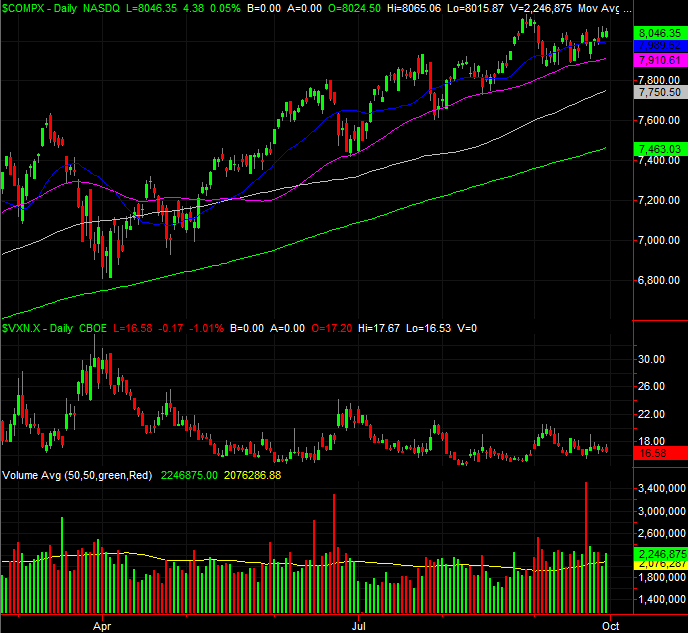
Zooming into the daily chart of the S&P 500 we can flesh out a little more detail about last week's weakness. Most important, notice how even though the market lost ground, it's still holding above the 20-day moving average line (blue). We can also see that the VIX isn't even testing the waters of making an upward move that would normally coincide with a marketwide selloff.
S&P 500 Weekly Chart, with Volume
 [9]
[9]
Source: TradeStation
Ditto for the NASDAQ Composite.
NASDAQ Composite Daily Chart, with Volume
 [10]
[10]
Source: TradeStation
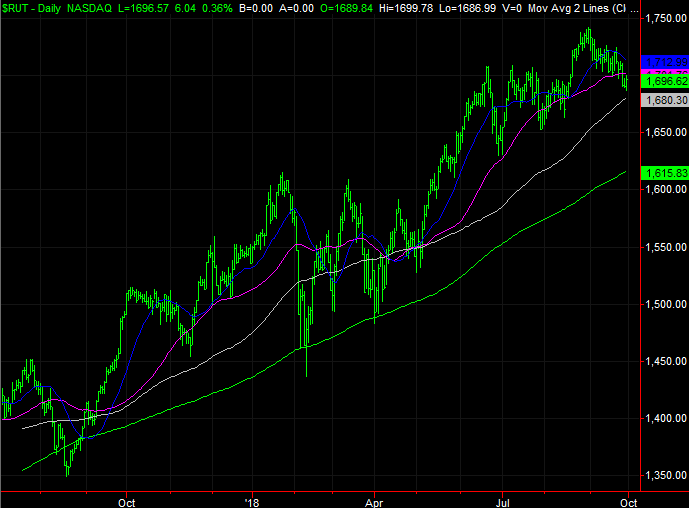
It's interesting though. While the large cap S&P 500 index and the (mostly) large cap NASDAQ Composite are holding the line, the Russell 2000 Small Cap Index isn't doing the same. Last week it broke under its 20-day and 50-day (purple) moving average lines.
Russell 2000 Daily Chart
 [11]
[11]
Source: TradeStation
Is that significant? There are two interpretations of that nuance. Not surprisingly, they're at opposite ends of the spectrum.
It's bullish in the sense that investors may be wading out of small caps – which may have been safe havens from the tariff war – and back into large caps in anticipation that tariff-mania is about to cool off. The problem with that theory is, large caps also lost ground last week, suggesting it wasn't a mere tit-for-taw swap out.
The disparity between small caps and large caps is bearish in the sense that investors are starting to shed all stocks, and are starting by selling their small caps in earnest first. The fact that all stocks lost ground last week lends itself to this latter theory.
The market is still on the fence, but the deck is stacked against stocks here. That doesn't matter, however, until and unless the NASDAQ and the S&P 500 break below the moving average lines discussed above.
If that happens, a week from now we'll have a lot more to talk about… namely, downside targets.